
Abstract:
The techniques that seek to attend the user’s needs in a product’s development, like the Requirements Engineering (RE) and the User-Centred Design (UCD) have been increasingly used in different areas. The RE is a computer science area that seeks the development of methods and techniques to software elaboration, while the UCD is an iterative design process, where designers focus on users and place them at the center of the development process. This study approached the application of these techniques to developing a WebGIS oriented to university applications. In this research an interface to the WebGIS was proposed, with an application to assist the navigation in indoor and outdoor environments. The study case was applied in Polytechnic Center campus of Federal University of Paraná (UFPR). The interface was evaluated through tests with users, using tasks that allowed to explore its functionality. The methodology used was elaborated by Brooke (1996) to measure the usability through the System Usability Scale (SUS), and the classification of this scale adopted by Bangor, Kortum and Miller (2009) and Sauro (2011). The results show punctuation indices based on the SUS, what indicated that the use of UCD techniques allow to improve the interface development in a WebGIS.
Keywords:
WebGIS; Requirements Engineering; User-Centred Design; Usability
Resumo:
Técnicas que buscam atender às necessidades do usuário no desenvolvimento de um produto, como a Engenharia de Requisitos (RE) e o User Centred Design (UCD), vem sendo cada vez mais utilizadas em diferentes áreas. A RE é uma área de informática que busca o desenvolvimento de métodos e técnicas para elaboração de software, enquanto o UCD é um processo de design iterativo, onde os designers focam nos usuários e os colocam no centro do processo de desenvolvimento. Este estudo abordou a aplicação dessas técnicas no desenvolvimento de um WebGIS direcionado para aplicações universitárias. Nesta pesquisa foi proposta uma interface para este WebGIS, com uma aplicação para auxiliar a navegação em ambientes internos e externos. O estudo de caso foi aplicado no campus do Centro Politécnico da Universidade Federal do Paraná (UFPR). A interface foi avaliada por meio de testes com usuários, utilizando tarefas que permitiam explorar a funcionalidade da ferramenta. A metodologia utilizada para medir a usabilidade foi elaborada por Brooke (1996) por meio da Escala de Usabilidade do Sistema (SUS), sendo a classificação desta escala adotada por Bangor, Kortum e Miller (2009) e Sauro (2011). Os resultados mostraram índices de pontuação baseados no SUS, que indicaram que o uso de técnicas de UCD permite melhorar o desenvolvimento de interface em um WebGIS.
Palavras-chave:
WebGIS; Engenharia de Requisitos; User-Centred Design; Usabilidade
1. Introduction
Among the existing technologies to manipulate geospatial data, the use of Web Geographic Information Systems (WebGIS) have been popularized, thanks to the facility of its usage (Jacob et al. 2009Jacob, R. Zheng, J. Ciepluch, B. Mooney, P. & Winstanley, A. 2009. Campus Guidance System for International Conferences Based on OpenStreetMap. 5886. 187-198. 10.1007/978-3-642-10601-9_13.
https://doi.org/10.1007/978-3-642-10601-...
; Huang and Gartner 2010Huang, H. and Gartner, G. 2010. A Survey of Mobile Indoor Navigation Systems. Lecture Notes in Geoinformation and Cartography, p 305-319.; Schrader-Patton, Ager and Bunzel 2010Schrader-Patton, C. Ager, A. and Bunzel, K. GeoBrowser deployment in the USDA forest service: a case study. 2010. In: Proceedings of the 1st International Conference and Exhibition on Computing for Geospatial Research & Application. ACM. p. 28.; Yan and Guo 2012Yan, P. and Guo, J. 2012. Design of Digital Campus Based on WebGIS. International Conference on Information Technology and Management Science (ICITMS 2012) Proceedings, [s.l.], p.41-46, 2013. Springer Berlin Heidelberg. 10.1007/978-3-642-34910-2
https://doi.org/10.1007/978-3-642-34910-...
; Dalton 2013Dalton, C. M. 2013. Sovereigns, Spooks, and Hackers: An Early History of Google Geo Services and Map Mashups. Cartographica: The International Journal for Geographic Information and Geovisualization, [s.l.], v. 48, n. 4, p.261-274, dez. 2013. University of Toronto Press Inc. (UTPress). http://dx.doi.org/10.3138/carto.48.4.1621.
http://dx.doi.org/10.3138/carto.48.4.162...
; Zlatanova et al. 2013Zlatanova, S. Sithole, G. Nakagawa, M. and Gist, A. 2013. Problems in Indoor Mapping and Modelling. ISPRS - International Archives of The Photogrammetry, Remote Sensing and Spatial Information Sciences . XL-4/W4. 10.5194/isprsarchives-XL-4-W4-63-2013.
https://doi.org/10.5194/isprsarchives-XL...
; Torres-Sospedra 2015Veryzer, R. W. and Borja de Mozota, B. 2005. The impact of user-oriented design on new product development: An examination of fundamental relationships. Journal of product innovation management, 22(2), 128-143.; Chilela 2016Chilela, J. G. 2016. Web Geographic Information Systems (WebGIS) for smart campus and facility management. Dissertação de Mestrado. Department of Mathematics of Faculty of Science and Technology at University of Coimbra, Portugal.; Blachowski, Łuczak and Zagrodnik 2018Blachowski, J. Łuczak, J. and Zagrodnik, P. 2018. Participatory GIS in design of the Wroclaw University of Science and Technology campus web map and spatial analysis of campus area quality. E3s Web of Conferences, [s.l.], v. 29, p.00025. EDP Sciences. http://dx.doi.org/10.1051/e3sconf/20182900025.
http://dx.doi.org/10.1051/e3sconf/201829...
; Silva and Sá 2019Silva, P. A. Sá, L. A. C. M. 2015. Mapeamento digital para web do campus recife da ufpe. In: XXIII CONIC, VII CONITI, IV ENIC, 23., Recife: UFPE, 2015. v. 1, p. 1 - 4. Available at: <Available at: https://bit.ly/2IhIROj > [Acessed 2 jun. 2019]
https://bit.ly/2IhIROj...
). Among its advantages it is highlighted the capacity of manipulate geospatial data in a simplified way, when compared to a usual Geographic Information Systems (GIS) software, becoming possible its usage through web browsers. The development of a web application is based on the client-server architecture, namely, the application processing is divided between the responsible for the data maintenance (server) and the responsible for its consumption, or usage (client). Besides that, the usage of geoservices for data processing is also an advantage on using a WebGIS. With the usage of geoservices the spatial data are obtained, stored or processed remotely, by the geoservice server. In this paper, a WebGIS will be considered as web application that allows the integration of functions in an interactive map (Sluter 2001Sluter, C. R. 2001. Sistema Especialista para geração de mapas temáticos. Revista Brasileira de Cartografia, v. 53, n. 1.).
A WebGIS must be projected and developed according to each application´s need, for which there will be chosen functionalities that will be available to the user, alongside with the access of the interest data. Its development is related to the cartographic design for which is intended to, and it must be supported by the software project to its elaboration.
The growing size and complexity of the university campus unleash the necessity of maps for orientation and navigation, the so-called “campus maps”. Although many institutions and universities hold its campus maps in digital formats, the functionality of these maps are not well defined yet (Mittlböck, Knoth and Vockner 2017Mittlböck, M. Knoth, L. and Vockner, B. 2017. Universitäre Campus Maps-Beispiele aus Österreich und Nordamerika: Status quo & quo vadis? AGIT Journal, v. 3, p. 374-382.). These maps can be made available in a static way, namely, without active interaction elements on the part of its user, or in an interactive format. The digital interactive map is deemed to be a digital interface between the user and the reality, with computational tools that allow the interaction in the process of cartographic communication. In this context, one of the functions that can be implemented by the cartographer is precisely to design and implement these computational tools that compose the usage environment of the maps and provide them to the users. The users, in turn, can decide how and in which way the information will be seen (Sluter 2001Sluter, C. R. 2001. Sistema Especialista para geração de mapas temáticos. Revista Brasileira de Cartografia, v. 53, n. 1.).
The increase of the complexity of the indoor environments has also grown the demand for tools that allow the people’s location in these environments. The possibility of usage of mobile devices to assist in location and navigation allowed the development of researches directed to these environments (Chow et al. 2018Chow, J. Peter, M. Scaioni, M. and Al-Durgham, M. Indoor Tracking, 2018. Mapping, and Navigation: Algorithms, Technologies, and Applications. Journal of Sensors, [s.l.], v. 2018, p.1-3. Hindawi Limited. http://dx.doi.org/10.1155/2018/5971752.
http://dx.doi.org/10.1155/2018/5971752...
). Most part of these researches is still concentrated in location technologies and its viability (Gunduz et al. 2016Gunduz, M. Isikdag, U. and Basaraner, M. 2016. A review of recent research in indoor modelling & mapping. ISPRS - International Archives of The Photogrammetry, Remote Sensing and Spatial Information Sciences, [Prague, Czech Republic], v. XLI-B4, p.289-294, 13 jun. 2016. Copernicus GmbH. http://dx.doi.org/10.5194/isprsarchives-xli-b4-289-2016.
http://dx.doi.org/10.5194/isprsarchives-...
; Xia et al. 2016Xia, S. Liu, Y. Yuan, G. Zhu, M. and Wang, Z. 2017. Indoor Fingerprint Positioning Based on Wi-Fi: An Overview. ISPRS International Journal of Geo-Information. 6. 135. 10.3390/ijgi6050135.
https://doi.org/10.3390/ijgi6050135...
; Basiri et al. 2017Basiri, A. Lohan, E. S. Moore, T. Winstanley, A. Peltola, P. Hill, C. Pouria, A. and Silva, P. 2017. Indoor location-based services challenges, requirements and usability of current solutions. Computer Science Review, [s.l.], v. 24, p.1-12. Elsevier BV. 10.1016/j.cosrev.2017.03.002
https://doi.org/10.1016/j.cosrev.2017.03...
; Correa et al. 2017Correa, V. A. Barceló, M. Morell, A. and Lopez V. J. 2017. A Review of Pedestrian Indoor Positioning Systems for Mass Market Applications. Sensors (Switzerland). 17. 10.3390/s17081927.
https://doi.org/17. 10.3390/s17081927...
; Chow et al. 2018Chow, J. Peter, M. Scaioni, M. and Al-Durgham, M. Indoor Tracking, 2018. Mapping, and Navigation: Algorithms, Technologies, and Applications. Journal of Sensors, [s.l.], v. 2018, p.1-3. Hindawi Limited. http://dx.doi.org/10.1155/2018/5971752.
http://dx.doi.org/10.1155/2018/5971752...
). However, due to the characteristics of the indoor geospatial information, it is noticed the necessity of efforts that consider its more efficient management (Delazari et al. 2019Delazari, L. Filho, L. Sarot, R. Farias, P. Antunes, A. and Barbosa, S. 2018. Mapping Indoor Environments: Challenges Related to the Cartographic Representation and Routes. 10.1016/B978-0-12-813189-3.00009-5.
https://doi.org/10.1016/B978-0-12-813189...
).
Develop a WebGIS oriented to university campus aims to attend the necessities to access the geospatial information that the universities demand, in addition to attend the increasingly demand of indoor positioning data that the users demand (Huang and Gartner 2010Huang, H. and Gartner, G. 2010. A Survey of Mobile Indoor Navigation Systems. Lecture Notes in Geoinformation and Cartography, p 305-319.; Torres-Sospedra 2015Torres-Sospedra, J. Avariento, J. Rambla, D. Montoliu, R. Casteleyn, S. Benedito-Bordonau, M. Gould, M. and Huerta, J. 2015. Enhancing integrated indoor/outdoor mobility in a smart campus. International Journal of Geographical Information Science. 29. 1-14. 10.1080/13658816.2015.1049541.
https://doi.org/10.1080/13658816.2015.10...
; Chilela 2016Chilela, J. G. 2016. Web Geographic Information Systems (WebGIS) for smart campus and facility management. Dissertação de Mestrado. Department of Mathematics of Faculty of Science and Technology at University of Coimbra, Portugal.; Blachowski, Łuczak and Zagrodnik 2018Blachowski, J. Łuczak, J. and Zagrodnik, P. 2018. Participatory GIS in design of the Wroclaw University of Science and Technology campus web map and spatial analysis of campus area quality. E3s Web of Conferences, [s.l.], v. 29, p.00025. EDP Sciences. http://dx.doi.org/10.1051/e3sconf/20182900025.
http://dx.doi.org/10.1051/e3sconf/201829...
). Besides that, it is a tool that supports a cartographic base that is up to date, in an environment that can provide its access in an easier way (Eder et al. 2015Eder, M. S. Nocete, C. J. Rances, G. L. Tarrosa, E. M. and Yanson, J. N. 2015. Web Interactive Campus Map. International Journal of Scientific & Technology Research, 62-67. ).
In regarding to the software project, observing the complexity to develop a WebGIS application, a couple of solutions and good practices can be used to simplify the start point of this process. The software engineering is a computer science area that seeks the applications of methods and techniques to software development. The usage of the software engineering techniques, allied to the User-Centred-Design (UCD), seeks to provide the development of an application that attends the desired usability requirements and provides a more suitable environment for the users. However, user-focused design approaches have been discussed by several researchers using different terminology: “empathic design”, “contextual” or “inclusive” (Zoltowski, Oakes and Cardella 2012Zoltowski, C. B., Oakes, W. C. and Cardella, M. E. 2012. Students’ ways of experiencing human-centered design. Journal of Engineering Education, 101(1), 28-59.), as well as “being centered design human” or “customer-centered” (Veryzer and Mozota 2005Veryzer, R. W. and Borja de Mozota, B. 2005. The impact of user-oriented design on new product development: An examination of fundamental relationships. Journal of product innovation management, 22(2), 128-143.). In this context, UCD is a set of techniques, methods, procedures, and processes, as well as a philosophy that puts the user in the center of the development process (Detweiler 2007Detweiler, M. 2007. Managing UCD within agile projects. Interactions, [s.l.], v. 14, n. 3, p.40-42. Association for Computing Machinery (ACM). http://dx.doi.org/10.1145/1242421.1242447.
http://dx.doi.org/10.1145/1242421.124244...
; Da Silva et al. 2015Silva, P. A. Sá, L. A. C. M. 2015. Mapeamento digital para web do campus recife da ufpe. In: XXIII CONIC, VII CONITI, IV ENIC, 23., Recife: UFPE, 2015. v. 1, p. 1 - 4. Available at: <Available at: https://bit.ly/2IhIROj > [Acessed 2 jun. 2019]
https://bit.ly/2IhIROj...
). Using this approach it is aimed to obtain a higher degree of effectiveness, efficiency and satisfaction on the project, improving its usability from its users point of view.
Previous researches realized by the Cartography and GIS research group of the Geodesics Science Post-Graduation Program of UFPR (PPGCG-UFPR), about the graphic representation of indoor environments of UFPR’s Polytechnic Center campus, was created the UFPR CampusMap project (<www.campusmap.ufpr.br>), also known by its abbreviation UCM. This project has as its main goal the implementation of an environment with information about UFPR indoor and outdoor environments (Delazari et al. 2019Delazari, L. Filho, L. Sarot, R. Farias, P. Antunes, A. and Barbosa, S. 2018. Mapping Indoor Environments: Challenges Related to the Cartographic Representation and Routes. 10.1016/B978-0-12-813189-3.00009-5.
https://doi.org/10.1016/B978-0-12-813189...
). In this case, the need to develop research related to this type of project. Thus, several studies were realized: navigation through maps available in offline mode by Android application (Lima 2017Lima, C. R. 2017. Desenvolvimento de aplicativo para dispositivos móveis com mapas indoor para o projeto UFPR Campus map. Trabalho de graduação (Engenharia Cartográfica e de Agrimensura) - Setor Ciências da Terra. Universidade Federal do Paraná, Curitiba.); evaluation of cartographic representations for indoor environments using mobile devices (Sarot and Delazari 2018Sarot, R. V. andDelazari, L.S.. 2018. Evaluation of mobile device Indoor maps for orientation tasks. Boletim de Ciências Geodésicas, v. 24, n. 4, p. 564-584.); user’s positioning through QR-Codes (Antunes and Delazari 2019Antunes, A. and Delazari, L. 2019. Landmarks evaluation with use of qr-code for positioning indoor environment. Bulletin of Geodetic Sciences. 25. 10.1590/s1982-21702019000400024.
https://doi.org/10.1590/s1982-2170201900...
); and indoor positioning through usage of available Wi-Fi networks (Aravena 2019Aravena, C. A. A. 2019. Desenvolvimento de aplicação para posicionamento indoor por meio das redes Wifi em ambientes internos. Dissertação (Mestrado em Ciências Geodésicas) - Departamento de Geomática. Universidade Federal do Paraná, Curitiba.). Currently, the UCM project is being developed by CEPAG - Center of Applied Research in Geoinformation (<www.cepag.ufpr.br>) from UFPR. Beside the researches mentioned above, CEPAG embraces other projects, such as the updating of the cartographic database and the creation of a spatial database of UFPR, the maintenance and expansion of the topographic reference network of the UFPR campus, as well as other projects in partnerships with several companies of the private sector.
Considering this context, this article presents the results obtained in the development of a WebGIS for indoor and outdoor environments of the Federal University of Paraná (UFPR) campus with the usage of UCD techniques. This choice is due to three factors: the availability of existing indoor and outdoor geospatial data from some campus; existing research about the representation of these data, and the existence of the necessary tools to assist the desired functionalities. It is also needed to consider the existence of few WebGIS initiatives that allow the transition between geospatial data of indoor and outdoor environments, being more common the approach of these environments separately (Jacob et al. 2009Jacob, R. Zheng, J. Ciepluch, B. Mooney, P. & Winstanley, A. 2009. Campus Guidance System for International Conferences Based on OpenStreetMap. 5886. 187-198. 10.1007/978-3-642-10601-9_13.
https://doi.org/10.1007/978-3-642-10601-...
; Huang and Gartner 2010Huang, H. and Gartner, G. 2010. A Survey of Mobile Indoor Navigation Systems. Lecture Notes in Geoinformation and Cartography, p 305-319.; Yan and Guo 2012Yan, P. and Guo, J. 2012. Design of Digital Campus Based on WebGIS. International Conference on Information Technology and Management Science (ICITMS 2012) Proceedings, [s.l.], p.41-46, 2013. Springer Berlin Heidelberg. 10.1007/978-3-642-34910-2
https://doi.org/10.1007/978-3-642-34910-...
; Zlatanova et al. 2013Zlatanova, S. Sithole, G. Nakagawa, M. and Gist, A. 2013. Problems in Indoor Mapping and Modelling. ISPRS - International Archives of The Photogrammetry, Remote Sensing and Spatial Information Sciences . XL-4/W4. 10.5194/isprsarchives-XL-4-W4-63-2013.
https://doi.org/10.5194/isprsarchives-XL...
; Chilela 2016Chilela, J. G. 2016. Web Geographic Information Systems (WebGIS) for smart campus and facility management. Dissertação de Mestrado. Department of Mathematics of Faculty of Science and Technology at University of Coimbra, Portugal.; Silva and Sá 2019Silva, P. A. Sá, L. A. C. M. 2015. Mapeamento digital para web do campus recife da ufpe. In: XXIII CONIC, VII CONITI, IV ENIC, 23., Recife: UFPE, 2015. v. 1, p. 1 - 4. Available at: <Available at: https://bit.ly/2IhIROj > [Acessed 2 jun. 2019]
https://bit.ly/2IhIROj...
).
2. Methodology
To the development of the WebGIS was proposed and implemented both a Geographic Database and a web interface. Finally, was proposed a list of tasks and the application of a usability test to a group of users, in order to quantify and evaluate the usability of the proposed interface. In all steps of the tool’s elaboration, the user’s context was considered, aiming the application of UCD techniques.
a) Definition of the user’s needs
From the project’s initial proposal, were defined the user’s needs in the context of the WebGIS application to be developed. In this regard, was applied the brainstorming method in reunions with participants that were involved in the project. This method consists in reunite a set of stakeholders to inspire one another in the idea’s generation phase and for the process of problems solution. Among the users were considered undergraduate and graduate students, professors and technical administrative staff. For these reunions, were collected the user’s and the system’s requirements, as well as which data and functionality would be available in the project.
b) Requirements definition
Considering the requirements engineering, took place the definition of the user’s needs through the requirement’s elicitation. The requirements represent the base for the efficient conception of the system and must be used during all its implementation process. As mentioned by Hull et al. (2005Hull, E. Jackson, K. and Dick, J. 2005. Requirements Engineering, 2nd edition, Springer.) and Sommerville (2011Sommerville, I. 2011. Engenharia de Software, 9 edição. Pearson, Addison Wesley.), incomplete or poorly defined requirements may entail future problems, such as mistakes, misleading conclusions or systems that do not achieve the proposed goals.
c) Definition of the project’s data
The geospatial data were categorized in the geographic database as outdoor and indoor. The aim was to develop the WebGIS in the UCM project context, with the availability of geospatial data of outdoor (streets, sidewalks, buildings) and indoor (classrooms, laboratories, restrooms) environments. The survey of these data was done by several methods, such as aerosurvey, topographic survey and in loco observations, in both its geometry and attributes.
d) Characterization of the study area
The study area is the UFPR Polytechnic Center campus, located in the Jardim das Américas neighborhood, Curitiba, Paraná, Brazil (Figure 1). This area was defined due to the majority of the available data being of this campus, its environment diversity (classrooms, professor’s rooms, laboratories, secretariats, cafeterias), its intense circulation of students and visitors and because it is the biggest UFPR campus. Although, subsequently, with the expansion of the cartographic database, the developed systems can be easily applied to the others campus.

e) User Tests
For the WebGIS development tests, was realized a set of tasks with a group of 31 users using the developed tool (Table 1). This set of tasks was built aiming to explore the WebGIS’ functionality, in combination with the user’s experience when using it. Besides that, the tasks were defined to simulate a real interaction of the users with the WebGIS, in order to explore the maximum of its functionality.
According to Table 1, it may refer that tasks 5 and 6 are dependent on task 4. Tasks 3 and 7 are correlated because its starting point is the assumption of searching for an indoor environment.
Among the list of tasks, was requested to the users answered if they could or not realize the tasks. If they could not realize the tasks, it was requested them to describe why. The analysis of the interface’s effectiveness and efficiency was discussed based on the results received from the users on executing the tasks. A qualitative approach of the results was carried out and the descriptions of the mistakes were used as a feedback of possible mistakes found on the interface. By the end of the execution of the tasks by the users, it was applied the Brooke’s (1996Brooke, J. 1996. SUS-A quick and dirty usability scale. Usability evaluation in industry, v. 189, n. 194, p. 4-7.) System Usability Scale (SUS) questionnaire, aiming the evaluation of the satisfaction, in a subjective way through a quantitative approach.
The SUS questionnaire is a usability evaluation test created by Brooke (1996Brooke, J. 1996. SUS-A quick and dirty usability scale. Usability evaluation in industry, v. 189, n. 194, p. 4-7.) in the Digital Equipment Corporation’s laboratory, in the United Kingdom, as a subjective evaluation test. This questionnaire is based on the Likert scale, built through the identification of events that lead to attitude expressions that are desired to be captured.
For the application of this questionnaire in Portuguese and to guarantee the original meaning of the sentences, it was used the work from Tenório et al. (2010Tenório, J. Cohrs, F. Sdepanian, V. Pisa, I. and Marin, H. 2011. Desenvolvimento e Avaliação de um Protocolo Eletrônico para Atendimento e Monitoramento do Paciente com Doença Celíaca. Revista de Informática Teórica e Aplicada. 17. 210. 10.22456/2175-2745.12119.
https://doi.org/10.22456/2175-2745.12119...
). These authors realized a reverse translation to Portuguese language to preserve the questionnaire original content. Thus, the questions were translated to Portuguese language and, after that, the authors submitted the translation to a professional translator, that realized the translation to the English language. It was aimed that the translation to the Portuguese language was kept really close to the original text (Tenório et al. 2010Tenório, J. Cohrs, F. Sdepanian, V. Pisa, I. and Marin, H. 2011. Desenvolvimento e Avaliação de um Protocolo Eletrônico para Atendimento e Monitoramento do Paciente com Doença Celíaca. Revista de Informática Teórica e Aplicada. 17. 210. 10.22456/2175-2745.12119.
https://doi.org/10.22456/2175-2745.12119...
). Thus, Table 2 presents the questions used in the applied questionnaire. Although the presented questions may be hard to comprehend, it was chosen to keep the translation realized by Tenório et al. (2010Tenório, J. Cohrs, F. Sdepanian, V. Pisa, I. and Marin, H. 2011. Desenvolvimento e Avaliação de um Protocolo Eletrônico para Atendimento e Monitoramento do Paciente com Doença Celíaca. Revista de Informática Teórica e Aplicada. 17. 210. 10.22456/2175-2745.12119.
https://doi.org/10.22456/2175-2745.12119...
).
From the work from Tenório et al. (2010)Tenório, J. Cohrs, F. Sdepanian, V. Pisa, I. and Marin, H. 2011. Desenvolvimento e Avaliação de um Protocolo Eletrônico para Atendimento e Monitoramento do Paciente com Doença Celíaca. Revista de Informática Teórica e Aplicada. 17. 210. 10.22456/2175-2745.12119.
https://doi.org/10.22456/2175-2745.12119...
, it is possible to identify the questions classification of the SUS questionnaire in relation to the usability rates of effectiveness, efficiency and satisfaction, adapting the classification suggested in the work from Nielsen (1993Nielsen, Jakob. 1993. Usability engineering. EUA: AP PROFESSIONAL.). Thus, the suggested classification according to the questionnaire questions is:
-
Effectiveness: questions 2, 3, 4, 7 and 10
-
Efficiency: questions 5, 6 and 8; and
-
Satisfaction: questions 1, 4 and 9.
To measure the developed WebGIS usability, were used the results obtained in the punctuation of the SUS scale, applying the methods of Brooks (1996)Brooke, J. 1996. SUS-A quick and dirty usability scale. Usability evaluation in industry, v. 189, n. 194, p. 4-7., Sauro (2011Sauro, J. 2011. Measuring Usability with The System Usability Scale (SUS), Measuring U, 2 fev. Available at: <Available at: https://www.measuringu.com/sus > [Acessed 5 april 2019]
https://www.measuringu.com/sus...
) and Bangor, Kortum and Miller (2009Bangor, A. Kortum, P. and Miller, J. 2009. Determining what individual SUS scores mean: Adding an adjective rating scale. Journal of usability studies, v. 4, n. 3, p. 114-123.).
3. Results and discussions
In the first step of development, was realized the survey of the information referred to the users and others involved in the system, through meetings with the brainstorming method. This group was made up of students, professors and employees who frequented the campus and directly or indirectly participated in the UCM project deploy. With the results discussed in the meetings, was defined that the target-users of the developed system are any visitor of the Polytechnic Center campus interested in obtaining route information, as well as its structure’s location, besides of users that wish to download cartographic data referent to the campus.
With the definition of the target users of the systems, were observed two distinct use contexts for the application. They are: (a) assistance to campus navigation, through usage of routs and (b) the access to the download of cartographic data of the campus. Thus, to the survey of the system requirements were used the questions developed por Sluter, Van Elzakker e Ivánová (2016Sluter, C. R. Van Elzakker, C. P. J. M. and Ivánová, I. 2016 Requirements Elicitation for Geo-information Solutions. The Cartographic Journal, [s.l.], v. 54, n. 1, p.77-90, Maney Publishing. http://dx.doi.org/10.1179/1743277414y.0000000092.
http://dx.doi.org/10.1179/1743277414y.00...
), according specifically of the geoinformation in eliciting the requirements and needs of the users to the proposed system. These questions were used so it was possible to understand the several elements needed in the systems, and its relation in the process of the requirements’ survey.
With this survey and observations realized during the meetings, the requirements were classified in functionals (RF) and non-functionals (RNF), besides the creation of the use case diagram. The requirements collected are presented in Table 3 and in sequence is presented the use case diagram (Figure 2).
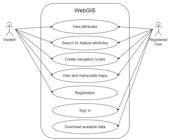
Using the requirements’ survey, it was possible to determine the software specifications that would the used in the WebGIS development. Figure 3 represents it structure.

According presented on Figure 3, the implementation of the Database Management System (DBMS) used PostgreSQL software, and its PostGIS extension to geospatial data. The vector data of the cartographic database of the UFPR campus were stored in this geographic database, while the raster data were stored in pyramid systems, using the Geoserver software for its management. This software also realizes the maps server function to application, providing the necessary geoservices WMS (Web Map Service) and WFS (Web Feature Service). To the WebGIS front-end interface development, were used the HTML, CSS and Javascript languages, and the Bootstrap and Leaflet libraries.
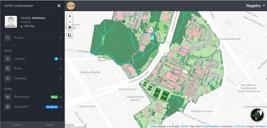
During the process of the requirements’ survey, were also discussed the suggestions to the WebGIS interface, aiming, therefore, to outline its appearance. These discussions were essential to the compatibility of the users interests with the application development. It is highlighted that this process must be cyclic, once there can be observed different users’ interests through time, besides the arising of new requirements. Thus, the interface obtained is presented in Figure 4, which was used to realize the usability tests with users.
With the WebGIS developed and implemented, the next step was to conduct a test in order to measure its usability degree with users. The test was realized with 31 participants in January of 2020. Among the participants there were students and former students of the campus. From this sample, 54.8% were identified as male, 38.7% as female and 6.5% would rather not say. The age of the participants varied from 21 to 42 years, and 38.7% of these were attending or had attended a higher education and 61.3% were attending or had attended a graduation course. From the total of participants, 77.4% had already heard of the UCM project, while 22.6% had not.
For the usability evaluation, it was asked to the users to realize the list of tasks proposed, elaborated with the purpose of exploring the main functionalities of the WebGIS. For each task, the participant had to answer if they could or could not execute it, and in each failure, they should inform the difficulty faced in each task.
Considering that the developed system had a multi-platform aspect, the participant could choose the device for the realization of the tasks. Thus, 80.6% of the participants chose a desktop computer for its realization and only 19.4% chose for the use of a smartphone device. It is highlighted that in this research it was not evaluated the performance of the participants considering the type of device used. The individual performance of the participants is shown in Figure 5, and the general performance by task is shown in Figure 6, where are presented the tasks that were concluded with success and the tasks that were not realized (called as mistakes) by the total of participants.

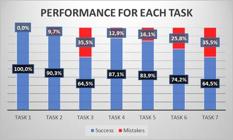
From Figure 5, it can be noted that thirteen users (41.9% out of the total) completed all the tasks successfully, while the others (59.1%) had at least one failure in any of the tasks. The users with failures in three or more tasks represented 22.6% out of the total. Among the tasks that presented more difficulty (3 and 7) observed in Figure 6 were the ones related to the indoor environment search tool.
During the execution of the tasks, was asked to the users to indicate the difficulties found. With this source of information was possible to make corrections in problems pointed out by users to simplify the interaction with the interface. These results are a part of the development cycle of the project in the RE precepts.
After the execution of the tasks, the participants answered the SUS questionnaire adapted to the study case. Using the Brooks (1996) Brooke, J. 1996. SUS-A quick and dirty usability scale. Usability evaluation in industry, v. 189, n. 194, p. 4-7.method to punctuate the SUS scale, the application developed obtained the punctuation 73.5. According Sauro (2011Sauro, J. 2011. Measuring Usability with The System Usability Scale (SUS), Measuring U, 2 fev. Available at: <Available at: https://www.measuringu.com/sus > [Acessed 5 april 2019]
https://www.measuringu.com/sus...
) this punctuation is evaluated as above average (68), and indicates a system classified as “B” in the scale model presented in his research (Sauro 2011Sauro, J. 2011. Measuring Usability with The System Usability Scale (SUS), Measuring U, 2 fev. Available at: <Available at: https://www.measuringu.com/sus > [Acessed 5 april 2019]
https://www.measuringu.com/sus...
). Using the adjective classification proposed by Bangor, Kortum and Miller (2009Bangor, A. Kortum, P. and Miller, J. 2009. Determining what individual SUS scores mean: Adding an adjective rating scale. Journal of usability studies, v. 4, n. 3, p. 114-123.) for the SUS scale, the majority of the participants classified the WebGIS developed as “Excellent” (48.4%), “Reliable” by 9.7% of the participants, “Good” for 25.8% of the participants and “Best imaginable” for 16.1% of the participants.
Using the classification proposed by Tenório et al. (2010) Tenório, J. Cohrs, F. Sdepanian, V. Pisa, I. and Marin, H. 2011. Desenvolvimento e Avaliação de um Protocolo Eletrônico para Atendimento e Monitoramento do Paciente com Doença Celíaca. Revista de Informática Teórica e Aplicada. 17. 210. 10.22456/2175-2745.12119.
https://doi.org/10.22456/2175-2745.12119...
for the SUS questionnaire questions for effectiveness, efficiency and satisfaction, was realized the medium punctuation for the questions, in a scale from 0 to 10. Analyzing individually the punctuation for each user through this method, these usability aspects could be evaluated. The effectiveness questions obtained average 8.0. Among the users with fewer successes, this average was 6.6. In relation to efficiency, the users that realized all the tasks obtained the average 8.5 in this aspect, while the ones who had a smaller number of successes obtained the average of 5.6. Analyzing the aspect of satisfaction, the users with the total of successes obtained the average 8.4, while the users who had a smaller number of successes reached the average of 6.3.
4. Conclusions
This research aimed to develop a WebGIS for indoor and outdoor routes using an interactive navigation system in university campus. For this purpose, it was considered the use of RE resources together with UCD techniques for the proposition of the interface. It was aimed to amplify the studied of the usage of the RE in this aspect once the previous research emphasized the maps analysis and not the interface’s itself. Using the RE resources was possible to obtain the survey of the user’s usage definition and the application, of its functional and nonfunctional requirements, besides the definition of the software structure and the necessary data to the application. Were also used UCD techniques aiming the improvement of the user’s usability with the system.
Based on the obtained results on the WebGIS evaluation using the usability test by SUS method, it was possible to obtain an evaluation of the user’s effectiveness, efficiency and satisfaction characteristics. Besides that, the usage of UCD techniques in the development showed results that corroborate the usage of this technique, such as the survey of the user’s data aiming to improve the interaction with the interface.
Based on the mentioned discussions and the presented results, it was possible to observe that the development of a WebGIS for indoor and outdoor navigation of university campus, using methods and techniques of improving its usability, based on UCD, has proved to be suitable in its user’s context.
During the development of this research it is noted that the time and technical resources used were limiting factors to obtain better results. The sample of participant users in the usability test also did not represent the totality of the diversity of users that the developed system is proposed to embrace. Besides that, other methods of usability evaluation could be adopted, aiming thus a bigger consistency in the results.
Observing the difficulties faced by some users, in set with presented reports, some improvements to the developed system were raised, among them: i) the adjustment in the way of realizing searches by attributes of building names and indoor environments; ii) finding a clearer way of presenting the user the need of the selection of the campus in which it is desire to realize the queries; iii) simplify the register of the user. As the project is still in development, the results of this research will allow to increase solutions that pursue to improve the system.
ACKNOWLEDGMENT
The authors would like to thank the Conselho Nacional de Desenvolvimento Científico e Tecnológico (CNPq) and Coordenação de Aperfeiçoamento de Pessoal de Nível Superior (CAPES) for their financial support (Process: 310312/2017-5 - Produtividade em Pesquisa).
REFERENCES
- Antunes, A. and Delazari, L. 2019. Landmarks evaluation with use of qr-code for positioning indoor environment. Bulletin of Geodetic Sciences 25. 10.1590/s1982-21702019000400024.
» https://doi.org/10.1590/s1982-21702019000400024 - Aravena, C. A. A. 2019. Desenvolvimento de aplicação para posicionamento indoor por meio das redes Wifi em ambientes internos Dissertação (Mestrado em Ciências Geodésicas) - Departamento de Geomática. Universidade Federal do Paraná, Curitiba.
- Bangor, A. Kortum, P. and Miller, J. 2009. Determining what individual SUS scores mean: Adding an adjective rating scale. Journal of usability studies, v. 4, n. 3, p. 114-123.
- Basiri, A. Lohan, E. S. Moore, T. Winstanley, A. Peltola, P. Hill, C. Pouria, A. and Silva, P. 2017. Indoor location-based services challenges, requirements and usability of current solutions. Computer Science Review, [s.l.], v. 24, p.1-12. Elsevier BV. 10.1016/j.cosrev.2017.03.002
» https://doi.org/10.1016/j.cosrev.2017.03.002 - Blachowski, J. Łuczak, J. and Zagrodnik, P. 2018. Participatory GIS in design of the Wroclaw University of Science and Technology campus web map and spatial analysis of campus area quality. E3s Web of Conferences, [s.l.], v. 29, p.00025. EDP Sciences. http://dx.doi.org/10.1051/e3sconf/20182900025
» http://dx.doi.org/10.1051/e3sconf/20182900025 - Brooke, J. 1996. SUS-A quick and dirty usability scale. Usability evaluation in industry, v. 189, n. 194, p. 4-7.
- Chilela, J. G. 2016. Web Geographic Information Systems (WebGIS) for smart campus and facility management Dissertação de Mestrado. Department of Mathematics of Faculty of Science and Technology at University of Coimbra, Portugal.
- Chow, J. Peter, M. Scaioni, M. and Al-Durgham, M. Indoor Tracking, 2018. Mapping, and Navigation: Algorithms, Technologies, and Applications. Journal of Sensors, [s.l.], v. 2018, p.1-3. Hindawi Limited. http://dx.doi.org/10.1155/2018/5971752
» http://dx.doi.org/10.1155/2018/5971752 - Correa, V. A. Barceló, M. Morell, A. and Lopez V. J. 2017. A Review of Pedestrian Indoor Positioning Systems for Mass Market Applications. Sensors (Switzerland). 17. 10.3390/s17081927.
» https://doi.org/17. 10.3390/s17081927 - Dalton, C. M. 2013. Sovereigns, Spooks, and Hackers: An Early History of Google Geo Services and Map Mashups. Cartographica: The International Journal for Geographic Information and Geovisualization, [s.l.], v. 48, n. 4, p.261-274, dez. 2013. University of Toronto Press Inc. (UTPress). http://dx.doi.org/10.3138/carto.48.4.1621
» http://dx.doi.org/10.3138/carto.48.4.1621 - Delazari, L. Filho, L. Sarot, R. Farias, P. Antunes, A. and Barbosa, S. 2018. Mapping Indoor Environments: Challenges Related to the Cartographic Representation and Routes 10.1016/B978-0-12-813189-3.00009-5.
» https://doi.org/10.1016/B978-0-12-813189-3.00009-5 - Detweiler, M. 2007. Managing UCD within agile projects. Interactions, [s.l.], v. 14, n. 3, p.40-42. Association for Computing Machinery (ACM). http://dx.doi.org/10.1145/1242421.1242447
» http://dx.doi.org/10.1145/1242421.1242447 - Eder, M. S. Nocete, C. J. Rances, G. L. Tarrosa, E. M. and Yanson, J. N. 2015. Web Interactive Campus Map. International Journal of Scientific & Technology Research, 62-67.
- Gunduz, M. Isikdag, U. and Basaraner, M. 2016. A review of recent research in indoor modelling & mapping. ISPRS - International Archives of The Photogrammetry, Remote Sensing and Spatial Information Sciences, [Prague, Czech Republic], v. XLI-B4, p.289-294, 13 jun. 2016. Copernicus GmbH. http://dx.doi.org/10.5194/isprsarchives-xli-b4-289-2016
» http://dx.doi.org/10.5194/isprsarchives-xli-b4-289-2016 - Huang, H. and Gartner, G. 2010. A Survey of Mobile Indoor Navigation Systems. Lecture Notes in Geoinformation and Cartography, p 305-319.
- Hull, E. Jackson, K. and Dick, J. 2005. Requirements Engineering, 2nd edition, Springer.
- Jacob, R. Zheng, J. Ciepluch, B. Mooney, P. & Winstanley, A. 2009. Campus Guidance System for International Conferences Based on OpenStreetMap 5886. 187-198. 10.1007/978-3-642-10601-9_13.
» https://doi.org/10.1007/978-3-642-10601-9_13 - Lima, C. R. 2017. Desenvolvimento de aplicativo para dispositivos móveis com mapas indoor para o projeto UFPR Campus map Trabalho de graduação (Engenharia Cartográfica e de Agrimensura) - Setor Ciências da Terra. Universidade Federal do Paraná, Curitiba.
- Mittlböck, M. Knoth, L. and Vockner, B. 2017. Universitäre Campus Maps-Beispiele aus Österreich und Nordamerika: Status quo & quo vadis? AGIT Journal, v. 3, p. 374-382.
- Nielsen, Jakob. 1993. Usability engineering EUA: AP PROFESSIONAL.
- Sarot, R. V. andDelazari, L.S.. 2018. Evaluation of mobile device Indoor maps for orientation tasks. Boletim de Ciências Geodésicas, v. 24, n. 4, p. 564-584.
- Sauro, J. 2011. Measuring Usability with The System Usability Scale (SUS), Measuring U, 2 fev. Available at: <Available at: https://www.measuringu.com/sus > [Acessed 5 april 2019]
» https://www.measuringu.com/sus - Schrader-Patton, C. Ager, A. and Bunzel, K. GeoBrowser deployment in the USDA forest service: a case study. 2010. In: Proceedings of the 1st International Conference and Exhibition on Computing for Geospatial Research & Application ACM. p. 28.
- Silva, P. A. Sá, L. A. C. M. 2015. Mapeamento digital para web do campus recife da ufpe. In: XXIII CONIC, VII CONITI, IV ENIC, 23., Recife: UFPE, 2015. v. 1, p. 1 - 4. Available at: <Available at: https://bit.ly/2IhIROj > [Acessed 2 jun. 2019]
» https://bit.ly/2IhIROj - Sluter, C. R. 2001. Sistema Especialista para geração de mapas temáticos. Revista Brasileira de Cartografia, v. 53, n. 1.
- Sluter, C. R. Van Elzakker, C. P. J. M. and Ivánová, I. 2016 Requirements Elicitation for Geo-information Solutions. The Cartographic Journal, [s.l.], v. 54, n. 1, p.77-90, Maney Publishing. http://dx.doi.org/10.1179/1743277414y.0000000092
» http://dx.doi.org/10.1179/1743277414y.0000000092 - Sommerville, I. 2011. Engenharia de Software, 9 edição. Pearson, Addison Wesley.
- Tenório, J. Cohrs, F. Sdepanian, V. Pisa, I. and Marin, H. 2011. Desenvolvimento e Avaliação de um Protocolo Eletrônico para Atendimento e Monitoramento do Paciente com Doença Celíaca. Revista de Informática Teórica e Aplicada 17. 210. 10.22456/2175-2745.12119.
» https://doi.org/10.22456/2175-2745.12119 - Torres-Sospedra, J. Avariento, J. Rambla, D. Montoliu, R. Casteleyn, S. Benedito-Bordonau, M. Gould, M. and Huerta, J. 2015. Enhancing integrated indoor/outdoor mobility in a smart campus. International Journal of Geographical Information Science 29. 1-14. 10.1080/13658816.2015.1049541.
» https://doi.org/10.1080/13658816.2015.1049541 - Veryzer, R. W. and Borja de Mozota, B. 2005. The impact of user-oriented design on new product development: An examination of fundamental relationships. Journal of product innovation management, 22(2), 128-143.
- Xia, S. Liu, Y. Yuan, G. Zhu, M. and Wang, Z. 2017. Indoor Fingerprint Positioning Based on Wi-Fi: An Overview. ISPRS International Journal of Geo-Information 6. 135. 10.3390/ijgi6050135.
» https://doi.org/10.3390/ijgi6050135 - Yan, P. and Guo, J. 2012. Design of Digital Campus Based on WebGIS International Conference on Information Technology and Management Science (ICITMS 2012) Proceedings, [s.l.], p.41-46, 2013. Springer Berlin Heidelberg. 10.1007/978-3-642-34910-2
» https://doi.org/10.1007/978-3-642-34910-2 - Zlatanova, S. Sithole, G. Nakagawa, M. and Gist, A. 2013. Problems in Indoor Mapping and Modelling. ISPRS - International Archives of The Photogrammetry, Remote Sensing and Spatial Information Sciences . XL-4/W4. 10.5194/isprsarchives-XL-4-W4-63-2013.
» https://doi.org/10.5194/isprsarchives-XL-4-W4-63-2013 - Zoltowski, C. B., Oakes, W. C. and Cardella, M. E. 2012. Students’ ways of experiencing human-centered design. Journal of Engineering Education, 101(1), 28-59.
-
ERRATUM
On all pages where it reads:Boletim de Ciências Geodésicas, 27(1)Should read:Boletim de Ciências Geodésicas, 27(spe)Bulletin of Geodetic Sciences, 27(spe): e2021007, 2021
Publication Dates
-
Publication in this collection
29 Jan 2021 -
Date of issue
2021
History
-
Received
30 June 2020 -
Accepted
29 Nov 2020

 Source: The authors (2020).
 Source: The authors (2020).
 Source: The authors (2020).
 Source: The authors (2020).
 Source: The authors (2020).
 Source: The authors (2020).