
 Titanium Particles Released from Dental Implants Under Fluoride Exposure Interact with Macrophages
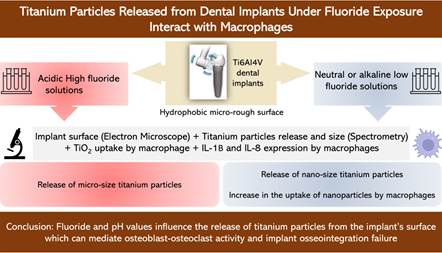
Este estudo foi projetado para investigar a influência do flúor e do valor de pH na liberação de partículas de titânio de implantes dentários de Ti6Al4V com superfície microrugosa hidrofóbica, produzida por técnicas de jateamento de areia e ataque ácido; e correlacionar o tamanho das partículas com sua captação por macrófagos e a expressão de citocinas inflamatórias. Quinze implantes dentários foram imersos em cinco soluções de teste com diferentes concentrações de flúor e valores de pH. Três implantes controle foram analisados por microscopia eletrônica de varredura, e quinze implantes de teste também foram analisados após a imersão nas soluções de teste. As soluções de imersão foram analisadas quanto ao tamanho e quantidade de partículas/íons de titânio. A captação de partículas de titânio pelos macrófagos e a expressão de IL-1β e IL-8 após a exposição às partículas de titânio foram investigadas. Soluções de teste com alto teor de flúor e acidez resultaram na liberação de partículas de titânio em microescala (4551,7 ± 114,5 nm e 2783 ± 101,13 nm); enquanto aquelas com baixo teor de flúor, pH neutro e ambiente alcalino resultaram na liberação de partículas de titânio em nanoescala (431,2 ± 80,6 nm, 448,3 ± 112 nm e 484,5 ± 85,3 nm, respectivamente). Houve um aumento na captação de nanopartículas pelos macrófagos sem alterar a integridade de sua membrana. O aumento na expressão de IL-1β e IL-8 pelos macrófagos M0 após a exposição às partículas de dióxido de titânio pode ajudar a compreender eventos moleculares específicos das células imunológicas que impulsionam a inflamação peri-implantar em resposta às partículas de titânio. O flúor e os valores de pH influenciam a liberação de partículas de titânio da superfície do implante. Os mediadores inflamatórios ativados são fundamentais para o desequilíbrio na atividade osteoblástica-osteoclástica e para a falha da osseointegração do implante.
Autoria
person Waad Kheder
person Soumya Sheela
person A. R. Samsudin
person Sausan Al Kawas
person Nadia Khalifa
person Ali Qabbani
Correspondence: Dr. Waad Kheder, Department of Restorative Dentistry, College of Dental Medicine, University of Sharjah, PO Box: 27272, Sharjah, UAE. Telephone: +971507547324. Email:
wkheder@sharjah.ac.ae
wkheder@sharjah.ac.ae
Conflict of interest
The authors declare no conflict of interest.
Figuras | Tabelas
 Thumbnail
 Thumbnail
 Thumbnail
 Thumbnail
 Thumbnail
 Thumbnail
 Thumbnail
 Thumbnail
imageopen_in_new
imageBox 1 Parameters and operating conditions of ICP-OES employed for detecting titanium concentrations in test solutions open_in_new

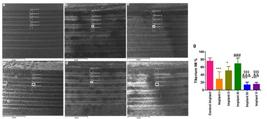
imageFigure 1 a-g: SEM images at crestal part of each implant surface following immersion study. The five selected spectra (1, 3, 5 in the crest of the threads, and 2, 4 in the valleys between threads) were at the same vertical alignment. (Figure 1a. Control implant, b. Implant I (in test solution I: 1.23 % NaF in PBS at pH 7.2), c. Implant II (in test solution II: Alkaline solution at pH 9), d. Implant III (in test solution III: Acidic solution at pH 3), e. Implant IV (in test solution IV: 5 % NaF in PBS at pH 7.2), f. Implant V (in test solution V:1.23% APF at pH 3.5). The average titanium percentage is represented as Mean ± SD in g. A statistically significant difference in the atomic weight. % of Titanium was found between the control implants group and the test implants group. *, **, and *** represent the significant difference between the control and test implants with p values <0.05, 0.001, and 0.0001 respectively. ### (p<0.0001) represents the analysis between implant I and implant III, &&& (p<0.0001) and && (p<0.001) represents the significance between implant II and implant IV and $$$ (p<0.0001) represents the difference between implant III with implant IV and V. open_in_new

imageFigure 2 The post-immersion EDX analysis of all test implants (b, c, d, e, f). (Figure2a. Control implant, b. Implant I (in test solution I: 1.23 % NaF in PBS at pH 7.2), c. Implant II (in test solution II: Alkaline solution at pH 9), d. Implant III (in test solution III: Acidic solution at pH 3), e. Implant IV (in test solution IV: 5 % NaF in PBS at pH 7.2), f. Implant V (in test solution V:1.23% APF at pH 3.5). open_in_new

imageFigure 3 ICP-OES analysis showing titanium ions concentration following implant immersion in five different test solutions. Test solution I (1.23 % NaF in PBS at pH 7.2), test solution II (Alkaline solution at pH 9), test solution III (Acidic solution at pH 3), test solution IV (5 % NaF in PBS at pH 7.2), test solution V (1.23% APF at pH 3.5). The Data are represented as mean ± SD from three separate experiments. One-way ANOVA analysis showed a statistically significant difference in the titanium ion release between the test implants. *** represents p value <0.0001. open_in_new

imageFigure 4: Representative SEM images of dispersed TiO2 (a) NPs and (b) MPs. open_in_new

imageFigure 5 Phase contrast and SEM-EDX images showing the interaction of titanium particles with THP-1-derived M0 macrophages. A, b, and c are phase contrast microscopic images of control cells, cells treated with 100 µg/mL TiO2 NPs and100 µg/mL TiO2 MPs, respectively. The TiO2 particle uptake by M0 macrophages is clear from the images. a(i), b(i) and c(i) are SEM images of the control and activated M0 macrophages treated with 100 µg/mL TiO2 NPs and 100 µg/mL TiO2 MPs, respectively. The presence of titanium particles in contact with the cells was further elucidated from the EDX spectral mapping and clearly showed the presence of titanium for the NP (b(ii)) and MP (c(ii)) groups compared to the control (a(ii)). The red arrows refer to the areas selected for EDX analysis. open_in_new

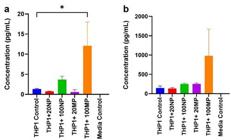
imageFigure 6: IL-1β and IL-8 protein expression by M0 macrophage after being treated for 24 h with 20 and 100 µg/mL TiO2 NPs and MPs using cytometric bead array. The expression of cytokines is represented in terms of picogram /milliliter to non-treated M0 macrophages. Data are represented as mean ± SEM from three separate experiments. * Represents p <0.05. open_in_new

table_chartTable 1
Titanium particle size from the respective test solutions
| Samples | Hydrodynamic Diameter (nm) |
|---|---|
| Test solution I | 448.3 ± 112 |
| Test solution II | 431.2 ± 80.6 |
| Test solution III | 484.5 ± 85.3 |
| Test solution IV | 2783 ± 101.13 |
| Test solution V | 4551.7 ± 114.5 |
Como citar
location_on
Fundação Odontológica de Ribeirão Preto
Av. do Café, S/N, 14040-904 Ribeirão Preto SP Brasil, Tel.: (55 16) 3602-3982, Fax: (55 16) 3633-0999 -
Ribeirão Preto -
SP -
Brazil
E-mail: bdj@forp.usp.br
E-mail: bdj@forp.usp.br
rss_feed
Acompañe los números de esta revista en su lector de RSS
Versão para download de PDF
Artículos relacionados
Lista de links para artigos relacionados. Os links abrem em nova aba.
Versões e tradução automática
Escolha a versão original do texto ou utilize um serviço de tradução automática.
Versão original do texto
Como citar
Escolha um formato para exportar ou selecione um estilo de citação. O conteúdo abaixo pode ser atualizado após a seleção.