Abstract
β-Fructofuranosidase production by Aspergillus oryzae IPT301 was maximized in shake flasks. Response Surface Methodology (RSM) involving Small Central Composite Design was adopted to evaluate the fructosyltransferase (FTase) activity by changing three medium component concentrations: sucrose, urea and yeast extract. The optimal set of conditions for maximum fructosyltransferase production was as follows: sucrose 320.5 g/L, urea 7.13 g/L and yeast extract 2.11 g/L. In this optimal condition, the following improvements were achieved: an increase of 48.8% in cell growth, 112% and 62% in micelial and free FTase activities, respectively, 62.8% in the ratio of fructosyltransferase/hydrolytic activities for enzyme linked to mycelium and 67.5% for free enzyme.
Fructosyltransferase; Fructofuranosidase; Fructooligosaccharides; Aspergillus oryzae; Experimental Design
BIOPROCESS ENGINEERING
Media optimization for β -Fructofuranosidase production by Aspergillus oryzae
C. A. OttoniI; R. Cuervo-FernándezII; R. M. PiccoliI; R. MoreiraI; B. Guilarte-MaresmaII; E. Sabino da SilvaI; M. F. A. RodriguesI; A. E. MaioranoI,* * To whom correspondence should be addressed
ILaboratório de Biotecnologia Industrial, Instituto de Pesquisas Tecnológicas do Estado de São Paulo-IPT, Phone: + (55) (11) 3767-4829, Fax: + (55) (11) 3767-4055, Av. Prof. Almeida Prado 532, CEP: 05508-901, São Paulo - SP, Brazil. E-mail: maiorano@ipt.br
IIInstituto Cubano de Investigaciones Azucareras-ICINAZ, Carretera al Central Manuel M. Prieto, Km 2 ½, Boyeros, Habana, Cuba
ABSTRACT
β-Fructofuranosidase production by Aspergillus oryzae IPT301 was maximized in shake flasks. Response Surface Methodology (RSM) involving Small Central Composite Design was adopted to evaluate the fructosyltransferase (FTase) activity by changing three medium component concentrations: sucrose, urea and yeast extract. The optimal set of conditions for maximum fructosyltransferase production was as follows: sucrose 320.5 g/L, urea 7.13 g/L and yeast extract 2.11 g/L. In this optimal condition, the following improvements were achieved: an increase of 48.8% in cell growth, 112% and 62% in micelial and free FTase activities, respectively, 62.8% in the ratio of fructosyltransferase/hydrolytic activities for enzyme linked to mycelium and 67.5% for free enzyme.
Keywords: Fructosyltransferase; Fructofuranosidase; Fructooligosaccharides; Aspergillus oryzae; Experimental Design.
INTRODUCTION
In recent years, the production of fructooligosaccharides (FOS) has received special attention due to their prebiotics and nutraceutical properties (L'Homme et al., 2003). FOS are not metabolized by most microorganisms in the gastrointestinal tract; however, they are fermented by bifidobacteria, which makes the elimination of harmful microorganisms easier, thus preventing colon cancer. They are not cariogenic and have a low calorific value, allowing diabetics to make use of them (Chen 1998). Moreover, they lower cholesterol levels, phospholipids and triglycerides in the blood, as well as the diastolic blood pressure (Katapodis et al., 2004; Nguyen et al., 2005; Maiorano et al., 2008).
Although FOS can be found naturally in small amounts in several vegetables, they can be produced through enzymatic synthesis from sucrose by β-fructofuranosidases (FFase, EC 3.2.1.26) with fructosyltransferase (FTase) activity. This enzyme produces FOS from sucrose in a disproportionate mode, thereby forming 1-kestose initially, then 1-nystose, followed by 1-fructofuranosyl nystose (Sangeetha et al., 2005). Thus, the search for new potent producers of enzymes showing FTase activity and the study of optimal conditions for transfructosylation are desirable in order to obtain the highest possible yield of good-grade FOS for potential industrial application (Cuervo et al., 2004).
Several papers report the production of FOS using β-fructofuranosidases produced by Aspergillus oryzae (Kurakake et al., 1996; Sangeetha et al., 2002; Sangeetha et al., 2004a; Sangeetha et al., 2004b; Cuervo et al., 2007) with a high FTase activity. The composition of the culture medium is one of the most important factors influencing cell growth and physiology, and hence the formation of products. The medium, which allows the best development of the microorganism, does not always favor the production of the desired enzymes. The optimized production and the variables that affect the enzymatic synthesis should always be investigated, as the optimal conditions vary with different microorganisms, as well as with different enzymes (Box et al., 1978; Bravo et al., 2000).
Optimization studies are carried out using response surface methodology (RSM) which is a mathematical and statistical technique widely used to determine the effects of several variables and their interactions and to optimize different biotechnological processes (Oprime and Suazo, 1997; Burkert et al, 2006; Zafar et al., 2010; Coelho et al., 2011;). RSM has been extensively applied to optimize culture medium and other process parameters for the production of β-fructofuranosidase (Chen 1998), lipase (He and Tan 2006; Liu et al., 2006), tannase (Battestin and Macedo 2007), α-amylase (Rao and Satyanarayana 2007), α-cyclodextrin glucanotransferase (Ibrahim et al., 2005), dextran dextrinase (Naessens et al., 2004) and chitinase (Nawani and Kapadnis 2005). Such techniques can also determine feasible economic procedures on an industrial scale, lowering the operational costs by using the optimized culture medium for the enzyme or by-product synthesis (Chang et al., 2006).
The present study examined β-fructosyltransferase production from synthetic medium by Aspergillus oryzae IPT-301 in shake flask cultures. RSM was used to optimize the culture medium composition to obtain maximum FTase activity. Three factors (sucrose, urea and yeast extract concentrations), considered to have significant impact on biomass and enzyme production, which were selected as responses for optimization studies. This study is the first detailed work on the use of response surface methodology for the optimization of fermentation parameters in β-fructosyltransferase production using Aspergillus oryzae.
MATERIALS AND METHODS
Microorganism and Cultivation Conditions
Aspergillus oryzae IPT-301, a β-fructofuranosidase producer (Cuervo et al., 2007), was from the Instituto de Pesquisas Tecnológicas do Estado de São Paulo (IPT) culture collections. The strain was maintained on malt extract agar slants at 4ºC. For inoculum preparation, the fungi was grown on malt extract agar plates for 7 days; the conidia were suspended in saline solution and diluted to obtain a concentration of 1x10⁷ spores/mL. Experiments were carried out in erlenmeyer flasks with 50 mL of culture medium at pH 5.5. Flasks were inoculated with 0.5 mL of spore suspension and incubated in a rotary shaker at 30ºC and 200 rpm for 72 h.
For the study of the carbon source, the composition of the culture medium was (g/L): NaNO3 5.0; KH2PO4 2.0; MgSO4.7H2O 0.5; MnCl2.4H2O 0.3; FeSO4.7H2O 0.01; carbon source 150 (sucrose, glucose, fructose, maltose or lactose). Afterwards, using the same composition of culture medium with the selected carbon source, different nitrogen sources were evaluated (urea, yeast extract, NaNO3 or (NH4)2SO4). The C/N ratio was 25.5, kept constant. All experiments were run in four replicates.
Samples for analysis were collected and filtered using filter paper (Whatman No 1). In the filtered broth, the residual sugar concentration, pH and extracellular FTase activity were measured. Cell concentration and mycelium FTase activity were determined using the cell pellet.
ANALYTICAL METHODS
Cell mass Concentration
Cell mass concentration was determined by dry cell weight per volume (g/L). The cell mass obtained by filtration of the fermentation broth was washed with distilled water and dried at 105ºC for 4 h.
Fructosyltransferase Activity
The extracellular and mycelium FTase activities were determined as follows: 0.1 mL of suitably diluted supernatant or 0.05 g of cells was mixed with 3.7 mL of 640 g/L sucrose and 1.2 mL of 0.2 M tris-acetate buffer pH 5.5. The reaction was carried out at 50ºC for 60 min and stopped by heating the mixture in boiling water for 10 min (Cuervo et al., 2004). One unit of fructosyltransferase activity was defined as the amount of enzyme that produces a 1 µmol of FOS per minute under the chosen experimental conditions.
Sugar and FOS Concentrations
Sugar and FOS concentrations in the samples were analyzed using high performance liquid chromatography (HPLC), with an Aminex HPX-87C (300 x 7.8 mm, Bio-Rad Laboratories) column, and a system composed by a 510 pump, a differential refractive index detector and a data processor and recorder, all of them from Waters, USA. The samples were eluted with Milli-Q water at a 0.6 mL/min flow rate and the temperature of the column was maintained at 72ºC.
Experimental Design and Statistical Analysis
The experimental design was obtained employing the software Design Expert v.5.0. A Small Central Composite Design was chosen for the study of three factors: sucrose, urea and yeast extract, each at five levels (Table 1). The data factors were chosen after a series of preliminary assays. The basal medium composition was (g/L): KH2PO4 2.0; MgSO4.7H2O 0.5; MnCl2.4H2O 0.3; FeSO4.7H2O 0.01.
The statistical analysis of the data was carried out using Design Expert v.5.0 (Stat-Ease®, Inc., USA). Details of response surface methodology can be found elsewhere (Myers and Montgomery 1995).
The response surface model was fitted to two response variables, Y, namely biomass and mycelium FTase activity in g/L and U/g, respectively. The second order response functions for three factors are given in Equation (1):

where A, B and C represent the levels of the factors sucrose, urea and yeast extract concentration (g/L), respectively. While β0, β1,., β23 represent the estimated coefficients with β0 having the role of the offset term.
RESULTS AND DISCUSSION
The effects of different carbon sources on cellular growth and β-fructofuranosidase production by A. oryzae IPT-301 are shown in Figure 1. Synthesis of the enzyme was strongly influenced by the sugar used as carbon source. Only the sucrose-grown culture possessed high levels of mycelium and extracellular FTase activities, indicating that sucrose is the best inducer for β-fructofuranosidase biosynthesis. Similar results were found for the β-fructofuranosidase produced by Aspergillus japonicus TIT-90076 (Chen and Liu 1996) and A. niger (Park and Almeida 1991). When fructose, maltose and glucose were used, enzyme synthesis was significantly decreased, although good growth was achieved. These results are different from those of A. japonicus MU-2 since good enzyme production was also obtained using glucose as carbon source (Hayashi et al., 1992) but are similar to those reported by Rajoka and Yasmeen (Rajoka and Yasmeen 2005) for β-fructofuranosidase synthesis by wild-type cultures of A. niger on glucose. Low amounts of FTase activities in the presence of glucose, fructose and maltose indicated that the enzyme was produced constitutively as well. On the other hand, Wang and Rakshit (1999) showed that maltose was the best carbon source for enzyme production by A. foetidus NRRL 337, yielding double the enzyme than when sucrose was used. The assimilation of lactose as a carbon source by A. japonicus TIT-90076 was very poor, as reported by Chen and Liu (1996).
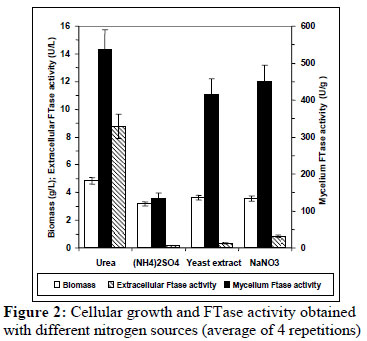
The effect of various nitrogen sources on growth and β-fructofuranosidase synthesis by A. oryzae is shown in Figure 2. The sources evaluated do not show a significant effect on the cellular growth obtained; however, a strong influence on enzyme production was observed. Urea and NaNO3 are the best nitrogen sources for mycelium FTase activity, followed by yeast extract. The highest extracellular FTase activity was achieved with urea. Using (NH4)2SO4, both enzyme activities, mycelium and extracellular, were the lowest. In contrast, Wang and Zhou (2006) showed that urea limited both the growth and mycelium FTase activity produced by Aspergillus sp. JN19 and selected yeast extract as the best nitrogen source. On the other hand, urea also improved significantly yields of invertase production by Saccharomyces cerevisiae over the control (Ikram and Sikander 2007), while Rajoka and Yasmeen (2005) found that sodium nitrate was the poorest source of nitrogen for β-fructofuranosidase synthesis by A. niger.
Experiments showed that sucrose, urea and yeast extract concentrations in the culture medium influenced the biomass production and mycelium FTase activity by Aspergillus oryzae IPT-301. Thus, a central composite design was used to determine the optimum levels of these nutrients, leading to a maximum growth and mycelium FTase activity. The experimental responses are given in Table 1. The level of mycelium FTase activity and biomass in the fourteen different runs varied from 183.38 to 819.52 U/L and from 1.83 to 13.58 g/L, respectively.
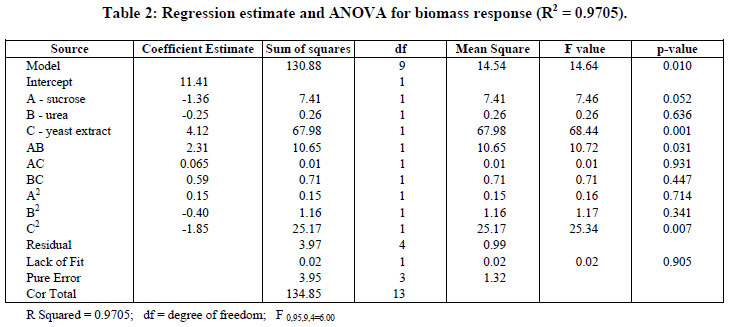
Analysis of variance (ANOVA) and the regression coefficients for growth are presented in Table 2. The analysis gives the value of the models and determines the requirement of a more complex model with a better fit.
The Model F-value of 14.64 for biomass implies that the model was significant at a level of 5% (p < 0.05). Values of p less than 0.05 indicate that model terms are significant. In this case, C, AB, and C2 are significant model terms. As seen in Table 2, the Lack of Fit F-value of 0.02 implies that the Lack of Fit is not significant, relative to the pure error. It can indicate that the experimental data obtained fitted well with the model.
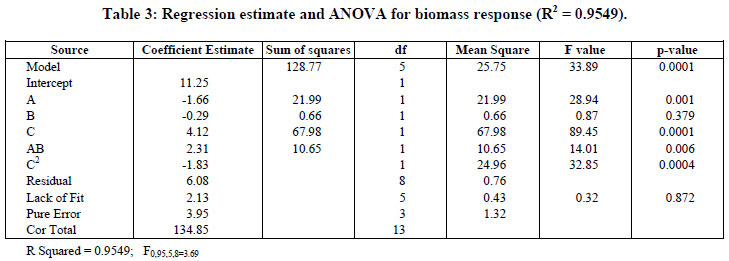
The model with coded variables excluding the statistically non-significant parameters is expressed by Equation (2) and the new analysis of variance shown in Table 3.

On the basis of Table 3, the Model F-value of 33.89 implies the model is quite significant. It was nine times higher than that listed (3.69).
Values of p less than 0.05 indicate that the model terms are significant. In this case A, C, AB, and C2 are significant model terms. Also, a determination coefficient of 0.9549 (R2) was found, indicating that 95.49% of the variability in response can be explained by the model. Based on these results the model can be utilized to generate response surfaces for the analysis of the variable effects on biomass production. The response surfaces in Figure 3 were obtained by using Equation (2).
Analysis of variance and the regression coefficients for mycelium FTase activity are presented in Table 4.
The F-value of 5.03 for mycelium FTase activity implies that the model was not significant at a level of 5 % (p < 0.05). By considering a level of 10% (p < 0.1), the terms A, B2 and C2 are significant model terms. Besides, in Table 3, the Lack of Fit F-value of 2.19 implies that the Lack of Fit is not significant, relative to the pure error.
The model with coded variables excluding the statistically non-significant parameters is expressed by Equation (3):
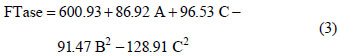
On the basis of the analysis of variance (ANOVA), shown in Table 5, the F-value of 9.19 implies that the model is significant. The Lack of Fit F-value of 1.3 implies that the Lack of Fit is not significant, relative to the pure error.
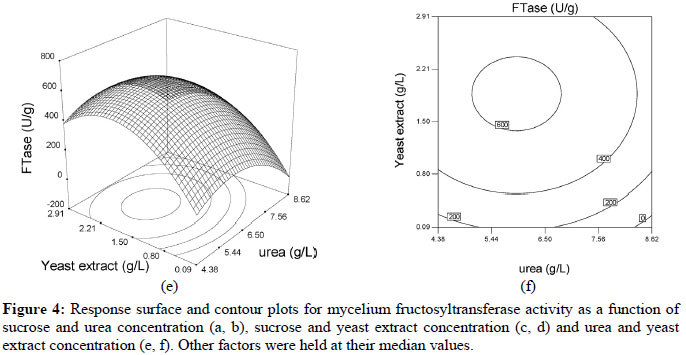
Based on these results, the model can be utilized to generate response surfaces for the analysis of the variable effects on mycelium FTase activity. The response surfaces in Figure 4 were obtained by using Equation (3).
Among the three factors tested, yeast extract concentration had the highest impact on biomass production, reaching a linear coefficient value of 4.13. This factor also showed a significant negative quadratic effect on growth, indicating that biomass production increased as the level of this factor increased and decreased as the level of this parameter increased above certain values. Interaction between sucrose and urea concentrations was also significant, as shown by low p values (p < 0.05) for this interactive term. However, the interactions between sucrose-yeast extract and urea-yeast extract concentrations were found to be insignificant as given by p values above 0.05. Hence these terms were excluded from the polynomial Equation (2) used for this model.
Regression analysis (Equation (2)) of the experimental data showed that sucrose concentration had linear effects on enzyme synthesis (p < 0.05). Among the three factors tested, only sucrose concentration had an impact on mycelium FTase activity as given by the linear coefficient (85.92). Urea and yeast extract concentrations also showed significant negative quadratic effects on enzyme production. All interactions between the factors were found to be insignificant, as given by p values above 0.05 (p < 0.05) for interactive terms. Hence, these terms were excluded from the polynomial Equation (3) used for this model.
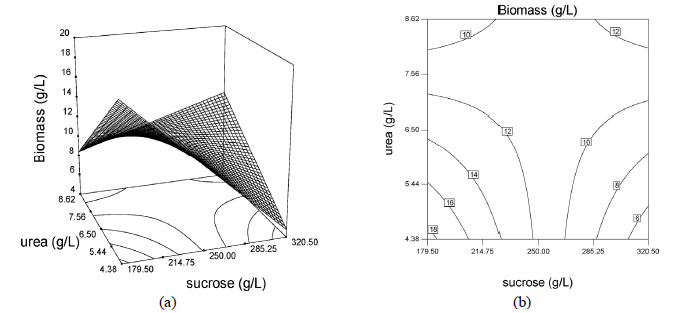
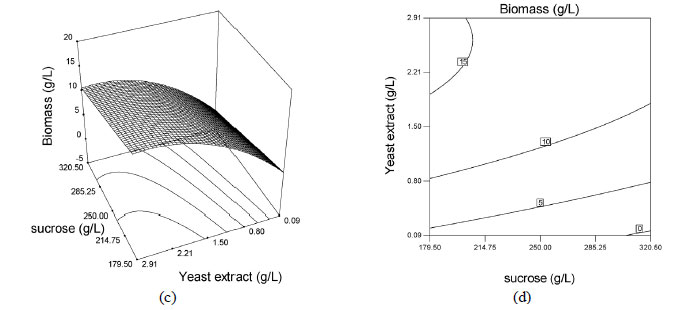
The effects of sucrose, urea and yeast extract concentrations were illustrated via surface and contour plots for biomass production as a function of two factors with the other factor kept at the median level, as shown in Figures 3 and 4. Response surface plots provided a method for predicting the response to different test variable values, and plot contours helped identify the types of interactions between the test variables. These plots are graphic representations of the regression equations. A rather flat response surface indicates that the responses can tolerate variation in the culture medium composition without the responses being seriously affected, whereas a very pointed surface indicates that responses would be sensitive to the culture medium composition used (Montgomery 1997). If the contour lines are parallel with either of the axes, no interaction exists between these two variables. Elliptic contours indicate that there are striking interactions between the variables.
The effects of the factors on biomass production are shown as surface and contour plots in Figure 3. Analysis of the response surfaces for biomass production suggested that the optimal conditions did not lie inside the tested range of the variables. Contour plots, Figures 3b, 3d and 3f, show the effects of the three factors on the biomass production. When sucrose and urea concentrations were low, the biomass production remained above 15 g/L and when sucrose and urea concentrations were high, the biomass production remained above 12.0 g/L (Figure 3b). This also indicated that there were interactions between the variables sucrose and urea concentrations. When sucrose concentration was low and yeast extract concentration was high, the biomass production remained around 15 g/L (Figure 3d). According to Figure 3f, no interactive effect exists between urea and yeast extract concentration.
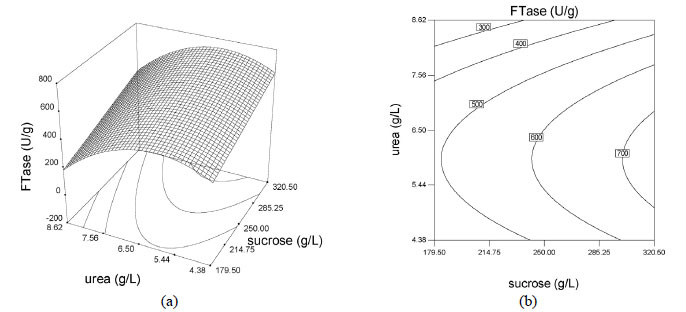
The effects of factors on enzyme activity are shown in the surface and contour plots in Figure 4. The pointed form of the response surface of mycelium FTase activity, Figure 4e, suggested that the optimal conditions lay inside the tested range of the variables urea and yeast extract concentrations. The optimal sucrose concentration lay outside the tested range, as show in Figures 4a and 4c. Contour plots, Figures 4b, 4d and 4f, show the effects of the three factors on the mycelium FTase activity. When the sucrose concentration was high, and urea and yeast extract concentrations were around 5.4-6.5 g/L and 1.5-2.2 g/L, respectively, the activity was above 700 U/L (Figures 4b). Figure 4f shows the effects of urea and yeast extract concentrations on the activity. The maximum mycelium FTase activity of the enzyme was obtained when the concentration of urea was between 5-6.5 g/L and yeast extract was around 2.0 g/L, giving values of about 600 U/L at 250 g/L sucrose concentration. As shown in Figure 4f, since the contour plots are circular, it can be inferred that the interaction between the variables urea and yeast extract concentrations is negligible. In order to calculate the optimal levels of sucrose, urea and yeast extract concentrations corresponding to the maximum mycelium FTase activity, the second order polynomial model represented by Equation (3) was used.
In order to determine the maximum biomass production and mycelium FTase activity simultaneously, a Design Expert subroutine for numerical optimization was used based on the experimental design. The goal was to maximize Biomass (importance 2) and FTase (importance 4) at the same time by finding sucrose, urea and yeast extract values in known ranges. The optimal conditions were (g/L): sucrose 320.5, urea 6.7 and yeast extract 2.1, for which the maximum values of biomass and mycelium FTase activity of 11.0 g/L and 726.2 U/g were obtained, respectively.
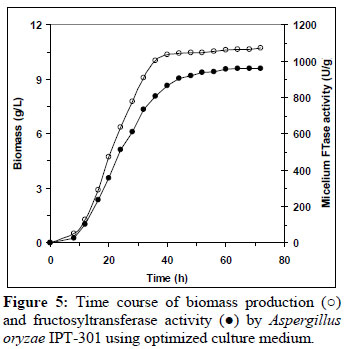
In order to validate the mathematic model, fermentations of A. oryzae IPT-301 were carried out with the optimized medium consisting of (g/L): sucrose 320.5; urea 6.7; yeast extract 2.1; KH2PO4 2.0; MgSO4.7H2O 0.5; MnCl2.4H2O 0.3; FeSO4.7H2O 0.01. Figure 5 shows the average results of the fermentation carried out in four replicates. The biomass under optimized conditions was 10.46 g/L close to the predicted maximum biomass (11.0 g/L), and 2.16 times higher than the one obtained under initial conditions (4.85 g/L).
On the other hand, the mycelium activity remained low at the beginning of the cultivation and then increased during the exponential growth phase, reaching a maximum at the early stationary phase and being maintained throughout the stationary growth phase. From the mycelium FTase activity curve, it was observed that the enzyme production was associated with the biomass production. Maximum mycelium FTase activity (950 U/g) was obtained at 60 h. This value was higher than the values given by the model. A significant improvement of mycelium fructosyltransferase activity was achieved with the optimization of the culture medium. The optimization of the medium resulted in an enzymatic activity 1.77 times higher than in an un-optimized medium.
Similar activity profile curves have been reported in the literature using other strains (Sangeetha et al., 2002; Hayashi et al., 1992; Chen, 1995) studied for the production of β-fructofuranosidase with mycelium FTase activity in shake flask cultures, with enzyme production apparently being growth associated.
In conclusion, it is evident that the application of quadratic response surface methodology can be a practical and useful tool for optimisation of culture media for the enhancement of the production of β-fructofuranosidase with mycelium FTase activity.
ACKNOWLEDGEMENTS
The authors gratefully acknowledge the State of São Paulo Research Foundation (FAPESP) for providing financial support.
(Submitted: March 12, 2010; Revised: September 27, 2011; Accepted: October 24, 2011)
- Battestin V., Macedo G. A., Tannase production by Paecilomyces variotii Bioresource Technology, 98,1832-37(2007).
- Box, G. E., Hunter, W. G., Hunter, J. S., Statistics for experiments: An introduction to designs, data analysis and model building. John Wiley, New York (1978).
- Bravo, C. E, C., Carvalho, E. P., Schwan, R. F., Gómez, R. J. H. C., Pilon, L., Determinação de condições ideais para a produção de poligalacturonase por Kluyveromyces marxianus Revista Ciência e Agrotecnologia, 24,137-52(2000).
- Burkert, J. F. M., Kalil, S. J., Maugeri Filho, F., Rodrigues, M. I., Parameters optimization for enzymatic assays using experimental design. Braz. J. Chem. Eng., .23,(2),163-170(2006).
- Chang, C. Y., Lee, C. L., Pan, T. M., Statistical optimization of medium components for the production of Antrodia cinnamomea AC0623 in submerged cultures. Appl. Microbiol. Biotechnol., 72,654-61(2006).
- Chen, W. C., Production of β - fructofuranosidase by Aspergillus japonicus in batch and fed-batch cultures. Biotechnol. Lett., 17,1221-24(1995).
- Chen, W. C., Medium improvement for β - frutofuranosidase production by A. japonicus. Process Biochemistry, 33,267-71(1998).
- Chen, W. C., Liu, C. H., Production of β - fructofuranosidase by Aspergillus japonicus Enzyme and Microb. Technol., 18,153-60(1996).
- Coelho, L. F., de Lima, C. J. B., Rodovalho, C. M., Bernardo, M. P., Contiero, J., Lactic acid production by new Lactobacillus plantarum LMISM6 grown in molasses: optimization of medium composition. Braz. J. Chem. Eng., 28,(1),27-36(2011).
- Cuervo, R., Guilarte, B., Juárez, A., Martínez, J., Production of fructooligosaccharides by β-fructofuranosidase from Aspergillus sp 27H. J. Chem. Technol. Biotechnol., 79,268-72(2004).
- Cuervo, R., Ottoni, C. A., Silva, E. S., Matsubara, R. M. M., Carter, J. M., Magossi L. R., Wada, M. A. A., Rodrigues, M. F. A., Guilarte, B., Maiorano, A. E., Screening of β-fructofuranosidase-producing microorganisms and effect of pH and temperature on enzymatic rate. Appl. Microbiol. Biotechnol., 75,87-93(2007).
- Hayashi, S., Matsuzaki, K., Takasaki, Y., Ueno, H., Imada, K., Production of β - fructofuranosidase by Aspergillus japonicus World J. Microbiol. Biotechnol., 8,155-159(1992).
- He, Y. Q., Tan, T. W., Use of response surface methodology to optimize culture medium for production of lipase with Candida sp. 99-125. J. Molecular Catalysis, B: Enzymatic, 43,9-14(2006).
- Ibrahim, H. M., Yusoff, W. M. W., Hamid, A. A., Illias, R. M., Hassan, O., Omar, O., Optimization of medium for the production of β-cyclodextrin glucanotransferase using central composite design (CCD). Process Biochem., 40,753-58(2005).
- Ikram-Ul-Haq, Sikander A., Kinetics of invertase production by Saccharomyces cerevisiae in batch culture. Pak. J. Bot., 39,907-12(2007).
- Katapodis, P., Kalogeris, E., Kekos, D., Macris, B. J., Christakopoulos, P., Biosynthesis of fructooligosaccharides by Sporotrichum thermophile during submerged batch cultivation in high sucrose media. Appl. Microbial Biotechnol., 63,378-82(2004).
- Kurakake, M., Onoue, T., Komaki, T., Effect of pH on transfructosylation and hydrolysis by β-fructofuranosidase from Aspergillus oryzae Appl. Microbiol. Biotechnol., 45,236-39(1996).
- L'Homme, C., Arbelot, M., Puigserver, A., Biagini, A., Kinetics of hydrolysis of fructooligosaccharides in mineral buffered aqueous solutions: Influence of pH and temperature. J. Agric. Food Chem., 51,224-28(2003).
- Liu, C., Lu, W. B., Chang, J. S., Optimizing lipase of Burkholderia sp. by response surface methodology. Process Biochem., 41,1940-44(2006).
- Maiorano, A. E., Piccoli, R. M., Silva, E. S., Rodrigues, M. F. A., Microbial production of fructosyltransferases for synthesis of prebiotics. Biotechnol. Lett., 30,1967-77(2008).
- Montgomery, D. C., Design and analysis of experiments. John Wiley, New York (1997).
- Myers, R. H., Montgomery, D. C., Response surface methodology: Process and product optimization using designed experiments. John Wiley New York (1995).
- Naessens, M., Vercauteren, R., Vandamme, E. J., Three-factor response surface optimization of the production of intracellular dextran dextrinase by Gluconobacter oxydans Process Biochem., 39,1299-04(2004).
- Nawani, N. N., Kapadnis B. P., Optimization of chitinase production using statistics based experimental designs. Process Biochem., 40,651-60(2005).
- Nguyen, Q. D., Rezessy-Szabó, J. M., Bhat, M. K., Hoschke, A., Purification and some properties of ß-frutofuranosidase from Aspergillus niger IMI 303386. Process Biochem., 40, 2461-66 (2005).
- Park, Y. K., Almeida, M. M., Production of fructooligosaccharides from sucrose by a transfructosylase from Aspergillus niger World J. Microbiol. Biotechnol., 7,331-34(1991).
- Oprime, M. E. A. G., Suazo, C. A. T., Quantification of the effect of some operational variables on the cell growth yield (Yx/s) of Penicillium chrysogenum by surface response analysis. Braz. J. Chem. Eng., 14,(4),417-423(1997).
- Rajoka, M. I., Yasmeen, A., Improved productivity of β-fructofuranosidase by a derepressed mutant of Aspergillus niger from conventional and non-conventional substrates. Word J. Microbiol. Biotechnol., 21,471-78(2005).
- Rao, U. M. J. L., Satyanarayana, T., Improving production of hyperthermostable and high maltose-forming α-amylase by an extreme thermophile Geobacillus thermoleovorans using response surface methodology and its applications. Bioresource Technol., 98,345-52(2007).
- Sangeetha, P. T., Ramesh, M. N., Prapulla, S. G., Influence of media components and reaction parameters on the production of fructosyl transferase and fructooligosaccharides. Sciences des Aliments 22,277-87(2002).
- Sangeetha, P. T., Ramesh, M. N., Prapulla, S. G., Production of fructo-oligosaccharides by fructosyl transferase from A. oryzae CFF 202 and A. pullulans CFR 77. Process Biochem., 39,753-58(2004a).
- Sangeetha, P. T., Ramesh, M. N., Prapulla, S. G., Production of fructosyl transferase by Aspergillus oryzae CFR 202 in solid-state fermentation using agricultural by-products. Appl. Microbiol. Biotechnol., 65,530-37(2004b).
- Sangeetha, P. T., Ramesh, M. N., Prapulla, S. G., Recent trends in the microbial production, analysis and application of fructooligosaccharides. Trends Food Sc. Technol., 16,442-57(2005).
- Wang, L. M., Zhou, H. M., Isolation and identification of a novel Aspergillus japonicus JN19 producing β-fructofuranosidase and characterization of the enzyme. J. Food Biochem., 30,641-58(2006).
- Wang, X. D., Rakshit, S. K., Improved extracellular transferase enzyme production by Aspergillus foetidus for synthesis of isooligosaccharides. Bioproc. Eng., 20,429-34(1999).
- Zafar, M., Kumar Shashi and Kumar Surendra, Optimization of napthalene biodegradation by a genetic algorithm based response surface methodology. Braz. J. Chem. Eng., 27,(1),89-99(2010).
Publication Dates
-
Publication in this collection
08 Mar 2012 -
Date of issue
Mar 2012
History
-
Received
12 Mar 2010 -
Accepted
24 Oct 2011 -
Reviewed
27 Sept 2011