 May spices be detected as starch in meat products? Starch quantification in meat products
Abstract
This study aimed to investigate the presence of starch in commercial meat products, compare the accuracy of Lane-Eynon and Anthrone quantitative methods and evaluate the interference of spices in starch detection. Ten commercial products (fresh cured pork sausage, cooked cured Calabresa-type sausage, and salami) were initially screened using the qualitative Lugol’s test. Three samples that tested positive for starch were further analyzed using both Lane-Eynon and Anthrone quantitative methods. To compare the performance of the quantitative methods, fresh sausages were prepared in model-system with known starch concentration (0; 0.25; 0.5; 0.75, and 1.0%). The Anthrone method demonstrated superior accuracy, with a mean recovery rate of 97.4%, compared to only 23.0% for the Lane-Eynon method. Subsequently, the impact of spices was evaluated in formulations containing specific starches and spices. While starch-added samples were correctly identified, starch-free samples containing spices (white pepper, black pepper, and nutmeg) yielded false-positive results in the Lugol’s test. The Anthrone method proved effective in quantifying these low levels of background starch with high precision. Based on these findings, the Anthrone method is recommended for precise quantification, particularly in cases of suspected adulteration where qualitative tests may yield false positives due to spice interference.
Keywords:
Polysaccharide; Food fraud; Additives; Sausages; Lugol; Anthrone
HIGHLIGHTS
Anthrone method showed superior accuracy (97.4% recovery) compared to Lane-Eynon
Spices caused false-positive results in the qualitative Lugol’s test
Anthrone method effectively quantifies low starch concentrations in meat products
1 Introduction
Starch is the most important and abundant polysaccharide found in some foods, being abundant in cereals, vegetables, tubers and immature or green fruits (Lajolo & Menezes, 2006). Its unique structure, organized into semi-crystalline granules composed by the linear amylose and the highly branched amylopectin, is responsible for its key functional and versatile property: gelatinization (Damodaran et al., 2010; Denardin & Silva, 2009). From the meat products industry perspective, starch is a low-cost ingredient that plays an important role in increasing water-holding capacity (WHC) in foods (Damodaran et al., 2010). According to Pedroso & Demiate (2008), starches can form viscous solutions or gels, making them useful as thickeners and stabilizers in food products. These properties are directly influenced by the sources used for their extraction. Different sources yield starches with distinct ratios of amylose and amylopectin chains, their length and packing degree, granule size and geometry, as well as interactions with other molecules (Damodaran et al., 2010). As shown in Table 1, each starch source presents different amylose percentages, aspects that are essential for their selection and usage in formulations.
Processed meat products are characterized by modifications of fresh meat properties through mechanical and sensory techniques such as grinding, seasoning addition, and heat application (Dutra & Silva, 2013). These products stand out for their easy standardization through control and addition of additives or processing aids that meet legal product specifications (Silva, 2023). In meat products, cassava starch is the most used starch in Brazil due to its availability, high water absorption capacity, providing higher juiciness, yield, and tenderness to products (Labanca et al., 1999; Pospiech et al., 2014). Additionally, its gelatinization point is reached during the cooking processes of meat products (Damodaran et al., 2010).
Normative Instruction No. 4 from Ministério da Agricultura e Pecuária (MAPA) (Brasil, 2000) establishes a maximum of 5% added starch for bologna-type sausages, except for Bologna and Italian mortadella, where starch addition is not permitted. A maximum of 2% starch can be added to frankfurters. For fresh and cooked sausages, hamburgers, and salami, starch addition is not allowed. As an inspection method, the agency employs the qualitative Lugol’s test, with a limit of detection (LD) reported in the range of 0.1 g/100 g (Coelho et al., 2019). This qualitative test is a reliable method for detecting starch in various food products, based in the reaction of the iodine with starch polymeric chains (Ali et al., 2025; Whistler et al., 2012; Young et al., 2012). According to the legislation, positive results for starch presence can lead to penalties for the company (Brasil, 2000).
However, the Lugol test’s isolated application cannot differentiate between intentionally added starch and starch naturally present in other ingredients applied in the products. For instance, peppers contain considerable starch levels (around 30-50%) and are a notable source of potential interference (Zhu et al., 2018). Due to their inherent polysaccharide content, spices may cause a positive result, thereby compromising the detection accuracy and leading to potential false positives (Velázquez et al., 2023; Wyatt, 1992).
The quantitative methods are fundamentally based on quantifying the glucose released after the hydrolysis of starch polymer chains. The Lane-Eynon method allies the Fehling’s reaction with quantification by titrimetry. As a classic method, its main advantage is that it requires no need for sophisticated instrumentation. However, as a volumetric methodology, it is prone to significant limitations, such as difficulty in visualizing the titration endpoint due to the formation of abnormal colorations and potential overestimation from the generation of other reducing compounds during analysis (Labanca et al., 1999).
Spectrophotometric analysis is observed to be more accurate and precise. The Anthrone method presents a high sensitivity, with a limit of quantification (LQ) reported in the range of 0.04 g/L and 1.25 g/100g. Officially recommended by MAPA (Brasil, 2024), this method quantifies the chromophores formed from the condensation of the reagent with the derivative products of glucose dehydration in a strong acidic medium (Haldar et al., 2017; Labanca et al., 1999).
Therefore, a combination of qualitative and quantitative methodologies emerges as a potential pathway to aid in accurate results interpretation. A positive result in the Lugol’s test only indicates presence, not origin or functionality. While regulations may target starch added above a certain threshold to confer illicit technological properties, concentrations below a functional limit – often derived naturally from spices – may be technologically irrelevant. Studies on starch functionality in meat emulsions show that a minimum range of 2.0 to 4.0% is typically required to significantly improve water binding and texture, a percentage far exceeding the natural levels contributed by spices (Pietrasik & Janz, 2010). Relying only on the qualitative results risks penalizing manufacturers for false positives caused by these inherent ingredients. Thus, quantifying the starch content is a critical step to distinguish between natural or intentional presence.
This study aimed to investigate the qualitative Lugol’s test to verify the presence of starch in commercial meat products, in sequence compare two quantitative methods (Lane-Eynon and Anthrone) to quantify this ingredient and evaluate the impact of spices addition in fresh pork sausages starch detection using the qualitative Lugol’s and quantitative Anthrone starch methods.
2 Materials and methods
2.1 Sample preparation
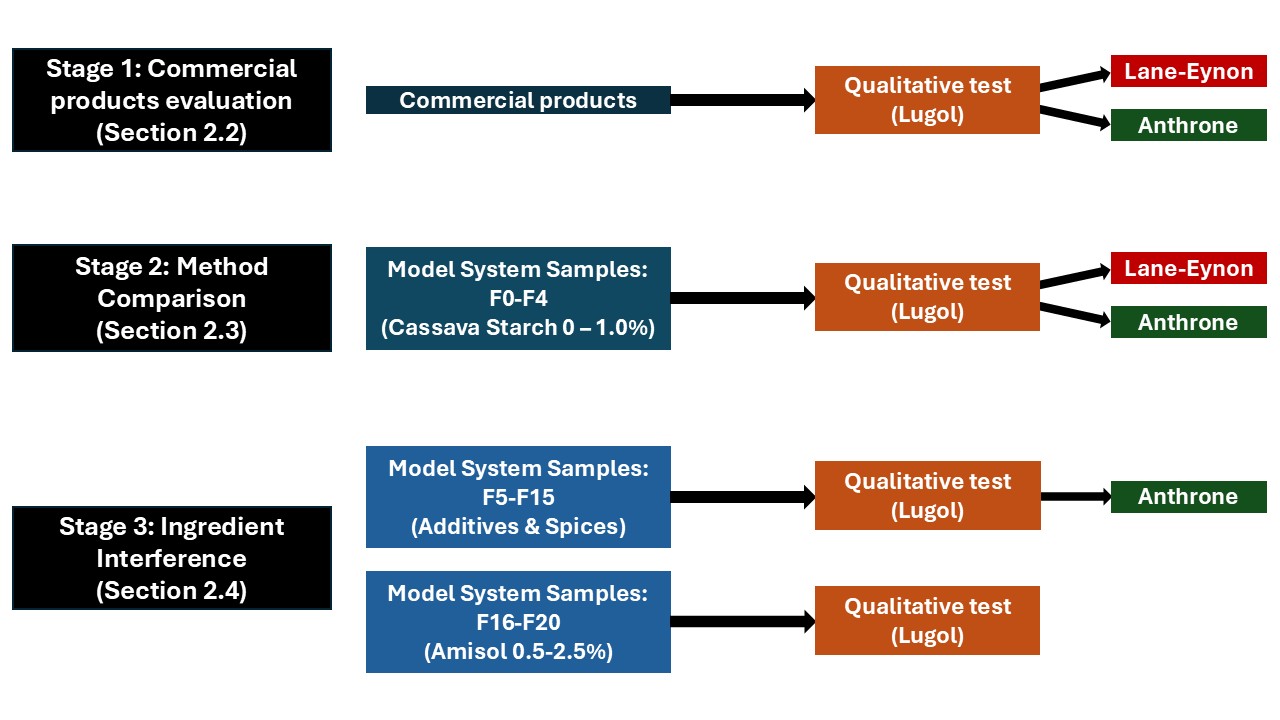
For all analyses, sample preparation followed the guidelines established by MAPA (Brasil, 2024). The casing was removed and discarded, and samples were processed in a Robot Coupe® Blixer® 3 (Robot Coupe) food processor until obtaining a smooth, homogeneous paste. The container sides were scraped with a spatula to reincorporate material into the main portion (approximately 250g). Samples were then frozen, later thawed in a refrigerator, and subsequently analyzed. Figure 1 shows a schematic overview of the analyses carried out for each sample.
2.2 Commercial product evaluation
Ten commercial samples (2 salamis, 6 fresh-cured, and 2 cooked sausages) were analyzed, obtained from markets and butcher shops in Campinas (SP). Starch presence was detected through qualitative Lugol’s test. Three positive samples were subjected to quantitative analysis using Lane-Eynon (Fehling) and Anthrone methods.
2.3 Preparation of model-system fresh sausages for method comparison and accuracy assessment
Five model-system fresh sausage formulations were prepared with different cassava starch concentrations (Pinduca brand). A base formulation contained 94.0%-95.0% pork leg with fat, 3.0% ice water, 1.5% iodized salt, 0.5% curing salt, and 0, 0.25, 0.50, 0.75, and 1.00% cassava starch (designated F0 to F4, respectively). Samples were evaluated by Lugol’s test and quantitative Lane-Eynon (Fehling) and Anthrone methods to determine starch recovery rates.
2.4 Preparation of model-system fresh sausages with specific ingredients for interference evaluation
Initial screening was performed by applying the qualitative Lugol’s test to 1% solutions of various spices, commercial modified or native starches, and other carbohydrates (such as maltodextrin and glucose syrup). Fifteen of these ingredients, classified as “suspect” or “positive”, were subsequently incorporated into new fresh sausage formulations in model-system (designated F5 to F20), as presented in table 2. Samples were evaluated by Lugol’s test and the quantitative Anthrone method.
2.5 Analytical methods
2.5.1 Qualitative starch evaluation (Lugol’s test)
For starch detection, 5-6 g samples were weighed into beakers and mixed with 30 mL of distilled water. The mixture was heated to boiling on a hot plate for 5 minutes with constant stirring. After cooling, the solution was filtered into an Erlenmeyer flask. A 15 mL aliquot of the filtrate was transferred to test tubes, and two drops of Lugol’s solution were added, followed by homogenization for color evaluation (Brasil, 2024). A control tube (“C”) containing 15 mL of distilled water was prepared in parallel for color comparison.
2.5.2 Quantitative Lane-Eynon (Fehling) method
Starch content by the Lane-Eynon methodology was determined in triplicate for each sample, adapted from Brasil (1999) and Association of Official Analytical Chemists (2005). A 20 g aliquot of thawed homogenized sample was sequentially defatted and dehydrated with acetone and absolute ethanol via 10-minute centrifugation at 2000 rpm. The residue was subjected to alkaline hydrolysis using 4% KOH in ethanol under reflux for 30 min. After filtration and washing to neutrality, the residue was acid-hydrolyzed with 1.5 NHCl in a boiling water bath for 2 h. The hydrolysate was neutralized to pH ≤ 7.00 with 40% NaOH, clarified using 15% potassium ferrocyanide and 30% zinc acetate, and diluted to 250 mL. The reducing sugars in the clear filtrate were quantified by titration against a boiling mixture of Fehling’s solutions A (aqueous solution of CuSO4) and B (sodium potassium tartrate in sodium hydroxide solution), using methylene blue as an indicator. The endpoint was determined by the persistent decolorization of the indicator.
2.5.3 Quantitative Anthrone method
The analyses were carried out according to the method described by Brasil (2024). A standard curve was constructed using glucose standard solutions (25-200 μg glucose/2 mL), prepared by serial dilution from a 0.01% (w/v) stock solution. Following the addition of 10 mL of Anthrone reagent to each standard, the tubes were vortexed, heated in a boiling water bath for 10 min, cooled, and vortexed again. Absorbance was measured at 620 nm against a reagent blank using a Shimadzu UV-1800 spectrophotometer.
About 0.5g of the sample was defatted with ethyl ether P.A and dehydrated with 80% (v/v) ethanol through a series of three 5-minute centrifugations at 1500 rpm and washing steps for each solvent. The resulting residue was dried at 80ºC for 1 hour. The hydrolysis was conducted by adding 10 mL of 0.25 mol.L-1 H2SO4 to the residue and incubating in a water bath (≥ 90 ºC) for 1 hour. The hydrolysate was then diluted to 250 mL with distilled water. A 2 mL aliquot of the supernatant was reacted with 10 mL Anthrone reagent, followed by heating in a boiling water bath for 10 min. Absorbance measurements were performed at 620 nm using the Shimadzu UV-1800 spectrophotometer, with calibration against a reagent blank. This analysis was performed in triplicate for each sample.
3 Statistical analysis
All quantitative analyses were performed in triplicate for each sample. The results were presented as mean ± standard deviation of mean (SD). The data were statistically evaluated using Analysis of Variance (ANOVA). When significant, Tukey's test was applied for mean comparison at 5% significance level using Sisvar® software (UFLA, Brasil).
4 Results and discussion
4.1 Commercial product evaluation
Among the ten commercial samples analyzed, five were identified as suspect or positive for starch presence using the Lugol's test, including: fresh-cured Calabresa-type sausage, pepper-added pork fresh-cured sausage, spicy fresh-cured toscana sausage, cooked cured Cuiabana-type beef sausage, and spiced fresh beef sausage. These products exhibited grayish, greenish, or dark blue coloration. Notably, starch addition is prohibited in these products (Brasil, 2000). Examining the ingredient lists of these products reveals that seasonings and spices, including Calabresa-type pepper and red pepper, were incorporated into the formulations, which is a potential source of the suspect or positive results observed for the samples.
Among the five selected commercial samples, three considered positive in the Lugol's test were submitted for starch quantification using the Lane-Eynon and Anthrone methods. These included fresh-cured Calabresa-type sausage, pepper-added fresh-cured pork sausage, and fresh-cured spicy toscana sausage, showing starch concentrations of 0.280 ± 0.009%, 0.237 ± 0.007%, and 0.184 ± 0.011% by the Lane-Eynon method, and 0.791 ± 0.044%, 0.554 ± 0.035%, and 0.839 ± 0.014% by the Anthrone method, respectively.
The discrepancy observed between the two methods aligns with the validation data presented in section 4.2. As detailed in the subsequent section, the Lane-Eynon method demonstrated low recovery rates for starch concentrations below 1%, likely due to the non-stoichiometric reduction of copper at trace levels compared to the highly sensitive colorimetric reaction of Anthrone.
The presence of spices may lead to false positives in the starch test using Lugol's solution due to the complex chemical composition of these ingredients, which may contain other polysaccharides or interfere with the assay. This may result in false positive results when evaluating starch presence (Peter, 2001; Raghavan, 2007; Velázquez et al., 2023). Both starch fractions, amylose and amylopectin, react distinctly with iodine: amylose, with predominantly linear chains, forms a characteristic intense blue complex in the presence of iodine, while amylopectin, with branched chains, tends to produce a more reddish or purple coloration (Bahdanovich et al., 2022; McCready & Hassid, 1943; Pospiech et al., 2014; Eliášová et al., 2012). The presence of these compounds reinforces the importance of understanding their structure and behavior during analyses, as the reaction with iodine may be influenced by the sample's specific composition (Velázquez et al., 2023).
It has been shown that spices such as rosemary and turmeric inhibit the formation of dangerous compounds in meat, potentially affecting starch detection by altering the matrix in which the starch is present (Wang et al., 2023; Giuberti et al., 2020). In the case of Lugol’s test for starch, spices in meat products may contribute to positive results, making accurate assessment of starch presence difficult (Wyatt, 1992).
Comparison between our results and other data provides important context. Labanca et al. (1999), analyzing chicken-based meat products in Belo Horizonte (MG, Brazil) between 1996 and 1997, reported average starch contents of 1.73 g/100 g in 60% of fresh sausages. While Labanca´s study identified high levels of starch indicative of intentional adulteration, the lower concentrations found in our study suggest that positive results in current commercial products may often stem from the cumulative effect of starchy spices rather than adulteration. However, accurate quantification remains crucial to distinguish between these scenarios.
4.2 Comparative accuracy and recovery of Lane-Eynon and Anthrone methods in model systems
Recovery rate is a measure of the accuracy of an analytical method. It is calculated by comparing the amount of analyte measured in a model sample to the known amount that was added. In this study’s quantitative assessment of starch content in model-system fresh sausages (F0-F4), the Lane-Eynon and Anthrone methods demonstrated mean recovery rates of 23.0 ± 15.9% and 97.4 ± 2.7%, respectively, as shown in Table 3.
These results establish the superior precision of the Anthrone method for starch determination in the analyzed matrix. The limitations of the Lane-Eynon titrimetric approach become particularly evident at low starch concentrations (<1%), where endpoint determination during redox titration becomes increasingly subjective. This methodological constraint significantly impacts both precision and accuracy. Consequently, the spectrophotometric Anthrone method emerges as the method of choice for quantitative starch analysis in meat products, especially when analyzing samples with starch concentrations below 1%.
Comparative studies by Aued et al. (1990) on sausage formulations containing 0-10% cassava starch revealed significant methodological differences. While both titrimetric (Fehling) and spectrophotometric (Somogyi-Nelson) methods showed comparable results at higher starch concentrations (3-10%), the Fehling method proved inadequate for concentrations below 1%. In contrast, the spectrophotometric approach maintained excellent reproducibility and reliability across the entire concentration range, particularly for low-concentration samples. Similar results were reported by Labanca et al. (1999) with recovery rates above 89% via the spectrophotometric method.
Method validation studies conducted by Silva (2023) on processed meat products (mortadella: 6.75% carbohydrates; breaded chicken steak: 19.0% carbohydrates) provided further evidence of method performance. Five analysts performed triplicate tests on samples A and B on different dates using both the Lane-Eynon (titrimetric) and Anthrone (spectrometric) methods. The spectrophotometric method showed a mean recovery percentage of 99.62 ± 0.35% with lower deviation and greater proximity to both the analytical standard and samples A and B. The titrimetric method showed lower efficacy in the results, though with values very close to the actual ones.
4.3 Evaluation of ingredient interference on qualitative and quantitative starch analysis
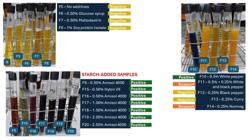
Fifteen model-system fresh sausage formulations containing different starch types and spices were evaluated through qualitative (Lugol's test) and quantitative (Anthrone method) analyses. As expected, all starch-added samples tested positive, exhibiting the characteristic blue-green coloration of the iodine-amylose complex. Notably, the waxy corn starch (Amisol 4000) produced a distinct brown-reddish coloration in the Lugol's test, attributable to its high amylopectin content (~99%). The qualitative Lugol's test results for the model-system sausage samples are presented in Figure 2.
The colorimetric distinction observed in the Lugol’s test is governed by the specific physico-chemical interactions between iodine and the starch fractions. The intense blue-green, typically regarded as the standard ‘positive’ result by regulatory bodies, arises from the charge transfer between iodide anions and the linear amylose helix, forming extended poly-triiodide chains that absorb wavelengths around 600 nm (Pesek & Silaghi-Dumitrescu, 2024; Pesek et al., 2022; Zhu et al., 2008).
However, our results indicated that samples containing certain spices and modified starches exhibited a brown-reddish coloration (F9 and F15 to F20). This is explained by the branched structure of amylopectin, which creates a helical configuration with distinct binding stability (Moulay, 2013). These branched chains are too short to accommodate long poly-triiodide chains, shifting the absorption maximum to approximately 540 nm (Nwokocha & Ogunmola, 2014; Zhu et al., 2008). Understanding this mechanism is crucial, as it validates that the reddish hues observed in formulations containing high-amylopectin ingredients are indeed positive indicators of starch presence, despite deviating from the classic blue reaction.
Regarding the spice interference, previous studies have established that spices like black and white peppers contain significant starch levels. Zhu et al. (2018) evaluated starch content in these spices, obtaining values of 36.2% and 52.4%, respectively. In our study, the presence of starch via spice incorporation was confirmed in Lugol’s test for formulations containing white and black pepper (F10 and F11) and nutmeg (F14).
Distinct behaviors were observed when comparing the analytical response in solution versus within the meat matrix. For instance, ingredients such as black pepper and curry, which tested positive in direct solution, yielded negative results when incorporated into the model system. This suppression was also observed for maltodextrin and soy protein isolate. One possible explanation for this phenomenon involves the potential complexation of starch with lipids. Lipids can affect starch pastes due to their ability to form complexes with starch chains (Damodaran et al., 2010).
Based on the previously obtained results in the second step of this study for starch-added samples, which confirmed the accuracy and precision of the Anthrone quantitative method, we opted to perform only qualitative evaluation for formulations 16, 17, 18, 19, and 20. This analysis demonstrated the characteristic brownish-red coloration of starch with high amylopectin content, consistent with findings by Nwokocha & Ogunmola (2014). The remaining formulations (F5 to F15) were subsequently analyzed using the quantitative Anthrone method.
The results of starch quantification (Anthrone method) in the prepared fresh sausage samples (model system) are presented in Table 4.
As shown in Table 4, the starch content results demonstrated good accuracy for the Anthrone method in formulations with direct starch addition. The method also quantified starch percentages in spice-containing formulations, suggesting the natural presence of starch in these ingredients. Some elevated coefficients of variation (CV > 5%) observed for some samples are likely a consequence of the low starch concentrations originating from the spices. At these trace levels, the analysis operates near the method’s limits of quantification (LOQ) and detection (LOD), where the signal-to-noise ratio is low. This makes the results highly sensitive to minor inherent variations in the analytical procedure, which may lead to a pronounced impact on precision and elevated relative standard deviation (Skoog et al., 2015).
Spices contain varying levels of starch in their composition. Since meat product formulation involves combining multiple ingredients, including these spices and seasonings, their final proportion may influence the product's starch content without direct starch addition. Furthermore, the multiple potential sources of this carbohydrate must be considered - notably including its presence as "starch films" used to enhance antimicrobial properties in spices (Rodrigues et al., 2020). Therefore, understanding product formulation is essential to optimize processing and ensure compliance with food regulations through proper analyses (Zhu et al., 2018; Pedroso & Demiate, 2008; McCleary et al., 1997).
When arranging the qualitative and quantitative results, it becomes evident that even with positive Lugol's test results, quantitative analysis should always be performed to determine starch content. This allows for a better understanding of its origin or source, enabling more reliable conclusions about potential fraud or adulteration in formulations.
5 Conclusion
This study establishes the Anthrone method as a suitable analytical method for starch quantification in meat products, overcoming the critical limitation of insufficient sensitivity demonstrated by the Lane-Eynon method at low concentration ranges. The superior accuracy and precision of the Anthrone method provide the necessary rigor for reliable starch determination. This analytical approach is crucial, as it is shown that the detected starch can often originate from ingredients such as spices or other formulation components rather than intentional addition. Consequently, a positive Lugol’s test might not be a definitive marker of adulteration in products where starch addition is not permitted.
Sole reliance on a qualitative test for starch detection can lead to misinterpretations, as it may suggest adulteration where none exists. To accurately differentiate the starch origin, complementary analyses are essential. Instrumental methods like Ultraviolet-visible (UV-VIS) spectrophotometry enable not only identification but also precise quantification. This allows for the evaluation of whether detected levels align with the current regulations, thereby excluding potential fraud when starch occurs naturally in ingredients.
Therefore, a robust strategy for authenticity testing involves a combined approach. Lugol’s test remains a valuable, cost-effective tool for initial screening, but any positive result in products where starch addition is forbidden must be verified by a quantitative method. This integrated protocol is fundamental to ensure informational veracity, prevent erroneous interpretations and ensure accurate enforcement of food labeling standards, particularly in investigations of potential adulteration cases. Current regulatory criteria may require revision, as they can classify a fresh sausage as non-compliant solely due to the presence of added spices, even when no starch has been intentionally added to the product. Conversely, a fresh sausage formulated with waxy corn starch may fail to exhibit the characteristic coloration specified in the standard, potentially resulting in false-negative interpretations.
Acknowledgements
We acknowledge the “Programa Institucional de Bolsas de Iniciação Científica” (PIBIC/CNPq, grant 800443/2024-1) for the undergraduate research scholarship and Ingredion do Brasil for kindly providing the starches used in this research. We also acknowledge the use of DeepSeek-V3 AI for English language translation assistance.
-
Cite as:
Topa, D. R., Lemos, A. L. S. C. , & Gallina, D. A. (2026). May spices be detected as starch in meat products? Starch quantification in meat products. Brazilian Journal of Food Technology, 29, e2025063. https://doi.org/10.1590/1981-6723.632025
-
Funding:
Bolsa Iniciação Científica/Pibic Nº 003-2024/2025. Conselho Nacional de Desenvolvimento Científico e Tecnológico – CNPq. Processo 800443/2024-1. Código FOM 2024/00012 (ITAL), Brasil.
Data Availability Statement
All data generated or analyzed in this study are included in this published article.
References
-
Ali, F. H., Elmasry, A. A., Hassan, A. H., Mosa, A. M., Ouf, J. M., & Hassan, A. H. (2025). Detection of adulteration in locally marketed retail meat products: Combined histological and chemical analyses. Journal of Advanced Veterinary Research, 15(1), 70-74. Retrieved in 2025, June 12, from https://www.advetresearch.com/index.php/AVR/article/view/2101
» https://www.advetresearch.com/index.php/AVR/article/view/2101 - Association of Official Analytical Chemists - AOAC (2005).Official methods of analysis of the Association of Official Analytical Chemists(18th ed., Chap. 39, pp. 22-23, Method 958.06). Gaithersburg: AOAC.
-
Aued, S., Carvalho, J. B., Tavares, M., Zanelatto, A. M., & Bacetti, L. B. (1990). Starch determination in sausages (hot dogs): comparison between the Fehling and Somogyi–Nelson methods and evaluation of methodology for starch extraction. Revista do Instituto Adolfo Lutz, 50, 251-256. https://doi.org/10.53393/rial.1990.50.35067
» https://doi.org/10.53393/rial.1990.50.35067 -
Bahdanovich, P., Axelrod, K., Khlystov, A. Y., & Samburova, V. (2022). Optimized spectrophotometry method for starch quantification. Analytica, 3(4), 394-405. https://doi.org/10.3390/analytica3040027
» https://doi.org/10.3390/analytica3040027 - Brasil. Ministério da Agricultura, Pecuária e Abastecimento. (1999). Instrução Normativa nº 20, de 21 de julho de 1999. Oficializa os métodos analíticos físico-químicos para controle de produtos cárneos e seus ingredientes - sal e salmoura. Diário Oficial [da] República Federativa do Brasil, Brasília, seção 1.
-
Brasil. Ministério da Agricultura, Pecuária e Abastecimento. (2000). Instrução Normativa nº 4, de 31 de março de 2000. Aprova os Regulamentos Técnicos de Identidade e Qualidade de Carne Mecanicamente Separada, de Mortadela, de Linguiça e de Salsicha. Diário Oficial [da] República Federativa do Brasil, Brasília. Retrieved in 2025, June 12, from https://pesquisa.in.gov.br/imprensa/jsp/visualiza/index.jsp?data=05/04/2000&jornal=1&pagina=54&totalArquivos=73
» https://pesquisa.in.gov.br/imprensa/jsp/visualiza/index.jsp?data=05/04/2000&jornal=1&pagina=54&totalArquivos=73 -
Brasil. Ministério da Agricultura, Pecuária e Abastecimento. (2024).Métodos oficiais para análise de produtos de origem animal – métodos químicos(3. ed.). Brasília: Secretaria de Defesa Agropecuária. Retrieved in 2025, June 12, from https://wikisda.agricultura.gov.br/pt-br/Laborat%C3%B3rios/Metodologia/POA/moapoa-qui
» https://wikisda.agricultura.gov.br/pt-br/Laborat%C3%B3rios/Metodologia/POA/moapoa-qui -
Coelho, A. C. D., Silva, I. T. C. S., Fonseca Junior, G. J. T., Palha, M. L. A. P. F., Cortez, N. M. S., Souto, T. J. M. P., Sobral, A. D., Rocha, O. R. S., Azoubel, P. M., & Freire, E. M. P. L. (2019). Análise qualitativa em cárneos – determinação do limite de detecção do amido. In Anais do 59º Congresso Brasileiro de Química Rio de Janeiro: ABQ. Retrieved in 2025, June 12, from https://www.abq.org.br/cbq/2019/trabalhos/4/1137-12974.html
» https://www.abq.org.br/cbq/2019/trabalhos/4/1137-12974.html - Damodaran, S., Parkin, K., & Fennema, O. R. (2010). Química de alimentos de Fennema (4. ed.). São Paulo: Artmed.
-
Denardin, C. C., & Silva, L. P. (2009). Estrutura dos grânulos de amido e sua relação com propriedades físico-químicas. Ciência Rural, 39(3), 945-954. https://doi.org/10.1590/S0103-84782009005000003
» https://doi.org/10.1590/S0103-84782009005000003 - Dutra, W., & Silva, A. M. A. D. (2013).Processamento de carne e derivados Brasília: e-Tec Brasil.
- Eliášová, M., Pospiech, M., Tremlová, B., Kubíčková, K., & Jandásek, J. (2012). Native and modified starches in meat products-detection of raw materials using microscopy methods. Maso International, 2, 101-108.
-
Giuberti, G., Rocchetti, G., & Lucini, L. (2020). Interactions between phenolic compounds, amylolytic enzymes and starch: An updated overview. Current Opinion in Food Science, 31, 102-113. https://doi.org/10.1016/j.cofs.2020.04.003
» https://doi.org/10.1016/j.cofs.2020.04.003 -
Haldar, D., Sen, D., & Gayen, K. (2017). Development of spectrophotometric method for the analysis of multi-component carbohydrate mixture of different moieties. Applied Biochemistry and Biotechnology, 181(4), 1416-1434. PMid:27787768. https://doi.org/10.1007/s12010-016-2293-3
» https://doi.org/10.1007/s12010-016-2293-3 - Ingredion. (2024). Technical specifications of commercial starches Campinas: Ingredion. [Personal Communication].
-
Labanca, R. A., Silva, C. M. G., & Gloria, M. B. A. (1999). Starch levels in refrigerated and frozen chicken-based meat products. Brazilian Archives of Biology and Technology, 42(2), 1-6. https://doi.org/10.1590/S1516-89131999000200008
» https://doi.org/10.1590/S1516-89131999000200008 - Lajolo, F. M., & Menezes, E. W. (2006).Carbohidratos en alimentos regionales Iberoamericanos São Paulo: Universidade de São Paulo.
-
McCleary, B. V., Gibson, T. S., Mugford, D. C., Lukow, O., Jackson, D. S., Rabe, E., Patel, N., Williams, P. C., Gelroth, J., Camire, M. E., Chibbar, R. N., Ingelin, M., Niemann, C., Grant, L. A., Peterson, D. M., Corke, H., Sanders, P., Muir, J., Choct, M., Schmidt, J., Walker, R., Blakeney, A. B., Logue, S., Tarr, A., Gibson, T., Batey, I., Dynes, J., Miklaszewicz, T., Panozzo, J., McCleary, B., Li, B. W., Hofer, P., Arndt, E., Thomas, M., & Depalo, R. (1997). Measurement of total starch in cereal products by amyloglucosidase-α-amylase method: Collaborative study. Journal of AOAC International, 80(3), 571-579. https://doi.org/10.1093/jaoac/80.3.571
» https://doi.org/10.1093/jaoac/80.3.571 -
McCready, R. M., & Hassid, W. Z. (1943). The separation and quantitative estimation of amylose and amylopectin in potato starch. Journal of the American Chemical Society, 65(6), 1154-1157. https://doi.org/10.1021/ja01246a038
» https://doi.org/10.1021/ja01246a038 -
Moulay, S. (2013). Molecular iodine/polymer complexes. Journal of Polymer Engineering, 33(5), 389-443. https://doi.org/10.1515/polyeng-2012-0122
» https://doi.org/10.1515/polyeng-2012-0122 -
Nwokocha, L. M., & Ogunmola, G. B. (2014). Colour of starch-iodine complex as index of retrogradability of starch pastes. African Journal of Pure and Applied Chemistry, 8(5), 89-93. https://doi.org/10.5897/AJPAC2014.0571
» https://doi.org/10.5897/AJPAC2014.0571 -
Pedroso, R. A., & Demiate, I. M. (2008). Avaliação da influência de amido e carragena nas características físico-químicas e sensoriais de presunto cozido de peru. Food Science and Technology (Campinas), 28(1), 24-31. https://doi.org/10.1590/S0101-20612008000100005
» https://doi.org/10.1590/S0101-20612008000100005 -
Pesek, S., & Silaghi-Dumitrescu, R. (2024). The iodine/iodide/starch supramolecular complex. Molecules (Basel, Switzerland), 29(3), 641. PMid:38338385. https://doi.org/10.3390/molecules29030641
» https://doi.org/10.3390/molecules29030641 -
Pesek, S., Lehene, M., Brânanic, A. M. V., & Silaghi-Dumitrescu, R. (2022). On the origin of the blue color in the iodine/iodide/starch supramolecular complex. Molecules (Basel, Switzerland), 27(24), 8974. PMid:36558106. https://doi.org/10.3390/molecules27248974
» https://doi.org/10.3390/molecules27248974 - Peter, K. V. (2001). Handbook of herbs and spices Boca Raton: CRC Press.
-
Pietrasik, Z., & Janz, J. A. M. (2010). Utilization of pea flour, starch-rich and fiber-rich fractions in low fat bologna. Food Research International, 43(2), 602-608. https://doi.org/10.1016/j.foodres.2009.07.017
» https://doi.org/10.1016/j.foodres.2009.07.017 -
Pospiech, M., Petrášová, M., Tremlová, B., & Randulová, Z. (2014). Detection of native starches in meat products using histochemical Lugol Calleja method. Potravinárstvo, 8(1), 77-81. https://doi.org/10.5219/335
» https://doi.org/10.5219/335 - Raghavan, S. (2007). Handbook of spices, seasonings, and flavorings (2nd ed.). Boca Raton: CRC Press.
- Rodrigues, C., Freitas, J., Freitas, A., & Ferreira, M. (2020). Estudo da propriedade antimicrobiana de especiarias em filmes de amido: Uma proposta experimental. Revista Virtual de Química, 12(5), 1234-1245.
-
Silva, R. A. (2023).Comparação metodológica para determinação de carboidratos e amido em produtos de origem de proteína animal(Trabalho de conclusão de curso). Universidade Federal de Uberlândia, Uberlândia. Repositório institucional da Universidade Federal de Uberlândia. Retrieved in 2025, June 12, from https://repositorio.ufu.br/handle/123456789/38657
» https://repositorio.ufu.br/handle/123456789/38657 - Skoog, D. A., West, D. M., Holler, F. J., & Crounch, S. R. (2015). Fundamentos de química analítica (9. ed., 1088 p.). Stamford: Cengage Learning.
-
Velázquez, R., Rodríguez, A., Hernández, A., Casquete, R., Benito, M. J., & Martín, A. (2023). Spice and herb frauds: types, incidence, and detection: The state of the art. Foods, 12(18), 3373. PMid:37761082. https://doi.org/10.3390/foods12183373
» https://doi.org/10.3390/foods12183373 -
Wang, R., Li, M., Brennan, M. A., Dhital, S., Kulasiri, D., Brennan, C. S., & Guo, B. (2023). Complexation of starch and phenolic compounds during food processing and impacts on the release of phenolic compounds. Comprehensive Reviews in Food Science and Food Safety, 22(4), 3185-3211. PMid:37254305. https://doi.org/10.1111/1541-4337.13180
» https://doi.org/10.1111/1541-4337.13180 - Whistler, R. L., BeMiller, J. N., & Paschall, E. F. (Eds.). (2012).Starch: Chemistry and technology Cambridge: Academic Press.
- Wyatt, G. M. (1992). Food as an assay matrix. In G. M. Wyatt. Immunoassays for food-poisoning bacteria and bacterial toxins (pp. 26-28). Boston: Springer. https://doi.org/10.1007/978-1-4615-2001-6_4
- Young, O. A., Frost, D. A., & Agnew, M. (2012). Analytical methods for meat and meat products. In Y. H. Hui (Ed.), Handbook of meat and meat processing (pp. 139-160). Boca Raton: CRC Press.
-
Zhu, F., Mojel, R., & Li, G. (2018). Physicochemical properties of black pepper (Piper nigrum) starch. Carbohydrate Polymers, 181, 986-993. PMid:29254063. https://doi.org/10.1016/j.carbpol.2017.11.051
» https://doi.org/10.1016/j.carbpol.2017.11.051 -
Zhu, T., Jackson, D. S., Wehling, R. L., & Geera, B. (2008). Comparison of amylose determination methods and the development of a dual wavelength iodine binding technique. Cereal Chemistry, 8(1), 51-58. https://doi.org/10.1094/CCHEM-85-1-0051
» https://doi.org/10.1094/CCHEM-85-1-0051
Edited by
-
Associate Editor:
Carmen Josefina Contreras Castillo.