 Kinetic and mass-transfer modeling of galactooligosaccharide production with free and immobilized β-galactosidase from Kluyveromyces lactis
Abstract
Galactooligosaccharides (GOS) are produced from lactose through enzymatic reactions that depend simultaneously on catalytic properties and mass-transfer phenomena. This study develops and validates a mathematical model for galactooligosaccharide production using free and immobilized β-galactosidase from Kluyveromyces lactis, explicitly incorporating external mass-transfer effects at the biocatalyst-fluid interface. Experiments were performed in lactose solutions and whey using four immobilization systems with different structural and diffusional characteristics. The model reproduces the concentration profiles of lactose, glucose, galactose and total galactooligosaccharides across all temperatures, media and biocatalyst configurations. For free-enzyme runs, the model correctly recovers a transport-transparent regime, confirmed by mass-transfer coefficients several orders of magnitude above any physically realizable resistance, providing an internal consistency check on the parameter estimation; for whey-based systems, explicitly including transport terms reduces systematic bias in the estimated kinetic constants, although overall goodness-of-fit metrics are comparable between the formulations with and without mass transfer. The parameters obtained reflect the combined influence of medium composition, temperature, and immobilization structure on both reaction rates and effective transport. The proposed formulation therefore provides a mechanistic and predictive framework for analyzing enzymatic galactooligosaccharide production under conditions where reaction and diffusion interact.
Keywords:
Lactose hydrolysis; Transgalactosylation; Diffusion limitation; Porous supports; Whey medium; Reaction-diffusion systems; Enzymatic catalysis; Transport resistance; Immobilized biocatalysts
Highlights
Model integrates reaction and diffusion to predict galactooligosaccharide production
Mass-transfer terms clarify transport regimes in lactose and whey systems
Experimental trends indicate support-dependent external transport effects in immobilized β-galactosidase
1 Introduction
Galactooligosaccharides (GOS) constitute a family of lactose-derived oligosaccharides with well-established prebiotic functionality. Their relevance stems from their ability to promote the selective growth of beneficial intestinal microorganisms, principally bifidobacteria and lactobacilli, thereby supporting gut homeostasis and contributing to broader physiological benefits (Sangwan et al., 2011). For this reason, GOS have become widely incorporated into infant formula, fermented dairy products, beverages, and specialized nutrition formulations, where they serve both as functional ingredients and as technological enhancers (Singla & Chakkaravarthi, 2017).
The synthesis of GOS relies on the transgalactosylation activity of β-galactosidases operating in high-lactose media. Under these conditions, the enzyme promotes the formation of new galactosyl linkages in competition with lactose hydrolysis. The degree of polymerization, regioselectivity, and overall product profile are strongly determined by the biological source of the β-galactosidase, which can vary markedly in catalytic behavior, linkage specificity, and kinetic parameters (Frenzel et al., 2015; Gosling et al., 2010; Warmerdam et al., 2013). Enzymes from Kluyveromyces lactis and Aspergillus oryzae remain among the most widely applied in industrial practice due to their accessibility, thermal behavior, and compatibility with food-grade processes (González-Delgado et al., 2016).
GOS are well-suited for food applications owing to their physicochemical robustness, including high solubility, thermal stability, and neutral sensory attributes. These features facilitate integration into thermally processed foods and nutrition systems requiring stable functional additives (Liburdi & Esti, 2022). Their structural resemblance to human milk oligosaccharides further explains their prevalence in infant nutrition, which remains one of the most dynamic market segments within the broader prebiotic ingredient sector (Scott et al., 2016).
Despite these advantages, several technical obstacles constrain large-scale GOS production. The reaction inherently involves a network of parallel and consecutive pathways: lactose hydrolysis, transgalactosylation, and potential secondary modifications of the formed oligosaccharides, making the overall kinetics highly sensitive to substrate concentration, enzyme origin, temperature, pH, and water activity. These complexities have motivated the development of detailed mechanistic and pseudo-steady-state models aimed at predicting product evolution and optimizing operating conditions (Chen et al., 2003; Vera et al., 2011). Such models provide essential insight into the interplay between catalytic activity and process variables, yet their translation to industrial environments remains limited.
Enzyme immobilization has emerged as an effective strategy to enhance process efficiency by improving biocatalyst stability, enabling reuse, and facilitating operation in continuous or integrated configurations. A broad range of immobilization techniques, including adsorption, entrapment, and covalent attachment on chitosan, polyvinyl alcohol (PVA), and other supports, has been explored to increase operational lifetimes and to simplify product recovery (Jovanovic-Malinovska et al., 2012; Sheu et al., 1998). However, immobilization introduces additional mass-transfer resistances, which in turn may alter apparent kinetics and modulate GOS distribution. Accounting for these effects is therefore important when moving toward reactor design and scale-up (Dunnill, 1979; Mariotti et al., 2008).
The use of dairy by-products, particularly whey and whey permeate, as fermentation substrates presents a complementary route toward cost-effective and sustainable GOS production. Owing to their high lactose content and widespread availability, these streams provide a suitable substrate for enzymatic conversion and reduce the environmental impact associated with whey disposal. Several studies have demonstrated efficient GOS formation directly from whey-based systems, including processes incorporating enzyme immobilization and ultrafiltration (Argenta et al., 2021; Deshmukh et al., 2024; Jovanovic-Malinovska et al., 2012).
An additional consideration with increasing relevance at industrial scale concerns the influence of mass transfer and hydrodynamics on reaction performance. High-viscosity lactose solutions, the presence of immobilized biocatalysts, and complex flow regimes can generate local gradients that affect substrate availability and alter the balance between hydrolysis and transgalactosylation. Similar behavior has been documented in enzymatic liquid-liquid systems, reinforcing the case for incorporating mass-transfer phenomena into process models when seeking realistic predictions and consistent product profiles (Noriega et al., 2017).
The literature shows meaningful progress in understanding GOS synthesis, but notable gaps remain at the interface between reaction kinetics, mass transfer, and process engineering. Addressing these gaps is necessary for developing predictive models that support scale-up and for enabling more rational design of industrial GOS production systems, particularly those involving viscous substrates, immobilized enzymes, or integrated reaction-separation configurations.
2 Materials and methods
2.1 Reagents
Analytical-grade reagents were used in all experiments. Lactose monohydrate (Merck) served as the primary substrate. Sodium alginate (Carlo Erba) and calcium chloride (Merck) were used for bead preparation. Glutaraldehyde 25 wt% in water (Polysciences Inc.) was used as the crosslinking agent. Silica gel 60 (220-450 mesh, Sigma-Aldrich) was employed as the support material for enzyme immobilization. Tris(hydroxymethyl)aminomethane (Sigma-Aldrich) and potassium diacid and monoacid phosphate (J.T. Baker) were used for buffer preparation.
Two whey-derived materials were used as lactose sources. Dehydrated milk whey contained 76.38 ± 0.42 wt% lactose. Commercial concentrated whey powder (Colanta) had the following composition: moisture 4.0 wt%, acidity 1.2 wt%, ash 6.0 wt%, lactose 80 wt%, protein 11 wt%, and fat 0.5 wt%. In addition, o-Nitrophenyl-β-D-galactopyranoside (ONPG, Sigma-Aldrich) was used for β-galactosidase activity assays. Glucose (Carlo Erba), galactose (Sigma-Aldrich), and lactose monohydrate (Sigma-Aldrich) were used as High Performance Liquid Chromatography (HPLC) calibration standards.
The β-galactosidase preparation used in all assays was Lactozym Pure® 6500 L (Novozymes, Denmark), produced by Kluyveromyces lactis.
2.2 GOS synthesis using free β-galactosidase
Lactose monohydrate and dehydrated milk whey (Section 2.1) were used as substrates in the free-enzyme experiments. β-Galactosidase (βgal) from K. lactis (Lactozym Pure® 6500 L) was added directly to the reaction medium. Reactions were carried out under constant agitation at 40 ± 1 °C or 50 ± 1 °C and pH 6.0 ± 0.01.
The initial enzyme-to-lactose mass ratio, , was set to 1.00, 1.25, or 1.50 according to Equation 1:
The desired values of were obtained by varying the initial lactose concentration (333, 400, and 500 g L-1).
2.3 Enzyme immobilization and characterization
Four immobilized systems were prepared: calcium alginate beads (A), calcium alginate beads containing zeolitic material (AWZ), silica gel (S), and chemically treated silica gel (TS).
2.3.1 Alginate beads (A)
A sodium alginate solution (2 wt% in distilled water, 50 mL) was mixed with 500 μL of the β-galactosidase preparation under magnetic stirring for 1 h. The mixture was then pumped into a previously cooled calcium chloride solution to form gel beads. The pumping rate was adjusted to obtain particles with an average diameter of approximately 3 mm (Giordano & Camargo Giordano, 2006; Mariotti et al., 2008).
2.3.2 Alginate beads with zeolitic material (AWZ)
Sodium alginate solution (2 wt%, 50 mL) was combined with 0.1 g of a zeolitic material to increase the internal porosity of the gel matrix. After dispersion of the solid phase, 500 μL of enzyme were added and mixed for 1 h. The mixture was subsequently dripped into a cooled calcium chloride solution (Giordano & Camargo Giordano, 2006; Mariotti et al., 2008).
2.3.3 Silica (S)
One gram of silica gel was suspended in potassium phosphate buffer (0.1 M, pH 7.0) containing 500 μL of enzyme and gently stirred for 12 h to allow adsorption (Dunnill, 1979; Giordano & Camargo Giordano, 2006; Sheu et al., 1998). The immobilization cycle was repeated several times using fresh buffer (0.1 M potassium phosphate, pH 7.0).
2.3.4 Treated silica (TS)
Silica gel (1 g) was washed with deionized water and immersed in a 0.5 M Tris solution (10 mL) for 4 h. After filtration, the solid was reacted with 10 mL of a 10 wt% glutaraldehyde solution prepared in potassium phosphate buffer (0.1 M, pH 7.0) under magnetic stirring for 4 h (Dunnill, 1979; Giordano & Camargo Giordano, 2006; Sheu et al., 1998). This activation procedure was repeated using fresh buffer. For enzyme immobilization, the treated silica was suspended in 10 mL of potassium phosphate buffer (0.1 M, pH 7.0) containing 500 μL of enzyme, stirred for 12 h, filtered, and washed with buffer before use.
2.3.5 Enzyme activity assay
The activity of the free and immobilized preparations was measured using ONPG as substrate. Aliquots of 100 μL of enzyme (diluted 1:100 in 0.1 M phosphate buffer) were reacted with 4.9 mL of 0.2 mM ONPG solution in the same buffer.
Absorbance at 420 nm was recorded in triplicate. The enzymatic activity was calculated as Equation 2:
2.4 GOS production using immobilized β-galactosidase
GOS were produced using β-galactosidase immobilized on the four supports described in Section 2.3: silica (EIS), treated silica (EITS), alginate beads (EIA), and alginate beads containing zeolitic material (EIAWZ). Reactive-grade lactose solutions and dehydrated milk whey were used as substrates.
For the silica-based biocatalysts (EIS and EITS), the reactions were carried out at 40 ± 1 °C and pH 6.0 ± 0.01. For the alginate-based preparations (EIA and EIAWZ), the assays were performed at 50 ± 1 °C and pH 6.0 ± 0.01. In all cases, the reaction mixtures were maintained under constant agitation to ensure contact between the immobilized enzyme and the substrate.
Monitoring time was set to 90 min for the free-enzyme systems, where reactions are fast and the complete GOS concentration profile, including both the accumulation and re-hydrolysis phases, is captured within that window. All immobilized preparations (EIS, EITS, EIA, EIAWZ), retained reduced activity (17% to 44%), and external mass-transfer resistance inherent to each support slows the overall reaction rate considerably. GOS maxima in these systems typically appear between 90 and 180 min; a 270 min monitoring window was therefore applied to all immobilized biocatalysts to ensure full observation of the GOS profile and robust estimation of all kinetic parameters, in particular the forward and reverse rate constants k4 and k5 governing GOS synthesis and re-hydrolysis.
2.5 Carbohydrate quantification (HPLC-RI)
Carbohydrate composition (lactose, glucose, galactose and galactooligosaccharides) was determined by HPLC with refractive index detection (HPLC-RI). Analyses were carried out on a LaChrom Elite® system (Merck-Hitachi High-Tech, Tokyo, Japan) equipped with a pump (L-2130) with an in-line degasser, column oven (L-2350), autosampler (L-2200) set to an injection volume of 20 µL, and refractive index detector (L-2490). Chromatographic data were acquired and processed using EZChrom Elite software (Scientific Software, Pleasanton, CA, USA).
Samples were injected onto a CarboSep CHO-411 column (300 mm × 7.8 mm, Bio-Rad, USA) operated at 75 °C. Deionized water was used as the mobile phase at a flow rate of 0.4 mL min−1. The total GOS concentration was estimated by carbohydrate mass balance, using the initial lactose concentration and the quantified concentrations of lactose, glucose and galactose.
2.6 Mathematical model for GOS synthesis including mass-transfer effects
A mechanistic model was formulated to describe the evolution of lactose (Lac), glucose (Glu), galactose (Gal), and GOS during the β-galactosidase-catalyzed reactions studied. The reaction network was constructed using the pseudo-elementary steps commonly employed in mechanistic formulations of β-galactosidase kinetics, in which water is not written explicitly because hydrolysis and transgalactosylation are represented through the formation and decay of the enzyme-galactosyl intermediate. The kinetic mechanism corresponds to a double-displacement (substituted enzyme) pathway, in which β-galactosidase forms a covalent galactosyl-enzyme intermediate that can be resolved by either water (hydrolysis, Reaction 2) or a sugar acceptor (transgalactosylation, Reaction 3) (Callender & Dyer, 2015; Fisher, 2005; Punekar, 2025). Accordingly, the catalytic sequence comprises:
-
(i) formation of the enzyme-galactosyl intermediate (E-Gal);
-
(ii) hydrolysis of this intermediate to yield Gal;
-
(iii) transfer of the galactosyl moiety to a second lactose molecule, yielding GOS.
The chromatographic method used (CarboSep CHO411, RI detection) does not resolve individual GOS species beyond DP 2-3. For this reason, the model treats “GOS” as a lumped variable representing the sum of all transgalactosylation products detected experimentally. Higher-degree oligomers (DP ≥ 4), as well as galactobiose and allolactose, could not be distinguished and were therefore not introduced as separate species; their contribution is implicitly included in the measured GOS fraction when present. Before model formulation, monosaccharide-unit conservation was verified experimentally to ensure that the measured profiles of lactose, glucose, galactose, and lumped GOS were internally consistent within analytical uncertainty.
Therefore, Reactions 1-3 represent only the dominant pathways supported by the experimental measurements.
here, denotes the free enzyme and the enzyme-galactose intermediate. The reactions are written formally as reversible to reflect the possibility of recombination of products with the enzyme; however, under the conditions used in this work, the net flux is directed toward product formation. All concentrations are expressed in g·L−1, consistent with the analytical quantification.
2.6.1 Material balance equations
The reaction scheme in Reactions 1-3 was translated into a system of material balances describing the temporal evolution of the species involved. The concentrations of lactose at the enzyme microenvironment (CLS), glucose (Glu), galactose (Gal), GOS, free enzyme (E), and enzyme-galactosyl intermediate (E-Gal) were expressed in g·L−1, matching the analytical measurements used for model validation.
For free-enzyme experiments, CLS coincides with the bulk lactose concentration because no diffusional barriers are present. For immobilized preparations, CLS differs from the bulk value (CL) due to mass-transfer limitations; this distinction is incorporated explicitly in the transport expression presented later.
The balance Equations 3 to 8 corresponding to Reactions 1-3 are:
These equations account for formation and consumption of the enzyme-galactosyl intermediate and ensure conservation of the total enzyme (free + bound), which remains constant throughout the reaction. This conservation constraint, [E] + [E–Gal] = Eₜoₜaₗ, renders one of the six ODEs algebraically dependent on the remaining five, so that the system effectively comprises five independent differential equations for five unknown kinetic parameters (k1-k5) (Fisher, 2005; Punekar, 2025).
2.6.2 Incorporation of mass-transfer effects
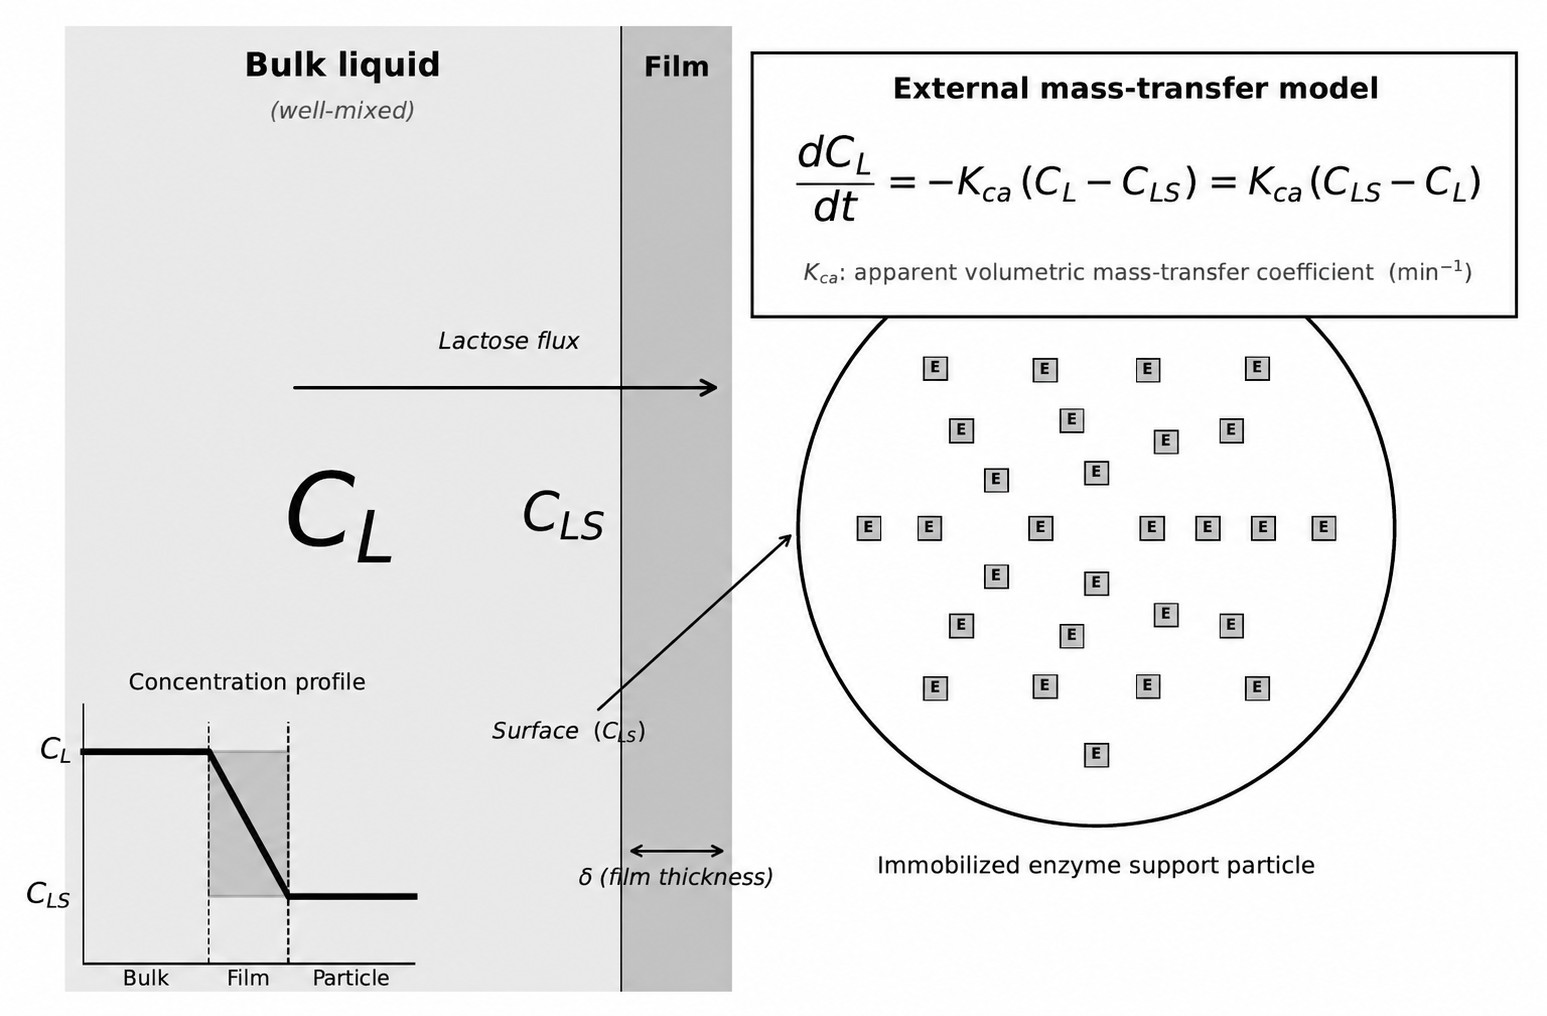
For immobilized enzyme systems (alginate-based or silica-based supports), lactose transport from the bulk liquid to the enzyme microenvironment was represented by a first-order driving-force expression:
where: is the lactose concentration in the well-mixed bulk liquid; is the lactose concentration at the enzyme surface; is an apparent mass-transfer coefficient (min−1). A schematic of the external mass-transfer resistance framework is shown in Figure 1.
Schematic representation of the external mass-transfer resistance model. denotes the lactose concentration in the well-mixed bulk liquid and the lactose concentration at the external surface of the biocatalyst particle. Transport is driven by the concentration difference between the bulk liquid and the particle surface across the external film.
Equating the rate of lactose arrival by diffusion with the rate at which it is consumed at the enzyme surface yields the algebraic relation:
This expression ensures consistency between transport and reaction at the catalytic site and allows CLS to be computed at each integration step for immobilized systems.
To verify that intraparticle (internal), it can be noted that diffusion did not constitute a rate-controlling resistance in the alginate-based systems, the Weisz-Prater criterion was applied using the experimentally determined bead radius (Rₚ = 1.5 mm) and literature values for the effective diffusivity of lactose in calcium alginate ( ≈ 2-5 × 10⁻⁶ cm2·s−1). The Weisz-Prater parameter was found to be well below 0.3 in all cases. For the most conservative scenario, alginate beads of Rₚ = 1.5 mm operating at the highest initial rate (SL+EIA, 50 °C, k1·· ≈ 4 × 10⁻⁷ g·cm−3·s−1) and taking , the Weisz-Prater parameter evaluates to approximately 0.009, far below the 0.3 threshold, confirming that intraparticle diffusion resistance was negligible under the experimental conditions. It is noted that this criterion was evaluated for lactose, the rate-limiting substrate; GOS molecules, being larger, exhibit lower effective diffusivity but are products whose intraparticle transport does not control the overall reaction rate. The model presented in Equation 9 therefore constitutes a physically justified representation of the dominant transport limitation in these systems. For clarity, the external mass-transfer resistance model is illustrated in Figure 1, thus highlighting the concentration gradient between the bulk phase and the biocatalyst surface and the associated film transport mechanism (Wolf, 2004).
2.7 Numerical solution and parameter estimation
The system of differential and algebraic equations defining the reaction-diffusion model (Equations 3-10) was solved in MATLAB® R2018a. Time integration of the ordinary differential equations was performed using the variable-step solver ode15s, which is suitable for moderately stiff kinetic systems. At each integration step, the algebraic expression for (Equation 10) was enforced to maintain consistency between reaction rates and substrate transport to the enzyme microenvironment. All calculations were carried out using concentrations expressed in g·L−1, matching the units of the experimental data.
The unknown model parameters comprised five kinetic rate constants and one apparent mass-transfer coefficient . Their values were obtained by casting parameter estimation as a nonlinear least-squares problem, in which the deviation between measured and calculated concentrations of lactose, glucose, galactose and GOS was minimized. The objective function was defined as:
where is the number of components fitted (lactose, glucose, galactose, GOS), and the number of sampling times. and denote the experimental and calculated concentrations, respectively.
Parameter estimation was carried out using the ga function from the MATLAB® Global Optimization Toolbox. For each generation , the algorithm generated a population of candidate parameter vectors, integrated the model for each candidate, and evaluated the objective function (Equation 11). Selection, crossover, and mutation operators were then applied to construct the next generation. Iterations proceeded until a predefined maximum number of generations was reached or until no further decrease in was observed. The parameter vector yielding the lowest value of the objective function was retained for subsequent simulations. The workflow of the genetic-algorithm-based estimation procedure is summarized in Figure 2.

3 Results and discussion
3.1 Experimental results for GOS production kinetics
3.1.1 Lactose media with the free enzyme.
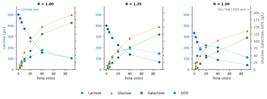
Figure 3 shows the concentration profiles of lactose, glucose, galactose, and total GOS obtained in lactose media using free β-galactosidase at 40 °C for three enzyme-to-lactose mass ratios (R = 1.00, 1.25, and 1.50). Lactose decreases monotonically throughout the reaction because its consumption through Reaction 1 is effectively irreversible under the tested conditions. Glucose increases steadily, as it is produced exclusively by Reaction 1 and is not consumed in any subsequent step. Galactose also increases continuously, reflecting that the forward flux of Reaction 2 remains higher than its reverse flux during the entire experimental window.

Experimental concentration profiles of lactose, glucose, galactose, and total GOS during reactions with free β-galactosidase in lactose media at 40 °C. Panels correspond to enzyme-to-lactose ratios R = 1.00 (left), 1.25 (center), and 1.50 (right). Circles represent lactose, triangles glucose, squares galactose, and diamonds GOS. Dashed lines serve only as visual guides.
GOS formation exhibits the characteristic rise-and-fall behavior commonly observed in β-galactosidase systems operating at high lactose concentrations. During the early stages, both lactose availability and the forward rate of the transgalactosylation step (Reaction 3) are high, leading to rapid GOS accumulation. As the reaction proceeds, lactose depletion lowers the forward rate of Reaction 3, while the increasing GOS concentration enhances the reverse step. The combination of these effects produces a distinct maximum GOS concentration for each enzyme/lactose ratio. Increasing R accelerates the overall hydrolysis rate, resulting in earlier and lower GOS maxima: the highest maximum corresponds to R = 1.00 (≈ 60 min), followed by R = 1.25 (≈ 40 min), and the lowest is observed for R = 1.50, where the decline after the maximum is more pronounced. These trends are consistent with the shift toward hydrolysis observed at high enzyme loadings and have been widely reported for β-galactosidase-catalyzed GOS synthesis.
Figure 4 presents the corresponding experiments conducted at 50 °C. Compared with 40 °C, all reactions show slower lactose consumption, lower GOS maxima, and a smaller difference between glucose and galactose concentrations. These changes indicate a reduction in the catalytic efficiency of the free enzyme at 50 °C, consistent with the partial thermal inactivation reported for K. lactis β-galactosidase near this temperature range (Rodríguez et al., 2006).

Experimental concentration profiles of lactose, glucose, galactose, and total GOS during reactions with free β-galactosidase in lactose media at 50 °C. Panels correspond to enzyme-to-lactose ratios R = 1.00 (left), 1.25 (center), and 1.50 (right). Circles represent lactose, triangles glucose, squares galactose, and diamonds GOS. Dashed lines serve only as visual guides.
For the tested conditions, the highest GOS concentration at 40 °C was obtained with R = 1.00 at approximately 60 min, whereas at 50 °C the best performance corresponded to R = 1.00. These results confirm the strong influence of temperature and enzyme loading on the transient formation of GOS and confirm that 40 °C provides more favorable conditions for the free-enzyme system evaluated.
3.1.2 Milk whey media with the free enzyme.
Figure 5 shows the evolution of lactose, glucose, galactose and total GOS in milk whey (SW) at 40 °C for enzyme-to-lactose ratios R = 1.00, 1.25 and 1.50. As in the lactose media (Figure 3), lactose decreases monotonically while glucose and galactose increase throughout the reaction. GOS again exhibits the typical rise-fall profile associated with β-galactosidase systems under high initial lactose concentrations. However, all reactions in SW proceed more slowly than in pure lactose solutions. The lower reaction rate is consistent with the higher complexity of the SW matrix, whose proteins, minerals, and residual lipids may hinder the effective accessibility of lactose to the active site or contribute to inhibitory effects.
Experimental concentration profiles for reactions with free β-galactosidase in milk whey at 40 °C. Panels correspond to enzyme-to-lactose ratios R = 1.00 (left), R = 1.25 (center), and R = 1.50 (right). Circles represent lactose, triangles glucose, squares galactose, and diamonds GOS. Dashed lines are included only to guide the eye.
A key difference compared with lactose media is the trend in maximum GOS formation. In SW, the magnitude of the GOS maximum increases when R increases, opposite to what was observed in pure lactose (Figure 3). This shift can be attributed to the slower overall hydrolysis in SW: at low R the reaction progresses gradually and hydrolysis dominates before substantial transgalactosylation occurs, while at higher R the faster initial turnover partially compensates for the matrix-related restrictions and allows a larger transient accumulation of GOS. In all cases, the GOS maximum occurs earlier at higher enzyme loadings, reflecting the faster initial conversion rates.
Figure 6 presents the corresponding experiments at 50 °C. As in lactose media (Figure 4), the reactions at 50 °C in SW display lower lactose consumption rates and smaller GOS maxima than those at 40 °C, indicating partial thermal inactivation of the free enzyme. The strongest GOS formation at 50 °C is obtained at R = 1.50, with a maximum at approximately 40 min, whereas at lower ratios the reduced catalytic activity limits transgalactosylation. These observations are consistent with reports that β-galactosidase from K. lactis experiences significant activity loss near 45-50 °C, compromising both hydrolysis and transgalactosylation capacity (Argenta et al., 2021).

Experimental concentration profiles for reactions with free β-galactosidase in milk whey at 50 °C. Panels correspond to enzyme-to-lactose ratios R = 1.00 (left), R = 1.25 (center) and R = 1.50 (right). Circles represent lactose, triangles glucose, squares galactose, and diamonds GOS. Dashed lines are included only to guide the eye.
The whey experiments confirm that the reaction medium is not inert: switching from pure lactose to whey slows both hydrolysis and transgalactosylation and shifts the enzyme-loading dependence of GOS yield. Under whey conditions, higher enzyme loadings help offset matrix-related accessibility and inhibitory effects, and 40 °C remains the more favorable temperature for maintaining full catalytic activity.
3.1.3 Lactose media with immobilized enzyme.
Figures 7-10 summarize the concentration profiles of lactose, glucose, galactose, and GOS obtained using four immobilized β-galactosidase systems in lactose media. Immobilization markedly alters the kinetic behavior relative to the free enzyme, not only because of the reduction in catalytic activity (17-44%) but also due to external mass-transfer resistance at the biocatalyst surface and support-dependent accessibility effects, particularly in alginate-based matrices. These effects become evident in the slower lactose conversion, delayed and broadened GOS maxima, and shifts in the relative rates of hydrolysis and transgalactosylation.

Experimental concentration profiles for reactions with immobilized β-galactosidase on silica gel (SL+EIS) in lactose media at 40 °C. Panels correspond to enzyme-to-lactose ratios R = 0.35 (left), R = 0.43 (center), and R = 0.52 (right). Circles represent lactose, triangles glucose, squares galactose, and diamonds GOS. Dashed lines are included only to guide the eye.

Experimental concentration profiles for reactions with immobilized β-galactosidase on treated silica gel (SL+EITS) in lactose media at 40 °C. Panels correspond to enzyme-to-lactose ratios R = 0.44 (left), R = 0.55 (center), and R = 0.66 (right). Circles represent lactose, triangles glucose, squares galactose, and diamonds GOS. Dashed lines are included only to guide the eye.

Experimental concentration profiles for reactions with immobilized β-galactosidase in calcium alginate (SL+EIA) in lactose media at 50 °C. Panels correspond to enzyme-to-lactose ratios R = 0.17 (left), R = 0.21 (center), and R = 0.25 (right). Circles represent lactose, triangles glucose, squares galactose, and diamonds GOS. Dashed lines are included only to guide the eye.
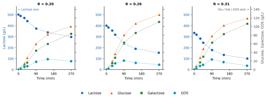
Experimental concentration profiles for reactions with immobilized β-galactosidase in calcium alginate containing zeolitic material (SL+EIAWZ) in lactose media at 50 °C. Panels correspond to enzyme-to-lactose ratios R = 0.20 (left), R = 0.26 (center), and R = 0.31 (right). Circles represent lactose, triangles glucose, squares galactose, and diamonds GOS. Dashed lines are included only to guide the eye.
For the silica-gel biocatalyst (SL+EIS, Figure 7), lactose conversion proceeds more slowly than in the free-enzyme system, and the transgalactosylation window is noticeably extended. GOS maxima shift to 80-120 min, longer than the 40-60 min observed at 40 °C with free enzyme (Figure 3), consistent with the reduced activity retained after immobilization (35%). Increasing the enzyme-to-lactose ratio accelerates lactose depletion but shortens the GOS window and lowers its maximum concentration, indicating that higher enzyme loading does not compensate for external transport resistance and instead favors hydrolysis. This is consistent with a local lactose depletion effect: external mass-transfer resistance lowers the lactose concentration at the enzyme microenvironment relative to the bulk, reducing the transgalactosylation-to-hydrolysis ratio as predicted by the model.
The treated-silica system (SL+EITS, Figure 8) clearly outperforms the other immobilized preparations. Retained activity is the highest (44%), and the support structure offers a more favorable microenvironment for catalysis. As a result, this system produces the highest GOS concentration observed in the entire study (≈120 g·L−1 at R = 0.44), with the maximum appearing at approximately 150 min. This enhanced performance reflects lower external transport constraints and better preservation of enzyme functionality. Similar behavior has been reported in the literature for K. lactis β-galactosidase immobilized in sol-gel matrices or PVA lenses, which retained 73-89% of activity and were reusable over multiple reaction cycles (Jovanovic-Malinovska et al., 2012). Although the retained activity in the present work is lower, the relative advantage of treated silica over other supports aligns well with those observations.
In contrast, the calcium-alginate system (SL+EIA, Figure 9), evaluated at 50 °C, displays the slowest reaction rates. Its retained activity (17%) is the lowest among the systems, and external mass-transfer resistance at the bead surface limits substrate supply to the active sites. Only modest GOS accumulation is observed before re-hydrolysis becomes dominant. The elevated temperature further restricts performance, as calcium alginate gel matrices at elevated temperatures may undergo structural densification, including reduced pore dimensions in the gel network, which limits substrate accessibility to the immobilized active sites and further aggravates the already low intrinsic activity (Kim et al., 2019).
The alginate composite containing zeolitic material (SL+EIAWZ, Figure 10) performs only slightly better in terms of retained activity (20%) but shows pronounced mass-transfer limitation. The zeolitic phase modifies the support structure in a way that reduces effective contact between lactose and the active sites, leading to limited lactose conversion (~40%), low GOS maxima, and rapid decline after the peak. Both hydrolysis and transgalactosylation become strongly suppressed at higher substrate concentrations, consistent with a system under external mass-transfer control. Additionally, the surface charge and microporous structure of the zeolitic material may introduce electrostatic or size-exclusion effects that further restrict access of lactose and GOS molecules to the active sites.
The immobilized systems show that catalytic retention and support-dependent transport properties jointly determine GOS productivity. Treated silica (SL+EITS) provides the most favorable balance, resulting in the highest GOS yields and extended transgalactosylation windows. Alginate-based supports, especially the zeolitic variant, exhibit stronger external mass-transfer constraints and reduced effectiveness, particularly at 50 °C. This indicates that support selection for GOS production cannot rely on activity retention alone; surface accessibility, microstructure, and external transport behavior of the carrier also determine the performance of immobilized β-galactosidase systems.
3.1.4 Whey media with the immobilized enzyme.
Figures 11-14 show the concentration profiles for lactose, glucose, galactose, and GOS obtained in whey media using four immobilized β-galactosidase systems, each evaluated at three enzyme-to-lactose ratios (R). Compared with lactose media, all immobilized systems exhibit lower lactose hydrolysis rates and significantly reduced GOS formation, indicating that whey imposes additional mass-transfer barriers. This effect has been attributed to the presence of proteins, residual sugars (notably glucose and galactose), salts such as sodium chloride, and fat globules, all of which increase diffusional resistance and may exert inhibitory effects on the hydrolysis step (Rico Rodríguez, 2018).

Experimental concentration profiles for reactions with immobilized β-galactosidase on silica gel (SW+EIS) in whey at 40 °C. Panels correspond to enzyme-to-lactose ratios R = 0.35 (left), R = 0.43 (center) and R = 0.52 (right). Circles represent lactose, triangles glucose, squares galactose, and diamonds GOS. Dashed lines are included only to guide the eye.
Experimental concentration profiles for reactions with immobilized β-galactosidase on treated silica gel (SW+EITS) in whey at 40 °C. Panels correspond to enzyme-to-lactose ratios R = 0.35 (left), R = 0.43 (center) and R = 0.52 (right). Circles represent lactose, triangles glucose, squares galactose, and diamonds GOS. Dashed lines are included only to guide the eye.
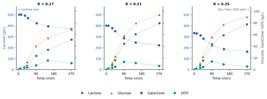
Experimental concentration profiles for reactions with immobilized β-galactosidase on calcium alginate (SW+EIA) in whey at 50 °C. Panels correspond to enzyme-to-lactose ratios R = 0.17 (left), R = 0.21 (center) and R = 0.25 (right). Circles represent lactose, triangles glucose, squares galactose, and diamonds GOS. Dashed lines are included only to guide the eye.

Experimental concentration profiles for reactions with immobilized β-galactosidase on calcium alginate with zeolitic material (SW+EIAWZ) in whey at 50 °C. Panels correspond to enzyme-to-lactose ratios R = 0.20 (left), R = 0.26 (center) and R = 0.31 (right). Circles represent lactose, triangles glucose, squares galactose, and diamonds GOS. Dashed lines are included only to guide the eye.
For the system immobilized on silica gel (SW+EIS) at 40 °C (Figure 11), lactose decreases steadily throughout the reaction, but at a noticeably slower rate than in lactose media (Figure 7). The GOS concentration reaches a moderate maximum around the mid-reaction period, after which it stabilizes or decreases slightly, reflecting the early dominance of hydrolysis over transgalactosylation. Although the magnitude of this maximum increases with R, the overall GOS levels remain considerably lower than those obtained with lactose as the substrate.
A similar trend is observed when using treated silica gel (SW+EITS) at 40 °C (Figure 12); however, the treated support consistently shows higher lactose conversion and greater GOS formation compared with SW+EIS. This improved performance aligns with its higher retained enzymatic activity (44%), which is more than twice the retained activity observed for alginate-based supports. Even in whey, the treated silica system achieves the highest GOS production among the immobilized materials, and the GOS maximum appears earlier at lower enzyme loadings, indicating that the enhancement in surface chemistry partially compensates for external transport and inhibitory limitations.
Figures 13and 14 present the profiles obtained at 50 °C for calcium alginate (SW+EIA) and alginate with zeolitic material (SW+EIAWZ), respectively. In both cases, lactose hydrolysis is slower and GOS maxima are modest, particularly when compared with silica-based systems. The alginate matrix, especially in its pure form, presents a compact gel structure that limits substrate accessibility through external mass-transfer resistance, and this effect becomes more pronounced in whey, where medium complexity adds additional transport barriers. GOS concentrations reach a maximum and level off early in the reaction even at higher R values, demonstrating that transgalactosylation is rapidly suppressed, as also observed in lactose media (Figures 9 and 10). In the alginate-zeolite system, a shallow GOS maximum is followed by a decline, consistent with the combined influence of limited enzymatic activity (20%) and inhibition by whey components.
The four immobilized systems follow the same pattern observed with free enzyme in whey: lower lactose consumption, earlier inhibition of transgalactosylation, and reduced GOS yields relative to lactose media. Among the supports, treated silica gel remains the most effective material, displaying superior enzymatic activity retention and the highest GOS production under all conditions evaluated. This superiority is in good agreement with previous findings by Jovanovic-Malinovska et al. (2012), who reported that β-galactosidase immobilized in sol-gel matrices can preserve high enzymatic activity and sustain multiple reaction cycles. The present results confirm that support morphology and surface chemistry play a dominant role in mitigating external transport barriers, especially when operating in complex substrates such as whey.
3.2 Estimation of kinetic parameters
3.2.1 Kinetic parameters correlation without mass transfer considerations
Table 1 summarizes the apparent kinetic parameters (k1-k5) obtained by fitting the kinetic model, without explicitly including mass-transfer terms. In every case, the coefficients of determination (R2) exceed 0.93, indicating that the model reproduces well the dominant trends of lactose hydrolysis, monosaccharide formation, and GOS accumulation across all temperatures and catalyst configurations.
Apparent kinetic parameters (k1-k5) and coefficients of determination (R2) obtained by fitting the kinetic model without explicit mass-transfer terms.
For the free enzyme, the apparent rate constants k1-k4 are systematically smaller at 50 °C than at 40 °C, which is consistent with the lower catalytic activity inferred from the experimental profiles (Figures 3 and 6) and agrees with the known thermal sensitivity of soluble β-galactosidase. In contrast, several parameters for immobilized systems are larger at 50 °C. This behavior reflects the mixed nature of the fitted constants: they combine intrinsic temperature effects on enzymatic activity with temperature-dependent changes in transport properties (e.g., viscosity and diffusivity), which become particularly relevant in porous supports.
When lactose solutions and whey are compared at the same temperature and biocatalyst, the fitted constants for whey are generally smaller, especially those associated with transgalactosylation (k4 and the ratio k4/k5). This trend is consistent with the experimentally observed lower GOS maxima in whey and with the inhibitory and matrix-related accessibility effects attributed to whey components such as proteins, residual sugars, and dissolved salts.
Within the kinetic scheme, k1 governs lactose hydrolysis (Reaction 1) and is the smallest parameter in all systems, confirming that this is the slowest apparent step under the studied conditions. The substituted-enzyme (double-displacement) kinetic framework adopted here is consistent with the mechanistic model previously applied to K. lactis β-galactosidase for GOS synthesis from lactose (Kim et al., 2004); within this framework, the relatively small magnitude of k1 confirms that the initial bimolecular substrate-binding step constitutes the flux-controlling stage under the high-substrate concentrations employed in this study. The apparent initial lactose consumption rate for each system can be estimated directly from the fitted k1 values in Table 1 as .
Comparison across systems confirms that the treated-silica preparation (SL+EITS) yields the highest initial rate among the immobilized configurations, consistent with its highest retained activity (44%), while the alginate-based systems (SL+EIA, SL+EIAWZ) exhibit the lowest initial rates, reflecting both reduced retained activity (17-20%) and external transport resistance associated with the support. Parameters k4 and k5 modulate GOS synthesis and re-hydrolysis (Reaction 3), and the ratio k4/k5 provides a qualitative indication of the balance between transgalactosylation and GOS degradation. Inspection of Table 1 shows that the highest k4 value is found for the free enzyme in whey at 50 °C (SW+FE: k4= 26.50 × 10⁻³ L·g−1·min−1), while the largest k4/k5 ratio corresponds to the free enzyme in lactose at 40 °C (SL+FE: k4/k5≈ 0.64), consistent with the more favorable transgalactosylation balance in the absence of diffusional and inhibitory constraints. In contrast, immobilized systems, particularly the alginate-based preparations (SL+EIA, SL+EIAWZ, SW+EIA, SW+EIAWZ), consistently show the lowest k4 and k4/k5 values, reflecting the combined effect of reduced retained activity and external transport resistance. The highest experimental GOS production (∼120 g·L−1) is achieved with SL+EITS in lactose medium at 40 °C. This contrast indicates that apparent kinetic preferences alone do not determine GOS yield; substrate concentration, mass-transfer resistance, and enzyme stability also exert strong effects, which are implicitly embedded in the fitted parameters (Fisher, 2005; Punekar, 2025).
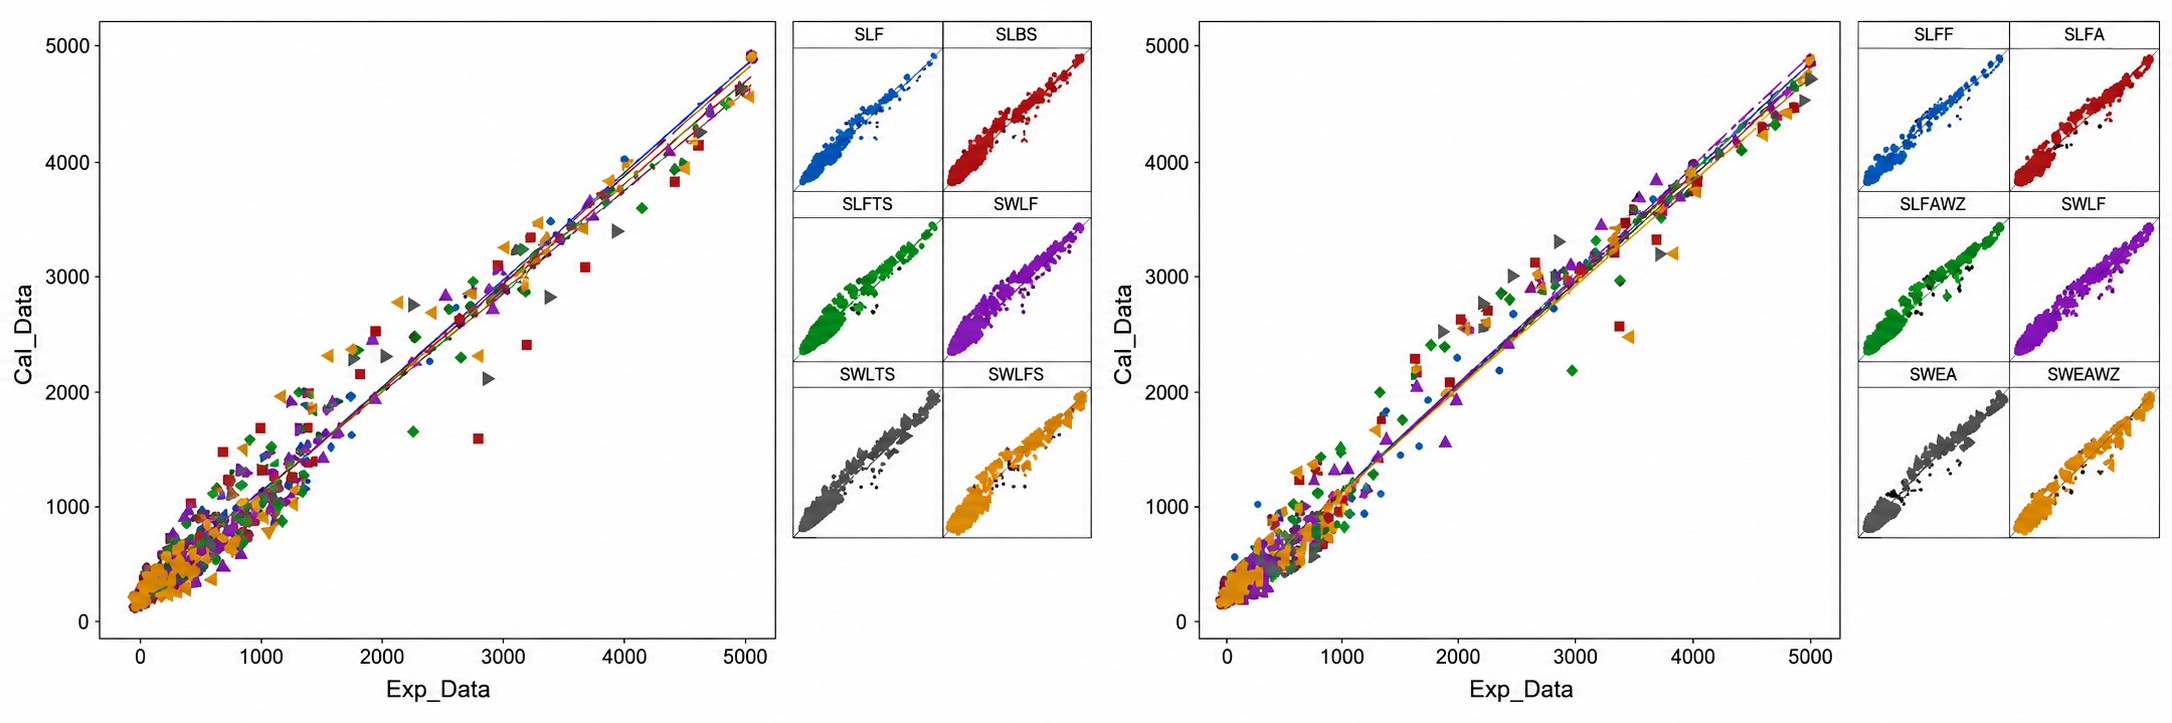
Figure 15 compares the predicted concentrations obtained with the parameters of Table 1 against the complete experimental dataset at 40 and 50 °C. The parity plots show that points cluster closely around the identity line at both temperatures, confirming that the simplified kinetic model captures the global behavior of the system within the expected experimental dispersion.

Parity plots comparing experimental concentrations (Exp_Data) and model predictions (Cal_Data) for the kinetic model without explicit mass-transfer terms at 40 °C (left) and 50 °C (right). Colours denote the different reaction systems, and the solid line represents perfect agreement. Insets show the corresponding parity plots for each individual system.
At concentrations above ~350 g·L−1, the dispersion increases slightly, most notably for GOS, because small absolute deviations become more visible in regions where the transgalactosylation and re-hydrolysis rates exhibit steep local variations. The individual insets in Figure 15 reveal that the quality of the fit is not perfectly uniform across systems: the free-enzyme datasets display nearly symmetric scatter around the identity line, whereas immobilized systems, especially SL+EIA and SL+EIAWZ at 50 °C, show a tendency to underestimate high experimental concentrations. This systematic behavior aligns with the delayed and flattened GOS maxima experimentally observed in these systems, suggesting that the lumped kinetic parameters partially absorb mass-transfer limitations that are not explicitly represented in the model.
Despite these differences, the plots do not exhibit curvature, slope deviation or systematic segregation by species, which indicates that the apparent kinetic scheme is structurally adequate and that a single parameter set per system can describe all species simultaneously. The good agreement confirms that mass-transfer and inactivation effects, although relevant, are sufficiently smooth to be captured implicitly by the correlated parameters.
3.2.2 Kinetic parameters correlation including mass transfer resistance
Table 2 summarizes the parameters obtained when the kinetic model is extended to include the apparent mass-transfer terms and for the free enzyme in lactose (SL) and whey (SW) media at 40 and 50 °C. In Table 2, Kᶜa1 and Kᶜa2 correspond to the apparent volumetric mass-transfer coefficients estimated for two of the three enzyme-to-substrate ratios per condition (R = 1.00 and R = 1.25, respectively); the kinetic constants k1-k5 are treated as shared parameters across those experimental profiles. These coefficients represent effective lactose transport from the bulk liquid to the catalytic region and complement the intrinsic kinetic constants . All fits yield coefficients of determination , indicating that the extended model continues to reproduce the main features of lactose consumption, monosaccharide formation, and GOS accumulation; notably, the overall R2 values are comparable to, and in some cases marginally lower than, those of the purely kinetic model (Table 1), which reflects the reduced degrees of freedom per experimental profile rather than a degradation of predictive quality.
Apparent kinetic and mass-transfer parameters for free β-galactosidase in lactose (SL) and whey (SW) media at 40 and 50 °C. Units: k1, k3, k4, k5 in L·g−1·min−1; k2 in min−1; Kᶜa in min−1.
The fitted values of and are, with one exception, extremely large, on the order of 1018-1019min−1. The sole outlier is Kᶜa1 for SL at 40 °C (4.63 × 10⁴min−1); even this value is many orders of magnitude above any physically realizable external mass-transfer coefficient in a stirred reactor, so the conclusion of negligible external resistance holds for all free-enzyme conditions studied. In the mathematical limit Kᶜa → ∞, the transport equation reduces to the same form as the purely kinetic model, so the two formulations become algebraically equivalent. Therefore, the joint estimation of k1-k5 and Kᶜa is ill-conditioned when Kᶜa is very large: many different combinations of these parameters produce predictions of equivalent quality, explaining why the k1-k5 values in Table 2 differ substantially from those in Table 1 for the same free-enzyme system. The physically meaningful result from Table 2 is therefore exclusively the order of magnitude of Kᶜa, confirming negligible external resistance; quantitative interpretation of the kinetic constants should rely on Table 1. For a given temperature, the kinetic constants in whey, particularly k4 and k5, governing GOS formation and re-hydrolysis, tend to be smaller than their counterparts in pure lactose solution. This trend is consistent with the experimentally observed lower GOS maxima in whey and with the inhibitory and matrix-related accessibility effects attributed to whey components such as proteins, residual sugars, and dissolved salts.
The comparison between 40 and 50 °C also shows that the fitted parameters do not follow a uniform temperature-driven increase. Instead, they reflect the combined influence of temperature on intrinsic enzyme activity and on transport properties such as diffusion coefficients and viscosity. This behavior is consistent with the experimental evidence that the free enzyme experiences partial thermal loss of activity near 50 °C, while mass-transfer effects become less restrictive at higher temperature.
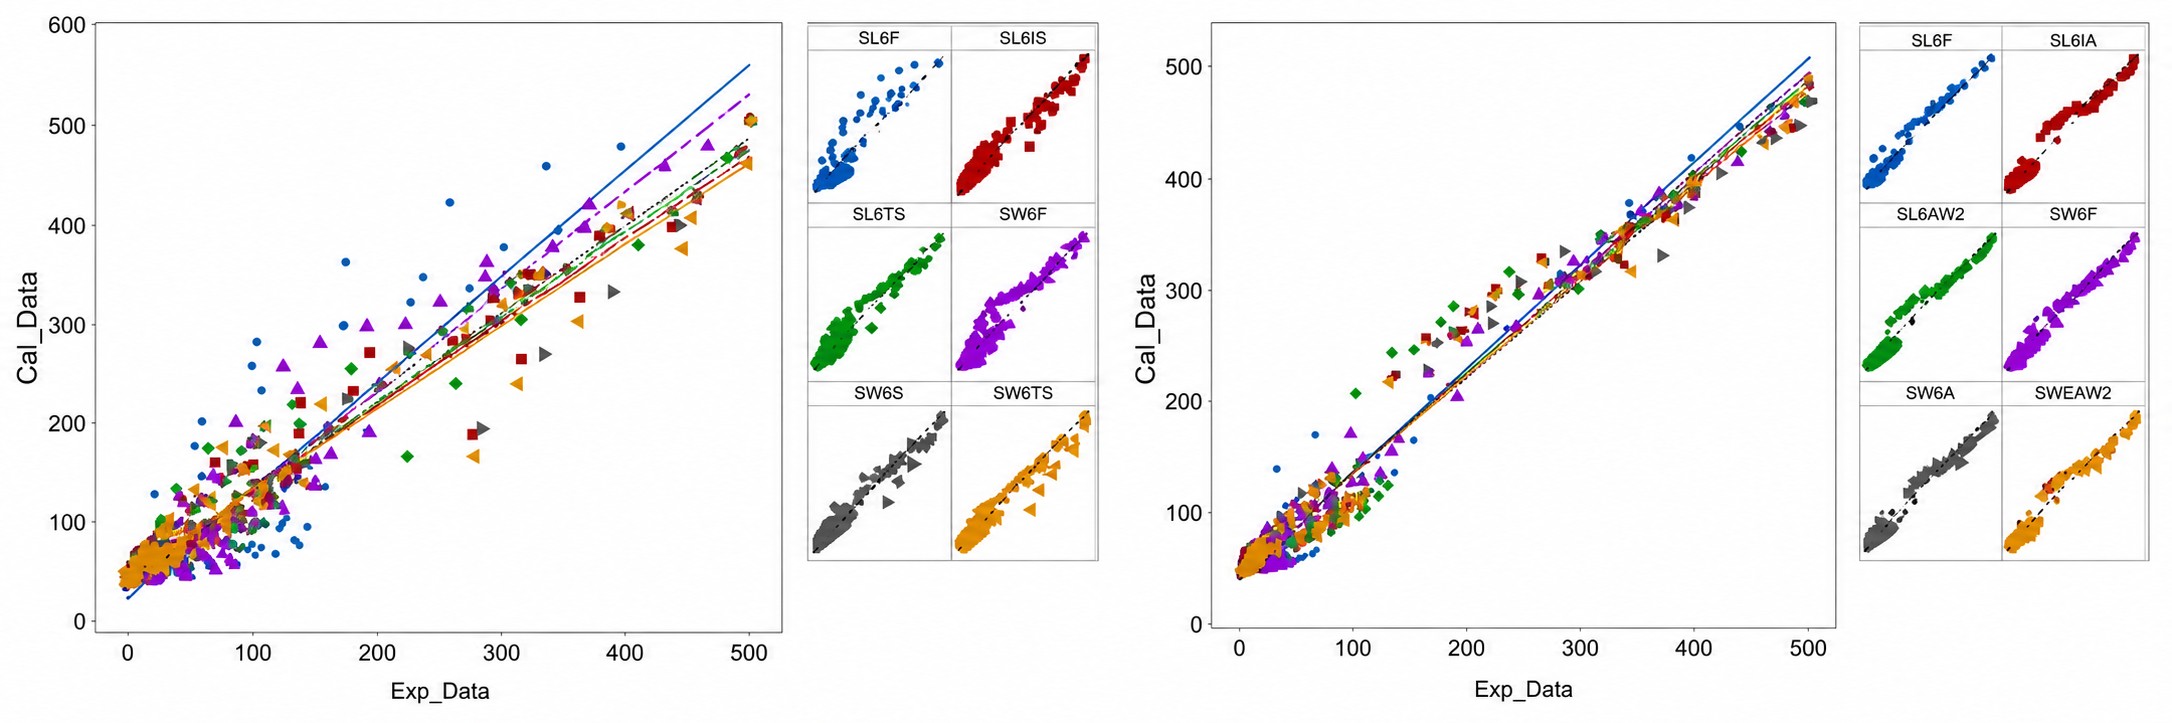
Figure 16 presents parity plots for the complete data set at both temperatures. The points cluster closely around the identity line, confirming that the model with mass-transfer terms provides a satisfactory global representation of the experimental concentrations. Compared with the purely kinetic model (Figure 15), the inclusion of and provides a physically interpretable account of the transport regime; for whey-based systems in particular, the structured parameterization prevents medium-related diffusional effects from being absorbed into the apparent kinetic constants. The insets show that SL at 40 °C exhibits the largest dispersion, consistent with the variability observed experimentally in the GOS region, while SW systems display more compact behavior and benefit the most from the addition of transport terms. No consistent under- or over-prediction is observed across systems.

Parity plots comparing experimental concentrations (Exp_Data) and model predictions (Cal_Data) for the kinetic model including mass-transfer terms at 40 °C (left) and 50 °C (right). Colours denote the different reaction systems, and the solid line represents perfect agreement. Insets show the corresponding parity plots for each individual system.
Although the global values obtained with and without mass-transfer terms are similar, the extended formulation has a practical advantage: a single set of kinetic parameters per medium and temperature, supplemented by the mass-transfer coefficients, is sufficient to represent all conditions for the free enzyme. In contrast, the purely kinetic model of Section 3.2.1 requires system-specific parameter sets, so the present approach captures medium effects more compactly while maintaining a comparable quality of fit. The principal benefit of including transport terms is not a systematic improvement in R2 but rather a physically interpretable account of the transport regime: for whey-based experiments, the explicit representation of transport terms prevents transport-related effects from being absorbed into the kinetic constants as an artefact of fitting; free-enzyme runs recover Kᶜa values in the range 1018-1019 min−1, confirming negligible external resistance for soluble enzyme in a well-stirred system, which is physically expected. The largest relative deviations are observed for galactose and, especially, for GOS, in the regions where transgalactosylation and re-hydrolysis rates change most steeply.
4 Conclusions
This study examined how reaction medium, biocatalyst configuration, and mass-transfer phenomena collectively shape galactooligosaccharide (GOS) synthesis with β-galactosidase from K. lactis. A mechanistic model, tested with and without explicit transport terms, was applied across temperatures, substrates, and immobilization supports. The results are clear: intrinsic enzyme kinetics and external transport resistance act in concert to determine GOS productivity, and models that omit transport phenomena give an incomplete picture of the system.
On the experimental side, replacing pure lactose solutions with whey generally slowed lactose conversion and modified the balance between hydrolysis and transgalactosylation. This behavior is consistent with the more complex composition of the whey matrix, where proteins, minerals, and residual lipids may reduce the effective accessibility of lactose to the enzyme. In immobilized preparations, the apparent external mass-transfer resistance at the biocatalyst-fluid interface further limited lactose availability at the catalytic microenvironment, with the strongest transport constraints observed for the alginate-based supports. Among the immobilized configurations evaluated, treated silica (EITS) provided the most favorable performance, combining the highest retained activity with comparatively lower external transport resistance and yielding the highest GOS concentration measured in this study. In contrast, alginate beads, particularly those containing zeolitic material, showed stronger external mass-transfer limitations and lower GOS accumulation under the evaluated conditions.
From the modeling side, the purely kinetic scheme already captures the main trends in all concentration profiles reasonably well. For free-enzyme systems, the transport parameterization provides an internal consistency check, near-infinite Kᶜa values confirm negligible external resistance, and a physically transparent structure that can be extended to immobilized configurations where finite Kᶜa values carry direct physical meaning. For whey-based systems, explicitly including transport terms prevents diffusional effects from being absorbed into the kinetic constants as fitting artefacts. Beyond the comparable quality of fit, the extended model carries a practical structural advantage for the free-enzyme datasets: a single parameter set per medium and temperature, supplemented by mass-transfer coefficients, can represent the corresponding concentration profiles with comparable quality to the purely kinetic formulation. For immobilized systems, experimental trends indicate that support-dependent external transport resistance must be considered explicitly when interpreting apparent kinetic parameters.
The results show that mass-transfer phenomena are not a secondary correction in GOS synthesis but an active determinant of both the reaction rate and the product distribution throughout the reaction. Notably, medium composition, whether pure lactose or whey, emerged as the primary factor modulating external mass-transfer behavior, consistently amplifying diffusional resistance across all biocatalyst configurations tested, with whey introducing additional transport barriers beyond those attributable to the support structure alone. The combined kinetic-transport formulation provides a mechanistic basis for interpreting how reaction kinetics and external transport may interact in GOS synthesis. In the present work, the explicit mass-transfer parameterization was demonstrated for the free-enzyme datasets, where the recovered near-infinite values correctly indicate a transport-transparent regime. For immobilized systems, the experimental trends and apparent kinetic parameters indicate support-dependent transport limitations, although direct quantification of finite values for each support should be addressed in future work.
Acknowledgements
The authors gratefully acknowledge the support of the Departamento de Ingeniería Química y Ambiental, Universidad Nacional de Colombia, and Colciencias (Convocatorias 528 and 567 for doctoral research support in Colombia). The authors also thank the Vicerrectoría de Investigación y Transferencia Tecnológica, Universidad de La Salle, for additional support.
Data Availability Statement
The data supporting the findings of this study are available upon reasonable request from the corresponding author.
-
Cite as:
Téllez, S., Guio, F., Noriega Valencia, M. A., Serrato, J., Rojas, O. E., & Castro, G. (2026). Kinetic and mass-transfer modeling of galactooligosaccharide production with free and immobilized β-galactosidase from Kluyveromyces lactis. Brazilian Journal of Food Technology, 29, e2025145. https://doi.org/10.1590/1981-6723.1452025
-
Funding:
Ministerio de Ciencia y Tecnología de Colombia (Convocatoria 528 and 567 para apoyo a proyectos).
References
-
Argenta, A. B., Nogueira, A., & Scheer, A. (2021). Hydrolysis of whey lactose: Kluyveromyces lactis β-galactosidase immobilisation and integrated process hydrolysis-ultrafiltration. International Dairy Journal, 117, 105007. https://doi.org/10.1016/j.idairyj.2021.105007
» https://doi.org/10.1016/j.idairyj.2021.105007 -
Callender, R., & Dyer, R. B. (2015). The dynamical nature of enzymatic catalysis. Accounts of Chemical Research, 48(2), 407-413. PMid:25539144. https://doi.org/10.1021/ar5002928
» https://doi.org/10.1021/ar5002928 -
Chen, C. W., Ou-Yang, C.-C., & Yeh, C.-W. (2003). Synthesis of galactooligosaccharides and transgalactosylation modeling in reverse micelles. Enzyme and Microbial Technology, 33(4), 497-507. https://doi.org/10.1016/S0141-0229(03)00155-8
» https://doi.org/10.1016/S0141-0229(03)00155-8 -
Deshmukh, N., Rao, P. S., Sharma, H., Sathish Kumar, M.H., Laxmana Naik, N., & Manoj Kumar, C.T. (2024). Waste to nutrition: The evolution of whey, a byproduct to galactooligosaccharides production. Food Chemistry Advances, 4, 100642. https://doi.org/10.1016/j.focha.2024.100642
» https://doi.org/10.1016/j.focha.2024.100642 -
Dunnill, P. (1979). Immobilized enzymes: Research and development. Biochemical Education, 7(3), 73. https://doi.org/10.1016/0307-4412(79)90055-4
» https://doi.org/10.1016/0307-4412(79)90055-4 -
Fisher, H. F. (2005). Transient-state kinetic approach to mechanisms of enzymatic catalysis. Accounts of Chemical Research, 38(3), 157-166. PMid:15766234. https://doi.org/10.1021/ar040218g
» https://doi.org/10.1021/ar040218g -
Frenzel, M., Zerge, K., Clawin-Rädecker, I., & Lorenzen, P. (2015). Comparison of the galacto-oligosaccharide forming activity of different β-galactosidases. Lebensmittel-Wissenschaft + Technologie, 60(2), 1068-1071. https://doi.org/10.1016/j.lwt.2014.10.064
» https://doi.org/10.1016/j.lwt.2014.10.064 -
Giordano, R. C., & Camargo Giordano, R. L. (2006). Taylor-Couette vortex flow in enzymatic reactors. In J. M. Guisan (Ed.), Immobilization of enzymes and cells. New York: Humana Press. https://doi.org/10.1007/978-1-59745-053-9_28
» https://doi.org/10.1007/978-1-59745-053-9_28 -
González-Delgado, I., López-Muñoz, M.-J., Morales, G., & Segura, Y. (2016). Optimisation of the synthesis of high galacto-oligosaccharides (GOS) from lactose with β-galactosidase from Kluyveromyces lactis. International Dairy Journal, 61, 211-219. https://doi.org/10.1016/j.idairyj.2016.06.007
» https://doi.org/10.1016/j.idairyj.2016.06.007 -
Gosling, A., Stevens, G. W., Barber, A. R., Kentish, S. E., & Gras, S. L. (2010). Recent advances refining galactooligosaccharide production from lactose. Food Chemistry, 121(2), 307-318. https://doi.org/10.1016/j.foodchem.2009.12.063
» https://doi.org/10.1016/j.foodchem.2009.12.063 -
Jovanovic-Malinovska, R., Fernandes, P., Winkelhausen, E., & Fonseca, L. (2012). Galacto-oligosaccharides synthesis from lactose and whey by β-galactosidase immobilized in PVA. Applied Biochemistry and Biotechnology, 168(5), 1197-1211. PMid:22941309. https://doi.org/10.1007/s12010-012-9850-1
» https://doi.org/10.1007/s12010-012-9850-1 -
Kim, C. S., Ji, E.-S., & Oh, D.-K. (2004). A new kinetic model of recombinant β-galactosidase from Kluyveromyces lactis for both hydrolysis and transgalactosylation reactions. Biochemical and Biophysical Research Communications, 316(3), 738-743. PMid:15033461. https://doi.org/10.1016/j.bbrc.2004.02.118
» https://doi.org/10.1016/j.bbrc.2004.02.118 -
Kim, S., Jeong, C., Cho, S., & Kim, S.-B. (2019). Effects of thermal treatment on the physical properties of edible calcium alginate gel beads: Response surface methodological approach. Foods, 8(11), 578. PMid:31731744. https://doi.org/10.3390/foods8110578
» https://doi.org/10.3390/foods8110578 -
Liburdi, K., & Esti, M. (2022). Galacto-oligosaccharide (GOS) Synthesis during enzymatic lactose-free milk production: State of the art and emerging opportunities. Beverages, 8(2), 21. https://doi.org/10.3390/beverages8020021
» https://doi.org/10.3390/beverages8020021 -
Mariotti, M. P., Yamanaka, H., Araujo, A. R., & Trevisan, H. C. (2008). Hydrolysis of whey lactose by immobilized β-galactosidase. Brazilian Archives of Biology and Technology, 51(6), 1233-1240. https://doi.org/10.1590/S1516-89132008000600019
» https://doi.org/10.1590/S1516-89132008000600019 -
Noriega, M. A., Narváez, P. C., Cadavid, J. G., & Habert, A. C. (2017). Modeling of biodiesel production in Liquid-Liquid Film Reactors including mass transfer effects. Fuel Processing Technology, 167, 524-534. https://doi.org/10.1016/j.fuproc.2017.08.008
» https://doi.org/10.1016/j.fuproc.2017.08.008 -
Punekar, N. S. (2025). Enzymes: Catalysis, kinetics and mechanisms. Singapore: Springer Nature. https://doi.org/10.1007/978-981-97-8179-9
» https://doi.org/10.1007/978-981-97-8179-9 - Rico Rodríguez, F. (2018). Evaluación de un sistema mixto de enzimas para la producción de galactooligosacáridos y ácido glucónico a partir de lactosuero como fuente de lactosa. Bogota: Universidad Nacional de Colombia.
-
Rodríguez, Á. P., Leiro, R. F., Trillo, M. C., Cerdán, M. E., Siso, M. I. G., & Becerra, M. (2006). Secretion and properties of a hybrid Kluyveromyces lactis-Aspergillus niger β-galactosidase. Microbial Cell Factories, 5(1), 41. PMid:17176477. https://doi.org/10.1186/1475-2859-5-41
» https://doi.org/10.1186/1475-2859-5-41 -
Sangwan, V., Tomar, S. K., Singh, R. R. B., Singh, A. K., & Ali, B. (2011). Galactooligosaccharides: Novel components of designer foods. Journal of Food Science, 76(4), R103-R111. PMid:22417365. https://doi.org/10.1111/j.1750-3841.2011.02131.x
» https://doi.org/10.1111/j.1750-3841.2011.02131.x -
Scott, F., Vera, C., & Conejeros, R. (2016). Technical and economic analysis of industrial production of lactose-derived prebiotics with focus on galacto-oligosaccharides. In A. Illanes, C. Guerrero, C. Vera, L. Wilson, R. Conejeros & F. Scott (Eds.), Lactose-derived prebiotics: A process perspective (pp. 261-284). London: Elsevier. https://doi.org/10.1016/B978-0-12-802724-0.00007-X
» https://doi.org/10.1016/B978-0-12-802724-0.00007-X -
Sheu, D.-C., Li, S.-Y., Duan, K.-J., & Chen, C. W. (1998). Production of galactooligosaccharides by β-galactosidase immobilized on glutaraldehyde-treated chitosan beads. Biotechnology Techniques, 12(4), 273-276. https://doi.org/10.1023/A:1008894029377
» https://doi.org/10.1023/A:1008894029377 -
Singla, V., & Chakkaravarthi, S. (2017). Applications of prebiotics in food industry: A review. Food Science and Technology International = Ciencia y Tecnología de los Alimentos Internacional, 23(8), 649-667. PMid:28762780. https://doi.org/10.1177/1082013217721769
» https://doi.org/10.1177/1082013217721769 -
Vera, C., Guerrero, C., & Illanes, A. (2011). Determination of the transgalactosylation activity of Aspergillus oryzae β-galactosidase: Effect of pH, temperature, and galactose and glucose concentrations. Carbohydrate Research, 346(6), 745-752. PMid:21439558. https://doi.org/10.1016/j.carres.2011.01.030
» https://doi.org/10.1016/j.carres.2011.01.030 -
Warmerdam, A., Boom, R. M., & Janssen, A. E. M. (2013). β-galactosidase stability at high substrate concentrations. SpringerPlus, 2(1), 402. PMid:24024090. https://doi.org/10.1186/2193-1801-2-402
» https://doi.org/10.1186/2193-1801-2-402 -
Wolf, D. (2004). Basic principles in applied catalysis (Vol. 75). Berlin: Springer. https://doi.org/10.1007/978-3-662-05981-4_13
» https://doi.org/10.1007/978-3-662-05981-4_13
Edited by
-
Associate Editor:
Wagner Augusto Müller.