
Abstract
Urban centers radically alter hydrological cycles, causing unintended consequences for the environment, such as the creation of extensive contamination plumes in unconfined aquifers. The Environmental Agency of the State of São Paulo has observed this issue since 1994. Therefore, this study aimed to create a method using nitrate as an indicator of contamination that permits an assertive interpretation of changes in the groundwater quality in monitoring wells of regional networks. The method was applied in ten cities with monitoring wells in the Bauru Aquifer System. The results correlated the presence of nitrate with the time and dynamics of land use in the capture zones of the wells over 54 years (1962-2016). In areas with sewer networks installed before 2001 and urban occupation greater than 60% of urban occupation in the capture zones, there was an increase in nitrate concentration of at least 35%. Likewise, extending this new method to other wells will make it possible to identify the causes of nitrate and other contaminants in the groundwater-monitoring network in the State of São Paulo.
KEYWORDS:
groundwater; nitrate; aquifer monitoring network; land use and occupation; urban planning
INTRODUCTION
Cities have radically altered the flow of water, energy, and matter from river basins. Waterproofing the land increases rain interception and runoff and reduces aquifer recharge. Similarly, cities modify the heat flow and, consequently, water evaporation processes and rain patterns. Equally important, various urban activities transfer immense amounts of matter from the atmosphere (Babinski et al. 2003Babinski M., Aily C., Ruiz I.R., Sato K. 2003. Pb isotopic signatures of the atmosphere of the São Paulo city, Brazil. Journal de Physique, 107:87-90. https://doi.org/10.1051/jp4:20030250
https://doi.org/https://doi.org/10.1051/...
, 2012Babinski M., Gioia S.M.L., Aily C., Pimentel M., Ruiz I.R., Kerr A. 2012. Aplicação da geoquímica isotópica do Pb na caracterização das fontes poluentes na atmosfera: Exemplos das cidades de São Paulo e Brasília. In: Figueiredo B.R., De Capitani E.M., Dos Anjos J.Â.S.A., Luiz-Silva W. (Eds.). Chumbo, ambiente e saúde: o desafio do controle da exposição humana. São Paulo: Annablume, p. 185-213.) and from the surface to the soil (CETESB 2013Companhia Ambiental do Estado de São Paulo (CETESB). 2013. Qualidade das águas subterrâneas do Estado de São Paulo 2010-2012. São Paulo: Série de Relatórios/Secretaria de Estado do Meio Ambiente, 242 p. Relatório técnico., Santos Filho et al. 2017Santos Filho M., Hirata R., Luiz M.B., Conicelli B. 2017. Solo e águas subterrâneas contaminadas pela deposição de resíduos sólidos urbanos: o caso do Vazadouro de Tatuí (SP). Revista do Instituto Geológico, 38(1):31-47. https://doi.org/10.5935/0100-929X.20170003
https://doi.org/https://doi.org/10.5935/...
, Aranda et al. 2019Aranda N., Prado R., Elis V., Miguel M., Gandolfo O., Conicelli B. 2019. Evaluating elastic wave velocities in Brazilian municipal solid waste. Environmental Earth Sciences, 78:475. https://doi.org/10.1007/s12665-019-8490-y
https://doi.org/https://doi.org/10.1007/...
), rivers (Porto 2003Porto M. 2003. Recursos Hídricos e Saneamento na Região Metropolitana de São Paulo. Brasília: Banco Mundial, 73. v. 1., Xu et al. 2019Xu Z., Xu J., Yin H.J.W., Jin W., Li H., He Z. 2019. Urban river pollution control in developing countries. Nature Sustain, 2:158-160. https://doi.org/10.1038/s41893-019-0249-7
https://doi.org/https://doi.org/10.1038/...
), and aquifers (Foster and Hirata 1988Foster S., Hirata R. 1988. Groundwater pollution risk assessment: a methodology using available data. Lima: WHO-PAHO-HPE CEPIS. Technical Manual., DAEE 2012Departamento de Águas e Energia Elétrica (DAEE). 2012. Projeto Jurubatuba: restrição e controle de uso de água subterrânea. In: Departamento de Águas e Energia Elétrica, Instituto Geológico, Secretaria de Estado do Meio Ambiente, Secretaria de Estado de Saneamento e Energia. In: Cadernos do Projeto Estratégico Aquíferos. São Paulo: Secretaria de Estado de Saneamento e Energia, 109 p., Cary et al. 2013Cary L., Petelet-Giraud E., Montenegro S., Hirata R., Martins V., Aurouet A., Pauwels H., Kloppmann W., Aquilina L. 2013. Groundwater Salinization in a Coastal Multilayer Aquifer: Preliminary Results on Origins and Mechanisms- Example of Recife (Brazil). Procedia Earth and Planetary Science, 7:118-122. https://doi.org/10.1016/j.proeps.2013.03.164
https://doi.org/https://doi.org/10.1016/...
, Conicelli 2014Conicelli B. 2014. Gestão das águas subterrâneas na Bacia Hidrográfica do Alto Tietê (SP). Thesis, Instituto de Geociências, Universidade de São Paulo, São Paulo. https://doi.org/10.11606/T.44.2014.tde-09102014-140000
https://doi.org/https://doi.org/10.11606...
, Bertolo et al. 2015Bertolo R., Hirata R., Conicelli B., Simonato M., Pinhatti A., Fernandes A. 2015. Água subterrânea para abastecimento público na Região Metropolitana de São Paulo: é possível utilizá-la em larga escala? Revista DAE, 63:6-17. https://doi.org/10.4322/dae.2014.148
https://doi.org/https://doi.org/10.4322/...
, Hirata et al. 2015Hirata R., Foster S., Oliveira F. 2015. Águas subterrâneas urbanas: avaliação para uma gestão sustentável [Urban groundwater: evaluation for sustainable management]. São Paulo: Instituto de Geociências / FAPESP, 112 p. v. 1., Petelet-Giraud et al. 2018Petelet-Giraud E., Cary L., Cary P., Bertrand G., Giglio-Jacquemot A., Hirata R., Aquilina L., Alves L., Martins V., Melo A., Montenegro S., Chatton E., Franzen M., Aurouet A. 2018. Multi-layered water resources, management, and uses under the impacts of Global Changes in a Southern Coastal Metropolis: when will it be already too late? Crossed analysis in Recife, NE Brazil. Environmental Science and Policy, 618:645-657. https://doi.org/10.1016/j.scitotenv.2017.07.228
https://doi.org/https://doi.org/10.1016/...
), sometimes contaminating them. In this urban cycle of water, energy, and matter, one of the rarely researched components is the aquifer (Foster et al. 2011Foster S., Hirata R., Howard K. 2011. Groundwater use in developing cities - Policy issues arising from current trends. Hydrogeology Journal, 19:271-274., Hibbs and Sharp 2012Hibbs B.J., Sharp J.M. Jr. 2012. Hydrogeological effects of urbanization. Environmental and Engineering Geoscience, 18(1):3-24, Hirata and Suhogusoff 2019Hirata R., Suhogusoff A.V. 2019. How much do we know about the groundwater quality and its impact on Brazilian society today? Acta Limnologica Brasiliensia, 31:e109. https://doi.org/10.1590/s2179-975x4419
https://doi.org/https://doi.org/10.1590/...
), even in countries in Europe and North America.
In Brazil, in recent decades, cities have faced problems related to drastic increases in the concentration of pollutants in aquifers, including nitrate (Hirata and Suhogusoff 2019Hirata R., Suhogusoff A.V. 2019. How much do we know about the groundwater quality and its impact on Brazilian society today? Acta Limnologica Brasiliensia, 31:e109. https://doi.org/10.1590/s2179-975x4419
https://doi.org/https://doi.org/10.1590/...
, Varnier et al. 2019Varnier C., Rocha G.A., Campos J.E., Albuquerque Filho J.L., Simonato M., Hirata R. 2019. Nitrato nas águas subterrâneas: desafios frente ao panorama atual. São Paulo: SIMA/IG, 99 p. v. 1.). The origins of this contaminant in aquifers are associated with poor agricultural practices, including over-application of inorganic fertilizers, infiltration of sewers in urban areas, and extensive industrial activities (Foster et al. 2006Foster S., Hirata R., Gomes D., Délia M., Paris M. 2006. Proteção da qualidade da água subterrânea: um guia para empresas de abastecimento de água, órgãos municipais e agências ambientais. Washington, D.C.: Banco Mundial., Reynolds-Vargas et al. 2006Reynolds-Vargas J., Fraile-Merino J., Hirata R. 2006. Trends in nitrate concentrations and determination of their origin using stable isotopes (18O and 15N) in groundwater of the Western Central Valley, Costa Rica. Journal of the Human Environment, 35(5):229-236., He and Wu 2019He S., Wu J. 2019. Hydrogeochemical Characteristics, Groundwater Quality, and Health Risks from Hexavalent Chromium and Nitrate in Groundwater of Huanhe Formation in Wuqi County, Northwest China. Exposure and Health, 11:125-137. https://doi.org/10.1007/s12403-018-0289-7
https://doi.org/https://doi.org/10.1007/...
, Wu et al. 2020Wu J., Li P., Wang D., Ren X., Wei M. 2020. Statistical and multivariate statistical techniques to trace the sources and affecting factors of groundwater pollution in a rapidly growing city on the Chinese Loess Plateau. Human and Ecological Risk Assessment, 26(6):1603-1621. https://doi.org/10.1080/10807039.2019.1594156
https://doi.org/https://doi.org/10.1080/...
). Despite the numerous cases of nitrate described in the State of São Paulo, as in Marília (Varnier et al. 2010Varnier C., Iritani M.A., Viotti M., Oda G.H., Ferreira L.M.R. 2010. Nitrato nas águas subterrâneas do Sistema Aquífero Bauru, área urbana do município de Marília (SP). Revista do Instituto Geológico, São Paulo, 31(1-2):1-21. https://doi.org/10.5935/0100-929X.20100001
https://doi.org/https://doi.org/10.5935/...
), São José do Rio Preto (Barcha 1980Barcha S.F. 1980. Aspectos gemológicos e províncias hidrogeológicas da Formação Bauru na região norte-ocidental do Estado de São Paulo. São José do Rio Preto: Universidade Estadual Paulista “Júlio de Mesquita Filho”, 209 p.), and Bauru (Hirata 2000Hirata R. 2000. Estudo da contaminação por nitrato no Distrito de Tibiriça, Bauru. São Paulo: Departamento de Água, Energia e Esgoto. Instituto de Geociências, Universidade de São Paulo., Giafferis and Oliveira 2006Giafferis G., Oliveira E. 2006. Investigação da qualidade de águas subterrâneas no município de Bauru. In: Congresso Brasileiro de Águas Subterrâneas, 14., 2006, Curitiba. Annals... Curitiba: ABAS. (CD-ROM).), this problem remains underestimated by public authorities and even more by groundwater users (Varnier et al. 2019Varnier C., Rocha G.A., Campos J.E., Albuquerque Filho J.L., Simonato M., Hirata R. 2019. Nitrato nas águas subterrâneas: desafios frente ao panorama atual. São Paulo: SIMA/IG, 99 p. v. 1.). This issue has been systematically documented in the Environmental Sanitation Technology Company (CETESB) triennial reports - Quality of Groundwater in the State of São Paulo. Nevertheless, no studies have explained the causes behind the increase of nitrate concentrations in the monitoring network over time; and reports have only attempted to describe the problem.
The best way to reduce the nitrate contamination risk in urban aquifers is to construct sewer networks, whose service reaches more than 38 million of the São Paulo population (88.4%) (SNIS 2017Sistema Nacional de Informações sobre Saneamento (SNIS). 2017. Diagnóstico dos Serviços de Água e Esgotos - 2015. 21ª ed. Brasília: Secretaria Nacional de Saneamento Ambiental, 212 p.). However, leaks from the sewer mains are responsible for extensive contamination in unconfined aquifers (Hirata et al. 2015Hirata R., Foster S., Oliveira F. 2015. Águas subterrâneas urbanas: avaliação para uma gestão sustentável [Urban groundwater: evaluation for sustainable management]. São Paulo: Instituto de Geociências / FAPESP, 112 p. v. 1., Hirata and Suhogusoff 2019Hirata R., Suhogusoff A.V. 2019. How much do we know about the groundwater quality and its impact on Brazilian society today? Acta Limnologica Brasiliensia, 31:e109. https://doi.org/10.1590/s2179-975x4419
https://doi.org/https://doi.org/10.1590/...
, Varnier et al. 2019Varnier C., Rocha G.A., Campos J.E., Albuquerque Filho J.L., Simonato M., Hirata R. 2019. Nitrato nas águas subterrâneas: desafios frente ao panorama atual. São Paulo: SIMA/IG, 99 p. v. 1.), which is worrisome, especially when 80% of the state cities state have total or partial public water supply from groundwater, in addition to the existence of hundreds of thousands of private tubular wells that are extensively used.
The presence of nitrate in a specific well, which extracts water from an unconfined aquifer, is a function of contamination sources in its nearby recharge area (Drake and Bauder 2005Drake V.M., Bauder J.W. 2005. Groundwater nitrate-nitrogen trends in relation to urban development, Helena Montana, 1971-2003. Groundwater Monitoring and Remediation, 25(2):118-130. https://doi.org/10.1111/j.1745-6592.2005.0017.x
https://doi.org/https://doi.org/10.1111/...
, Reynolds-Vargas et al. 2006Reynolds-Vargas J., Fraile-Merino J., Hirata R. 2006. Trends in nitrate concentrations and determination of their origin using stable isotopes (18O and 15N) in groundwater of the Western Central Valley, Costa Rica. Journal of the Human Environment, 35(5):229-236., Xu et al. 2007Xu Y., Baker L.A., Johnson P.C. 2007. Trends in groundwater nitrate contamination in the Phoenix, Arizona Region. Groundwater Monitoring and Remediation, 27(2):49-56. https://doi.org/10.1111/j.1745-6592.2007.00135.x
https://doi.org/https://doi.org/10.1111/...
). These studies maintain that higher nitrate concentrations are associated with sites whose sewage collection network is old, poorly maintained and leaks or contains cesspools and septic tanks to drain domestic effluents (Hirata et al. 2015Hirata R., Foster S., Oliveira F. 2015. Águas subterrâneas urbanas: avaliação para uma gestão sustentável [Urban groundwater: evaluation for sustainable management]. São Paulo: Instituto de Geociências / FAPESP, 112 p. v. 1.).
An additional problem related to regional monitoring networks, such as those operated by CETESB, is their low assertiveness levels. Monitoring wells can only assess what is happening in their immediate area (Foster and Gomes 1989Foster S., Gomes D.C. 1989. Monitoreo de la calidad de las aguas subterráneas: una evaluación de métodos y costos. Lima: WHO-PAHO/HPE-CEPIS, 111 p. Technical Manual.), not exceeding a few hundred meters. Also, São Paulo network uses tubular production wells, usually with long screen intervals, which cause a mixture of waters of varying ages and chemical compositions. Generally, deeper levels with clean waters mask shallower portions of the heavily contaminated aquifer.
Therefore, this paper aimed to create a methodology that generates more assertive results obtained by a regional monitoring network, allowing the establishment of a relation between land occupation and deterioration of the quality of aquifers caused by urban sources, using nitrate as a chemical indicator.
STUDY AREA
The geological framework of the State of São Paulo allows the aquifers to be divided into two groups: those of primary porosity, represented by sedimentary aquifers (Furnas, Itararé, Aquidauana, Passa Dois, Botucatu, Piramboia, Santo Anastácio, Caiuá, Marília, Adamantina, São Paulo, Litorâneo, and Taubaté) and undifferentiated cenozoic coverings; and secondary porosity aquifers, represented by the fractured Serra Geral and Cristalino (DAEE 2005Departamento de Águas e Energia Elétrica (DAEE). 2005. Mapa de águas subterrâneas do estado de São Paulo. 119 p. +1 mapa +1CD. Escala 1:1.000.000. São Paulo: Departamento de Águas e Energia Elétrica.). These aquifers are aggregated into aquifer systems, namely Cenozoic, Bauru, Serra Geral, Guarani, Aquitarde Passa Dois, Tubarão, Paraná, and Cristalino (Carvalho and Hirata 2012Carvalho A.M., Hirata R. 2012. Avaliação para a proteção dos poços de abastecimento público do Estado de São Paulo. Geologia USP. Série Científica, 12(1):5-70. https://doi.org/10.5327/Z1519-874X2012000100005
https://doi.org/https://doi.org/10.5327/...
).
The Bauru Aquifer System (BAS), which is the focus of this study, occupies around the Western half of the State of São Paulo, with an area of 96,880 km2, as in Fig. 1 (Varnier et al. 2010Varnier C., Iritani M.A., Viotti M., Oda G.H., Ferreira L.M.R. 2010. Nitrato nas águas subterrâneas do Sistema Aquífero Bauru, área urbana do município de Marília (SP). Revista do Instituto Geológico, São Paulo, 31(1-2):1-21. https://doi.org/10.5935/0100-929X.20100001
https://doi.org/https://doi.org/10.5935/...
). It consists of the Bauru Groups rocks, whose continental fluvial sedimentation occurred in desert conditions and at a semi-arid climate, providing it lithological heterogeneity. The primary lithologies of this unit are sandstones, clayey sandstones, and siltstones, with or without carbonate cementation, characterized as a predominantly unconfined hydrogeological body that is a locally semi-confined one (DAEE 2005Departamento de Águas e Energia Elétrica (DAEE). 2005. Mapa de águas subterrâneas do estado de São Paulo. 119 p. +1 mapa +1CD. Escala 1:1.000.000. São Paulo: Departamento de Águas e Energia Elétrica.). Due to its extent and good productivity, it is the most intense and extensively explored system and is a water source for most of the municipalities in Western São Paulo.

Study area and location of the monitoring wells considered in this paper (modified from DAEE 2005Departamento de Águas e Energia Elétrica (DAEE). 2005. Mapa de águas subterrâneas do estado de São Paulo. 119 p. +1 mapa +1CD. Escala 1:1.000.000. São Paulo: Departamento de Águas e Energia Elétrica.) and NE-SE cross-sections showing thicknesses and contacts of the Bauru Group (modified from Paula and Silva 2003Paula e Silva F. 2003. Geologia de subsuperfície e hidroestratigrafia do Grupo Bauru no estado de São Paulo. Thesis, Instituto de Geociências e Ciências Exatas, Universidade Estadual Paulista “Júlio de Mesquita Filho”, Rio Claro, 166 p.).
The aquifers part of the BAS are Marília, Adamantina, Santo Anastácio, and Caiuá (Tab. 1). According to CETESB (2019Companhia Ambiental do Estado de São Paulo (CETESB). 2019. Qualidade das Águas Subterrâneas no Estado de São Paulo 2016-2018. São Paulo: Série de Relatórios/Secretaria de Estado do Meio Ambiente , 291 p. Relatório técnico.), its waters are predominant of two hydrochemical types, calcium bicarbonates (43%) and mixed type (37%) and, secondarily, sodium bicarbonates (17%). With the exception of local natural problems of iron, manganese, (more locally) chromium (Bourotte et al. 2009Bourotte C., Bertolo R.A., Almodovar M., Hirata R. 2009. Natural occurrence of hexavalent chromium in a sedimentary aquifer in Urânia, State of São Paulo, Brazil. Anais da Academia Brasileira de Ciências, 81(2):227-242. https://doi.org/10.1590/S0001-37652009000200009
https://doi.org/https://doi.org/10.1590/...
) and barium (Tavares et al. 2015Tavares T.L.S., Bertolo R.A., Fiúme B., Crespi A.M., Martins V., Hirata R. 2015. Hydrochemical investigation of barium in the public water supply wells of Sao Paulo state, southern Brazil. Environmental Earth Sciences, 74(9):6599-6612. https://doi.org/10.1007/s12665-015-4661-7
https://doi.org/https://doi.org/10.1007/...
) anomalies, its water is of excellent quality and is drinkable in more than 95% of the locations.
The BAS has an average saturated thickness of 75 m and can vary from 150 to 200 m in the region of São José do Rio Preto and Presidente Prudente, and to 300 m in the Residual Plateau of Marília. Thickness is influenced by the morphology of the rocky substrate represented by the basalts of Serra Geral Formation. Recharge occurs directly due to rainfall, and the groundwater regional flow takes place towards the main drains of Turvo, São José dos Dourados, Tietê, Aguapeí, Peixe, Santo Anastácio, Paraná, and Paranapanema rivers. The exploitable flow varies from 10 to 120 m3/h per well, with higher potential zones located along the Paraná and Paranapanema rivers.
MATERIALS AND METHODS
The method to monitor the nitrate concentration in the BAS consisted of two main stages, the selection and mapping of the wells and the comparison and chemical and urban occupation data correlation of the wells (Fig. 2). After selecting the wells, the next step was to map the capture zone for each well. Then, in each capture zone, changes in occupation between 1962 and 2016 were identified in the aerial images. The second stage compared and correlated the urban occupation, the sewer network installation year, and chemical data between 1962 and 2016.

Physical-chemical data of the monitoring network
Groundwater-monitoring network data of the State of São Paulo covered 1994 to 2015 (CETESB 2013Companhia Ambiental do Estado de São Paulo (CETESB). 2013. Qualidade das águas subterrâneas do Estado de São Paulo 2010-2012. São Paulo: Série de Relatórios/Secretaria de Estado do Meio Ambiente, 242 p. Relatório técnico., 2016Companhia Ambiental do Estado de São Paulo (CETESB). 2016. Qualidade das Águas Subterrâneas no Estado de São Paulo 2013-2015. São Paulo: Série de Relatórios/Secretaria de Estado do Meio Ambiente , 308 p. Relatório técnico., 2019Companhia Ambiental do Estado de São Paulo (CETESB). 2019. Qualidade das Águas Subterrâneas no Estado de São Paulo 2016-2018. São Paulo: Série de Relatórios/Secretaria de Estado do Meio Ambiente , 291 p. Relatório técnico.). Groundwater was collected and analyzed by CETESB and included 67 physical, chemical, and bacteriological parameters (Tab. 2). The monitoring network consists of active tubular water production wells equipped with submerged electric pumps.
Physical-chemical and microbiological parameters analyzed in the groundwater in the State of São Paulo monitoring network.
The program used for calculating the variation in nitrate concentrations overtime was Microsoft Excel. The groundwater collection frequency was one to three times a year, with sampling carried out according to the hydrological cycle, usually in a dry period (May to October) and a rainy one (November to April). The tubular wells were included in the network at different times, generating varied sampling periods. Given the wealth of chemical data, we sought to associate the various parameters with one another using correlation diagrams for each well. Positive, negative, or null ρ correlations were established according to the method described by Pearson (Freedman et al. 2007Freedman D., Pisani R., Purves R. 2007. Statistics (international student edition). 4th ed. New York: W. W. Norton and Company.), as seen in Equation 1:
The values of ρ are interpreted as follows:
-
ρ = 1 means a perfect direct correlation between the two variables;
-
ρ = -1 means a perfect inverse correlation between the two variables, that is, if one increases, the other always decreases;
-
ρ = 0 means that the two variables do not depend linearly on each other.
Well identification
Currently, the aquifer-monitoring network of the São Paulo State comprises a total of 313 tubular wells distributed over the main aquifer systems (CETESB 2019Companhia Ambiental do Estado de São Paulo (CETESB). 2019. Qualidade das Águas Subterrâneas no Estado de São Paulo 2016-2018. São Paulo: Série de Relatórios/Secretaria de Estado do Meio Ambiente , 291 p. Relatório técnico.). Two public reports were evaluated for this study: CETESB (2013Companhia Ambiental do Estado de São Paulo (CETESB). 2013. Qualidade das águas subterrâneas do Estado de São Paulo 2010-2012. São Paulo: Série de Relatórios/Secretaria de Estado do Meio Ambiente, 242 p. Relatório técnico.) and CETESB (2016Companhia Ambiental do Estado de São Paulo (CETESB). 2016. Qualidade das Águas Subterrâneas no Estado de São Paulo 2013-2015. São Paulo: Série de Relatórios/Secretaria de Estado do Meio Ambiente , 308 p. Relatório técnico.), which highlight the main wells in the State of São Paulo with nitrate concentrations above 5 mg/L N-NO3.
The BAS is the main water unit affected by nitrate in the State of São Paulo (CETESB 2016Companhia Ambiental do Estado de São Paulo (CETESB). 2019. Qualidade das Águas Subterrâneas no Estado de São Paulo 2016-2018. São Paulo: Série de Relatórios/Secretaria de Estado do Meio Ambiente , 291 p. Relatório técnico.). Ten wells located in this aquifer system were chosen to correlate land use and nitrate concentrations. The selected wells are located mainly in the Adamantina Aquifer, followed by Santo Inácio and Caiuá aquifers.
The information available for the ten selected wells includes:
-
increase, decrease, or neutral/stable nitrate concentration overtime;
-
location of the wells that allows to make a correlation with the evolution of land occupation;
-
complete and reliable construction information;
-
consistency in the variation of nitrate concentrations in several campaigns.
The average concentration for two different periods was determined and compared in order to evaluate the changes in nitrate concentration for each selected well: the first six years of well operation and between 2009 and 2015.
Mapping of capture zones in wells
The method used to establish the capture zones (related to recharge) of the well was the calculated fixed radius (CFR), which is defined through the transit time of 50 years, in agreement with the time of comparison between the images of the 60 s and the last collection evaluated in 2016.
The CFR method (Fig. 3 and Eq. 2) is based on a geometric approach that defines a circular area around the well proportional to the volume of water withdrawn in a particular period (USEPA 1994U.S. Environmental Protection Agency (USEPA). 1994. Ground water and wellhead protection. EPA/625/R-94/001. Cincinatti: USEPA, Office of Research and Development., Carvalho and Hirata 2012Carvalho A.M., Hirata R. 2012. Avaliação para a proteção dos poços de abastecimento público do Estado de São Paulo. Geologia USP. Série Científica, 12(1):5-70. https://doi.org/10.5327/Z1519-874X2012000100005
https://doi.org/https://doi.org/10.5327/...
). This technique does not consider the conditions of heterogeneity, anisotropy, or direction of aquifer flow, nor other particularities of the outline of wells. The CFR defines a capture zone that corresponds to a very simplified reality; however, the method is quite useful with a first assessment, especially in smooth topographical relief and few geological data (Carvalho and Hirata 2012Carvalho A.M., Hirata R. 2012. Avaliação para a proteção dos poços de abastecimento público do Estado de São Paulo. Geologia USP. Série Científica, 12(1):5-70. https://doi.org/10.5327/Z1519-874X2012000100005
https://doi.org/https://doi.org/10.5327/...
).
Where:
-
R is the calculated fixed radius;
-
t is the travel time;
-
Q is the pumping rate;
-
H is the thickness of the aquifer saturated zone;
-
nef is the effective porosity (Fig. 3).
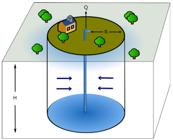
Outline of the well protection perimeter using the calculated fixed radius method. The variables are the same as in Equation 2.
The method applied the information of the following:
-
well yield;
-
effective porosity;
-
thickness of the aquifers saturated zone, which were taken from the construction profiles of the wells, as well as from the geology of the lithostratigraphic units.
The capture zones were calculated using the average effective porosity of the respective aquifers (Tab. 1), and the flow and saturated thickness were obtained from the construction profiles of wells.
Sewer network installation year
The sewer mains in the capture zones of the selected wells were obtained through interviews with the service operators in each city and presented different installation dates, starting in 1962 (Andradina, Flórida Paulista, Inúbia Paulista) until 2000 (Jales and São José do Rio Preto). The other cities had their sewer network installed after 2001; the most recent being Clementina, Nova Independência, and Murutinga do Sul.
Aerial photo analysis and images
The images were manipulated using Google Earth Pro and ArcMap 10.4.1, whose features allowed the integration and comparison between:
-
1:25,000 panchromatic aerial photographs, from an August 1962 aerial photographic survey by the São Paulo State Secretariat of Agriculture (São Paulo 1962São Paulo. Secretaria da Agricultura do Estado de São Paulo. 1962. Levantamento aerofotogramétrico do Estado de São Paulo. São Paulo: Instituto Agronômico.), which were kindly provided by the Aerial Photography and Remote Sensing Laboratory (LASERE) of Universidade de São Paulo;
-
satellite images from the 2000s onwards from the Landsat program (Land Remote Sensing Satellite), owned by the US government, and extracted from Google Earth Pro.
The comparison between the images determined the evolution and patterns of occupation throughout the extension of the capture zone (Fig. 4). It was possible to establish the variation in occupation, with special attention to the:
-
type of land occupation;
-
urban occupation density (houses/area of the capture zone), through the counting of roofs;
-
presence and assessment of green zones (drainages, rivers, native vegetation).

(A) Scheme for assessing the evolution of capture zone occupation patterns considered the type of land occupation, density of buildings, and recognition of natural zones, based on a comparison of aerial photographs from 1962. The blue color near the surface represents water without the presence of nitrate. (B) satellite images from the 2000s onward. The brown color near the surface indicates the presence of nitrate.
RESULTS
The analyzed wells are in the urban area of the cities indicated in Table 3. The results revealed three types of behaviors overtime (Tab. 3): three wells with a tendency toward decreased concentration (Cajobi, Murutinga do Sul, and Pompéia); a well showing stable behavior (Inúbia Paulista); and six wells with a tendency toward increased concentration (Andradina, Clementina, Florida Paulista, Jales, Nova Independência, and São José do Rio Preto). The average radius values of the capture zones were 532 m, with highs and lows of 799 (Andradina) and 314 m (Pompéia), respectively (Tab. 4).
Urban occupation (Tab. 5) was estimated by counting buildings (houses or service facilities) located in the capture zone of each well, constituting a relationship between the number of houses or building/km2 (Fig. 5). In all the studied cities, the urban density in the capture zone area increased between 132% (Inúbia Paulista) and 730% (São José do Rio Preto).

The highest values of urban density in 1962 were found in places whose age of occupation was older, that is, in the portions close to each city's center. By contrast, the wells installed in these places showed the smallest increases in urbanization because they were already substantially occupied.
The 2016 images show that the predominant occupation was urban, except in Cajobi and Nova Independência, where there are significant green areas. Urban areas predominated in a large part of the capture zone, with urban occupation rates of 30% in Cajobi and 45% in Nova Independência. The locations of São José do Rio Preto, Jales, and Flórida Paulista had 100% urban occupation.
Pearson's method determined the correlations among the 67 physical, chemical, and bacteriological parameters, and nitrate, seeking to better understand the nitrate origin (Tab. 6). However, although there were some significant direct and inverse correlations with other chemical parameters, few conclusions could be drawn. In Jales, there was a negative correlation (ρ = -0.7) between nitrate and hexavalent chromium, as this contaminant has a natural origin. As nitrate is a contaminant of anthropic origin, its concentration is higher in the aquifer's most superficial portions. On the other hand, the hexavalent chromium is found at aquifer greater depths, denoting a longer water-transit time (Bertolo et al. 2011Bertolo R.A., Bourotte C., Marcolan L., Oliveira S.B., Hirata R.C.A. 2011. Anomalous content of chromium in a Cretaceous sandstone aquifer of the Bauru Basin, state of São Paulo, Brazil. Journal of South American Earth Sciences, 31(1):69-80. https://doi.org/10.1016/j.jsames.2010.10.002
https://doi.org/https://doi.org/10.1016/...
). In the case of a positive relation between N-Kjeldahl and TDS and chloride in several wells, these results were expected due to the common origin of these compounds.
DISCUSSION
This research found that the sewer network (Tab. 5) substantially influences nitrate concentrations; however, not homogeneously. In older occupation areas, where the sewer mains were installed until 2001, nitrate concentrations increased between 1994 and 2016, except in Cajobi, indicating leaks from the sewer network. Sewer mains were constructed in the ceramic material before 1990, which breaks down with age due to the lack of maintenance.
As to Clementina and Nova Independência, whose sewer networks were installed in 2013 and 2011, respectively, there was an increase in nitrate due to a large number of buildings (with cesspools and septic tanks) built before the sewage collection network installation. In the future, the nitrate concentration will decrease due to the installation of those new sewer mains and the abandonment of pits.
All cities that tended to show increases in nitrate had direct associations with the number of buildings present within the capture zone in 2016, with greater than or equal to 60% of urban occupation in the capture zone (Fig. 6). If the well location is closer to the city center, that is, in older places, the occupation of the capture zone tends to be more significant.

Variation of nitrate concentrations according to the evolution of occupation in each analyzed well. The dashed lines in the red color indicate the trends of nitrate concentrations: increase or reduction of concentrations.
The well located in Inúbia Paulista center showed stability in nitrate concentrations (6% variation). Since 1962, the site has had a high urban density in the capture zone (693 houses/km2 in 1962), reaching 917 houses/km2 in 2016. The well was installed in 1992 and had a concentration of 6.34 mg/L N-NO3, and in 2016, 7.00 mg/L N-NO-3 was measured.
Finally, the wells in the cities of Cajobi, Pompéia, and Murutinga do Sul showed a decrease in nitrate concentrations, although these locations presented an increase in the urban occupation density. In this group, the installation of the sewer mains occurred after 2001, and there was time for the contamination to be reduced, showing that modern and efficient networks are essential to minimize the aquifer contamination.
CONCLUSION
The method applied to the BAS showed a correlation between the urban land use in the well vicinity (capture zone) and changes in the concentration of nitrate in groundwater between 1994 and 2016. In areas with sewer mains built before 2001 and with an urban density greater than 60% of urban occupation in the capture zone, there might have been an increase of at least 35% in the nitrate concentration.
Although the implementation of a public sewage system is the most efficient way to reduce contamination by domestic effluents, the lack of maintenance, mostly of old ceramic networks, has caused leaks that deteriorate the BAS waters.
This study demonstrates that the method established a causal relationship between the history of urban occupation and the nitrate concentration in monitoring wells in an unconfined and sedimentary aquifer, such as the BAS. Thus, it would be desirable to extend the application to all the other wells in the state monitoring network. This method could also be applied to select new locations for future wells that will integrate this network.
The results of such a method could be used by health surveillance agencies, which should pay attention to public-supply wells in areas where urban density is more significant than 60% of urban occupation in the capture zone and sewer networks were built before the 2000s.
Finally, any urban expansion should be preceded with the installation of a sewer network, using materials that are more resistant to time, such as PVC, followed by an efficient and permanent maintenance program, as can be seen in the cities of Murutinga do Sul and Pompeia.
ACKNOWLEDGEMENTS
The authors want to express their thanks to Geographer Rosângela Modesto of CETESB for releasing the data and her careful manuscript reading. We are also grateful to Fundação de Amparo à Pesquisa do Estado de São Paulo (FAPESP) for supporting the research projects that helped this study interpretations (Proc. 2014/05697-2; 2013/22469-0).
REFERENCES
- Aranda N., Prado R., Elis V., Miguel M., Gandolfo O., Conicelli B. 2019. Evaluating elastic wave velocities in Brazilian municipal solid waste. Environmental Earth Sciences, 78:475. https://doi.org/10.1007/s12665-019-8490-y
» https://doi.org/https://doi.org/10.1007/s12665-019-8490-y - Babinski M., Aily C., Ruiz I.R., Sato K. 2003. Pb isotopic signatures of the atmosphere of the São Paulo city, Brazil. Journal de Physique, 107:87-90. https://doi.org/10.1051/jp4:20030250
» https://doi.org/https://doi.org/10.1051/jp4:20030250 - Babinski M., Gioia S.M.L., Aily C., Pimentel M., Ruiz I.R., Kerr A. 2012. Aplicação da geoquímica isotópica do Pb na caracterização das fontes poluentes na atmosfera: Exemplos das cidades de São Paulo e Brasília. In: Figueiredo B.R., De Capitani E.M., Dos Anjos J.Â.S.A., Luiz-Silva W. (Eds.). Chumbo, ambiente e saúde: o desafio do controle da exposição humana. São Paulo: Annablume, p. 185-213.
- Barcha S.F. 1980. Aspectos gemológicos e províncias hidrogeológicas da Formação Bauru na região norte-ocidental do Estado de São Paulo São José do Rio Preto: Universidade Estadual Paulista “Júlio de Mesquita Filho”, 209 p.
- Bertolo R.A., Bourotte C., Marcolan L., Oliveira S.B., Hirata R.C.A. 2011. Anomalous content of chromium in a Cretaceous sandstone aquifer of the Bauru Basin, state of São Paulo, Brazil. Journal of South American Earth Sciences, 31(1):69-80. https://doi.org/10.1016/j.jsames.2010.10.002
» https://doi.org/https://doi.org/10.1016/j.jsames.2010.10.002 - Bertolo R., Hirata R., Conicelli B., Simonato M., Pinhatti A., Fernandes A. 2015. Água subterrânea para abastecimento público na Região Metropolitana de São Paulo: é possível utilizá-la em larga escala? Revista DAE, 63:6-17. https://doi.org/10.4322/dae.2014.148
» https://doi.org/https://doi.org/10.4322/dae.2014.148 - Bourotte C., Bertolo R.A., Almodovar M., Hirata R. 2009. Natural occurrence of hexavalent chromium in a sedimentary aquifer in Urânia, State of São Paulo, Brazil. Anais da Academia Brasileira de Ciências, 81(2):227-242. https://doi.org/10.1590/S0001-37652009000200009
» https://doi.org/https://doi.org/10.1590/S0001-37652009000200009 - Carvalho A.M., Hirata R. 2012. Avaliação para a proteção dos poços de abastecimento público do Estado de São Paulo. Geologia USP. Série Científica, 12(1):5-70. https://doi.org/10.5327/Z1519-874X2012000100005
» https://doi.org/https://doi.org/10.5327/Z1519-874X2012000100005 - Cary L., Petelet-Giraud E., Montenegro S., Hirata R., Martins V., Aurouet A., Pauwels H., Kloppmann W., Aquilina L. 2013. Groundwater Salinization in a Coastal Multilayer Aquifer: Preliminary Results on Origins and Mechanisms- Example of Recife (Brazil). Procedia Earth and Planetary Science, 7:118-122. https://doi.org/10.1016/j.proeps.2013.03.164
» https://doi.org/https://doi.org/10.1016/j.proeps.2013.03.164 - Companhia Ambiental do Estado de São Paulo (CETESB). 2013. Qualidade das águas subterrâneas do Estado de São Paulo 2010-2012 São Paulo: Série de Relatórios/Secretaria de Estado do Meio Ambiente, 242 p. Relatório técnico.
- Companhia Ambiental do Estado de São Paulo (CETESB). 2016. Qualidade das Águas Subterrâneas no Estado de São Paulo 2013-2015 São Paulo: Série de Relatórios/Secretaria de Estado do Meio Ambiente , 308 p. Relatório técnico.
- Companhia Ambiental do Estado de São Paulo (CETESB). 2019. Qualidade das Águas Subterrâneas no Estado de São Paulo 2016-2018 São Paulo: Série de Relatórios/Secretaria de Estado do Meio Ambiente , 291 p. Relatório técnico.
- Conicelli B. 2014. Gestão das águas subterrâneas na Bacia Hidrográfica do Alto Tietê (SP) Thesis, Instituto de Geociências, Universidade de São Paulo, São Paulo. https://doi.org/10.11606/T.44.2014.tde-09102014-140000
» https://doi.org/https://doi.org/10.11606/T.44.2014.tde-09102014-140000 - Departamento de Águas e Energia Elétrica (DAEE). 2005. Mapa de águas subterrâneas do estado de São Paulo 119 p. +1 mapa +1CD. Escala 1:1.000.000. São Paulo: Departamento de Águas e Energia Elétrica.
- Departamento de Águas e Energia Elétrica (DAEE). 2012. Projeto Jurubatuba: restrição e controle de uso de água subterrânea. In: Departamento de Águas e Energia Elétrica, Instituto Geológico, Secretaria de Estado do Meio Ambiente, Secretaria de Estado de Saneamento e Energia. In: Cadernos do Projeto Estratégico Aquíferos São Paulo: Secretaria de Estado de Saneamento e Energia, 109 p.
- Drake V.M., Bauder J.W. 2005. Groundwater nitrate-nitrogen trends in relation to urban development, Helena Montana, 1971-2003. Groundwater Monitoring and Remediation, 25(2):118-130. https://doi.org/10.1111/j.1745-6592.2005.0017.x
» https://doi.org/https://doi.org/10.1111/j.1745-6592.2005.0017.x - Foster S., Gomes D.C. 1989. Monitoreo de la calidad de las aguas subterráneas: una evaluación de métodos y costos. Lima: WHO-PAHO/HPE-CEPIS, 111 p. Technical Manual.
- Foster S., Hirata R. 1988. Groundwater pollution risk assessment: a methodology using available data. Lima: WHO-PAHO-HPE CEPIS. Technical Manual.
- Foster S., Hirata R., Howard K. 2011. Groundwater use in developing cities - Policy issues arising from current trends. Hydrogeology Journal, 19:271-274.
- Foster S., Hirata R., Gomes D., Délia M., Paris M. 2006. Proteção da qualidade da água subterrânea: um guia para empresas de abastecimento de água, órgãos municipais e agências ambientais. Washington, D.C.: Banco Mundial.
- Freedman D., Pisani R., Purves R. 2007. Statistics (international student edition). 4th ed. New York: W. W. Norton and Company.
- Giafferis G., Oliveira E. 2006. Investigação da qualidade de águas subterrâneas no município de Bauru. In: Congresso Brasileiro de Águas Subterrâneas, 14., 2006, Curitiba. Annals... Curitiba: ABAS. (CD-ROM).
- He S., Wu J. 2019. Hydrogeochemical Characteristics, Groundwater Quality, and Health Risks from Hexavalent Chromium and Nitrate in Groundwater of Huanhe Formation in Wuqi County, Northwest China. Exposure and Health, 11:125-137. https://doi.org/10.1007/s12403-018-0289-7
» https://doi.org/https://doi.org/10.1007/s12403-018-0289-7 - Hibbs B.J., Sharp J.M. Jr. 2012. Hydrogeological effects of urbanization. Environmental and Engineering Geoscience, 18(1):3-24
- Hirata R. 2000. Estudo da contaminação por nitrato no Distrito de Tibiriça, Bauru São Paulo: Departamento de Água, Energia e Esgoto. Instituto de Geociências, Universidade de São Paulo.
- Hirata R., Foster S., Oliveira F. 2015. Águas subterrâneas urbanas: avaliação para uma gestão sustentável [Urban groundwater: evaluation for sustainable management]. São Paulo: Instituto de Geociências / FAPESP, 112 p. v. 1.
- Hirata R., Suhogusoff A.V. 2019. How much do we know about the groundwater quality and its impact on Brazilian society today? Acta Limnologica Brasiliensia, 31:e109. https://doi.org/10.1590/s2179-975x4419
» https://doi.org/https://doi.org/10.1590/s2179-975x4419 - Paula e Silva F. 2003. Geologia de subsuperfície e hidroestratigrafia do Grupo Bauru no estado de São Paulo Thesis, Instituto de Geociências e Ciências Exatas, Universidade Estadual Paulista “Júlio de Mesquita Filho”, Rio Claro, 166 p.
- Petelet-Giraud E., Cary L., Cary P., Bertrand G., Giglio-Jacquemot A., Hirata R., Aquilina L., Alves L., Martins V., Melo A., Montenegro S., Chatton E., Franzen M., Aurouet A. 2018. Multi-layered water resources, management, and uses under the impacts of Global Changes in a Southern Coastal Metropolis: when will it be already too late? Crossed analysis in Recife, NE Brazil. Environmental Science and Policy, 618:645-657. https://doi.org/10.1016/j.scitotenv.2017.07.228
» https://doi.org/https://doi.org/10.1016/j.scitotenv.2017.07.228 - Porto M. 2003. Recursos Hídricos e Saneamento na Região Metropolitana de São Paulo Brasília: Banco Mundial, 73. v. 1.
- Reynolds-Vargas J., Fraile-Merino J., Hirata R. 2006. Trends in nitrate concentrations and determination of their origin using stable isotopes (18O and 15N) in groundwater of the Western Central Valley, Costa Rica. Journal of the Human Environment, 35(5):229-236.
- Santos Filho M., Hirata R., Luiz M.B., Conicelli B. 2017. Solo e águas subterrâneas contaminadas pela deposição de resíduos sólidos urbanos: o caso do Vazadouro de Tatuí (SP). Revista do Instituto Geológico, 38(1):31-47. https://doi.org/10.5935/0100-929X.20170003
» https://doi.org/https://doi.org/10.5935/0100-929X.20170003 - Sistema Nacional de Informações sobre Saneamento (SNIS). 2017. Diagnóstico dos Serviços de Água e Esgotos - 2015 21ª ed. Brasília: Secretaria Nacional de Saneamento Ambiental, 212 p.
- São Paulo. Secretaria da Agricultura do Estado de São Paulo. 1962. Levantamento aerofotogramétrico do Estado de São Paulo São Paulo: Instituto Agronômico.
- Tavares T.L.S., Bertolo R.A., Fiúme B., Crespi A.M., Martins V., Hirata R. 2015. Hydrochemical investigation of barium in the public water supply wells of Sao Paulo state, southern Brazil. Environmental Earth Sciences, 74(9):6599-6612. https://doi.org/10.1007/s12665-015-4661-7
» https://doi.org/https://doi.org/10.1007/s12665-015-4661-7 - U.S. Environmental Protection Agency (USEPA). 1994. Ground water and wellhead protection EPA/625/R-94/001. Cincinatti: USEPA, Office of Research and Development.
- Varnier C., Iritani M.A., Viotti M., Oda G.H., Ferreira L.M.R. 2010. Nitrato nas águas subterrâneas do Sistema Aquífero Bauru, área urbana do município de Marília (SP). Revista do Instituto Geológico, São Paulo, 31(1-2):1-21. https://doi.org/10.5935/0100-929X.20100001
» https://doi.org/https://doi.org/10.5935/0100-929X.20100001 - Varnier C., Rocha G.A., Campos J.E., Albuquerque Filho J.L., Simonato M., Hirata R. 2019. Nitrato nas águas subterrâneas: desafios frente ao panorama atual. São Paulo: SIMA/IG, 99 p. v. 1.
- Xu Y., Baker L.A., Johnson P.C. 2007. Trends in groundwater nitrate contamination in the Phoenix, Arizona Region. Groundwater Monitoring and Remediation, 27(2):49-56. https://doi.org/10.1111/j.1745-6592.2007.00135.x
» https://doi.org/https://doi.org/10.1111/j.1745-6592.2007.00135.x - Xu Z., Xu J., Yin H.J.W., Jin W., Li H., He Z. 2019. Urban river pollution control in developing countries. Nature Sustain, 2:158-160. https://doi.org/10.1038/s41893-019-0249-7
» https://doi.org/https://doi.org/10.1038/s41893-019-0249-7 - Wu J., Li P., Wang D., Ren X., Wei M. 2020. Statistical and multivariate statistical techniques to trace the sources and affecting factors of groundwater pollution in a rapidly growing city on the Chinese Loess Plateau. Human and Ecological Risk Assessment, 26(6):1603-1621. https://doi.org/10.1080/10807039.2019.1594156
» https://doi.org/https://doi.org/10.1080/10807039.2019.1594156
ARTICLE INFORMATION
-
1
Manuscript ID: 20200053.
Publication Dates
-
Publication in this collection
10 May 2021 -
Date of issue
2021
History
-
Received
23 June 2020 -
Accepted
21 Jan 2021


 Source: adapted from

