Abstract
The present study proposes to apply magnitude-squared coherence (MSC) to the somatosensory evoked potential for identifying the maximum driving response band. EEG signals, leads [Fpz'-Cz'] and [C3'-C4'], were collected from two groups of normal volunteers, stimulated at the rate of 4.91 (G1: 26 volunteers) and 5.13 Hz (G2: 18 volunteers). About 1400 stimuli were applied to the right tibial nerve at the motor threshold level. After applying the anti-aliasing filter, the signals were digitized and then further low-pass filtered (200 Hz, 6th order Butterworth and zero-phase). Based on the rejection of the null hypothesis of response absence (MSC(f) > 0.0060 with 500 epochs and the level of significance set at a = 0.05), the beta and gamma bands, 15-66 Hz, were identified as the maximum driving response band. Taking both leads together ("logical-OR detector", with a false-alarm rate of a = 0.05, and hence a = 0.0253 for each derivation), the detection exceeded 70% for all multiples of the stimulation frequency within this range. Similar performance was achieved for MSC of both leads but at 15, 25, 35, and 40 Hz. Moreover, the response was detected in [C3'-C4'] at 35.9 Hz and in [Fpz'-Cz'] at 46.2 Hz for all members of G2. Using the "logical-OR detector" procedure, the response was detected at the 7th multiple of the stimulation frequency for the series as a whole (considering both groups). Based on these findings, the MSC technique may be used for monitoring purposes.
Gamma oscillations; Somatosensory response detection; Tibial nerve; Magnitude-squared coherence
Braz J Med Biol Res, December 2006, Volume 39(12) 1593-1603
Use of magnitude-squared coherence to identify the maximum driving response band of the somatosensory evoked potential
 Correspondence and Footnotes
 A.F.C. Infantosi1, D.B. Melges1 and C.J. Tierra-Criollo2
1Programa de Engenharia Biomédica, Coordenação dos Programas de Pós-graduação de Engenharia, Universidade Federal do Rio de Janeiro, Rio de Janeiro, RJ, Brasil
2Grupo de Engenharia Biomédica, Departamento de Elétrica, Escola de Engenharia, Universidade Federal de Minas Gerais, Belo Horizonte, MG, Brasil
 References
Correspondence and Footnotes
Correspondence and Footnotes
Correspondence and Footnotes
Abstract
The present study proposes to apply magnitude-squared coherence (MSC) to the somatosensory evoked potential for identifying the maximum driving response band. EEG signals, leads [Fpz'-Cz'] and [C3'-C4'], were collected from two groups of normal volunteers, stimulated at the rate of 4.91 (G1: 26 volunteers) and 5.13 Hz (G2: 18 volunteers). About 1400 stimuli were applied to the right tibial nerve at the motor threshold level. After applying the anti-aliasing filter, the signals were digitized and then further low-pass filtered (200 Hz, 6th order Butterworth and zero-phase). Based on the rejection of the null hypothesis of response absence (MSC(f) > 0.0060 with 500 epochs and the level of significance set at a = 0.05), the beta and gamma bands, 15-66 Hz, were identified as the maximum driving response band. Taking both leads together ("logical-OR detector", with a false-alarm rate of a = 0.05, and hence a = 0.0253 for each derivation), the detection exceeded 70% for all multiples of the stimulation frequency within this range. Similar performance was achieved for MSC of both leads but at 15, 25, 35, and 40 Hz. Moreover, the response was detected in [C3'-C4'] at 35.9 Hz and in [Fpz'-Cz'] at 46.2 Hz for all members of G2. Using the "logical-OR detector" procedure, the response was detected at the 7th multiple of the stimulation frequency for the series as a whole (considering both groups). Based on these findings, the MSC technique may be used for monitoring purposes.
Key words: Gamma oscillations, Somatosensory response detection, Tibial nerve, Magnitude-squared coherence
Introduction
The somatosensory evoked potential (SEP) has been used for different purposes, such as providing a prognostic value in the evaluation of intracranial hypertension (1) and of neuromotor development in preterm newborns (2). The SEP has also been considered to be sensitive to neurological insults caused by mechanical stress, hypotension and ischemia (3). During the monitoring of spine and vascular surgery, such as lumbar pedicle screw placement for in situ posterior spinal fusion (4) and thoracic and thoracoabdominal aortic resection (5), SEP has been used to prevent neurological sequelae. Even when postoperative sequelae cannot be avoided during surgery, intra-operative neurophysiologic monitoring is suggested since changes in SEP could alert the physician and his staff and avoid damage exacerbation (3). Furthermore, many studies have pointed out that postoperative monitoring is useful in order to detect late neurological impairment (6).
Although it has been widely applied during surgery, visual SEP analysis is subjective and depends on factors such as observer skills, baseline EEG quality, anesthesia regimen, and inter-observer and inter-patient variability (7). In order to overcome this limitation, quantitative analysis of EEG signals during stimulation has been suggested. Particularly, objective response detection techniques, that can statistically infer the presence of responses to a stimulus, have presented promising results. Such techniques present a maximum false-alarm rate established a priori and can even result in a better performance than morphological analysis carried out by human observers (8).
The magnitude-squared coherence (MSC) is a frequency domain objective response detection technique introduced by Dobie and Wilson (9) to analyze evoked potentials. These investigators reported that this technique yields important results regarding the detection of the cortical response. MSC has been applied to the brainstem auditory evoked potential for the detection of hearing impairment in children/newborns (10) and to the analysis of the middle-latency auditory evoked potential for anesthetic plan monitoring (11). Additionally, this technique was also applied to the detection of the driving response elicited by somatosensory stimulation (12), and during intermittent photic stimulation in the study of EEG coherence and inter-hemisphere symmetry between homologous regions (13).
Although the results obtained by applying MSC to the EEG during stimulation are promising, the selection of the more suitable frequency range for monitoring is still an unsolved problem. Hence, the knowledge of which frequencies (oscillations) better characterize the EEG activity during sensory stimulation is a requirement for clinical application, mainly for monitoring purposes. Oscillations within the gamma band (30-100 Hz) have been observed in many different neurophysiological states and experimental protocols using auditory (14), visual (15) or somatosensory stimulation (16). Nevertheless, a narrow frequency band has not been determined for human beings during somatosensory stimulation.
The objective of the present study was to investigate the maximum driving response frequency band for the SEP resulting from the stimulation of the tibial nerve of humans. In order to determine a narrow band, a stimulation rate of about 5 Hz is used and the EEG is processed by applying the MSC as a statistical technique. This permits testing the null hypothesis of the absence of the response up to 200 Hz, which includes the gamma band.
Material and Methods
Magnitude-squared coherence
As described by Misulis (17), the evoked potentials are nervous system responses to motor or sensory stimulation, usually characterized by their morphology (peak and valley latency, amplitude and polarity). Since the amplitude of the evoked potential is at least ten times lower (it can be 1000 times lower in brainstem auditory evoked potential, for example) than the background EEG, the coherent average is usually calculated to demonstrate the waveform. The coherent average is the averaging of windowed EEG in stimulus-synchronized epochs. This procedure is justified by the assumption that the background EEG is a Gaussian white noise with zero mean and the evoked responses are identically stimulus-synchronized from stimulus to stimulus (18). Hence, the averaging result is the signal-to-noise ratio increase.
By considering the i-th EEG epoch during stimulation (yi[n]) and the linear model presented in Figure 1:
 Eq. 1
Eq. 1 where s[n] is the evoked response and r[n] is the background EEG, the coherent average offers an estimate which is given by
 Eq. 2
Eq. 2 where the superscript ^ denotes the estimate and M is the number of EEG epochs. When the number of epochs M tends to infinity,  tends to s[n].
The MSC for the discrete-time, finite duration and segmented signal can be calculated as described by Miranda de Sá et al. (19). For the particular case of periodic stimulation (e.g., x[n] is a pulse train), the MSC depends only on the measured signal y[n] (EEG during somatosensory stimulation) and is estimated as (9):
 Eq. 3
Eq. 3 where f is the frequency index, ^ denotes estimation, Yi(f) is the i-th window Fourier transform of y[n], and M is the number of epochs considered in the estimate calculation.
While the numerator of Equation 3 is the magnitude squared of the sum of M complex number Yi(f) (magnitude and phase), the denominator is M times the summation of the magnitude squared of Yi(f). Hence, when the stimulus response (assumed as a deterministic signal and identical in all epochs) is present in all M epochs (although contaminated by background EEG, with Gaussian distribution of zero mean) for the frequency f, the Yi(f) are synchronized. The synchrony result is illustrated in Figure 2A. When the EEG power approaches zero, the complex number modulus (black arrow) approaches unity. On the other hand, if no stimulus response is elicited, there is no synchronism between the Yi(f), i.e., the phase is randomly distributed, which leads to a modulus ( numerator) that tends to zero, as illustrated in Figure 2B. Thus, can vary from zero to unity.
It can be seen that, for M independent epochs of a Gaussian signal with zero mean y[n] (background EEG), the statistical distribution of is related to the F-distribution with 2 and 2M-2 degrees of freedom. Hence, for the null hypothesis (H0) of the absence of the driving response and based on the critical values of the F-distribution for a given a level of significance, the estimate critical value can be calculated as (12):
 Eq. 4
Eq. 4 which can be used as the detection threshold.
The response synchronized at the frequency stimulation and harmonics results in detection when  . Since the level of significance is the probability of detection even when no driving response is elicited, a maximum false-positive rate of a is expected at all frequencies in the no-stimulation condition. It is worth noting that the statistical test is not valid for DC (f = 0) or Nyquist frequency (f = fs/2, where fs is the sampling frequency), cases for which the discrete Fourier transform components are purely real and, hence, is not related to the F-distribution shown in Equation 4.
Subjects
EEG signals from two somatosensory cortex regions were collected from two groups of normal volunteers with no symptoms of neurological pathology and with normal SEP: G1, 18 men and 8 women aged 23 to 45 years (mean ± standard deviation (SD): 28.3 ± 5.6 years) and G2, 16 men and 2 women aged 18 to 31 years (mean ± SD: 25.6 ± 3.3 years). The signals were collected from volunteers relaxed in the supine position with their eyes shut. The local Ethics Committee (CEP-HUCFF/UFRJ) approved this research and all volunteers gave written informed consent to participate.
Somatosensory stimulation and EEG acquisition
For group G1 the stimulation was applied using the MEB 9102 (Nihon Kohden, Tokyo, Japan) with two surface gold electrodes located about 2 cm apart, positioned over the right posterior tibial nerve at the ankle, with a ground electrode on the popliteal fossa. Rectangular current pulses of 200-µs duration and a nominal frequency of 5 Hz (4.91 Hz to avoid responses at 60 Hz and harmonics) were employed at the motor threshold (the lowest intensity that produces involuntary contraction of interior foot muscles). The recording electrodes were positioned at Fpz' (midpoint between Fpz and Fz according to the International System 10-20) with reference at Cz' (2 cm posterior to Cz), C3' (2 cm posterior to C3, i.e., contralateral to the stimulation) with reference at C4' (2 cm posterior to C4, i.e., ipsilateral), as usually done for SEP. Surface gold electrodes were used and impedance values of less than 5000 W were maintained. The EEG derivations were amplified and band-filtered at 10 to 1000 Hz with the bio-amplifier Opti-Amp V. 8000D (Intelligent Hearing System, Miami, FL, USA). The EEG derivations and the trigger signal (showing the instants of each stimulus) were then digitized with 12-bits resolution (DAQPad-1200, National Instruments, New York, NY, USA) at a sampling rate of 3000 Hz and recorded in a personal computer using a dedicated software developed by the Images and Signals Processing Laboratory (LAPIS), in LabVIEW 6i platform (National Instruments). Similar procedures were used to collect the EEG signals from G2 volunteers, but using the SapphireII 4ME (Medelec, Oxford, UK) for stimulation at the rate of 5.13 Hz, band-filtering from 10 to 2000 Hz and digitizing at 5000 Hz.
The stimulation protocol consisted of the determination of the lowest current intensity that produces involuntary contraction of foot interior muscle (motor threshold), followed by the application of 1000 to 1400 stimuli. The stimulation period was preceded by about 3.5 min (duration equivalent to about 1000 stimuli at 5 Hz) of background EEG recording. The environmental temperature was kept in the 23.9 ± 1.3ºC range.
Pre-processing
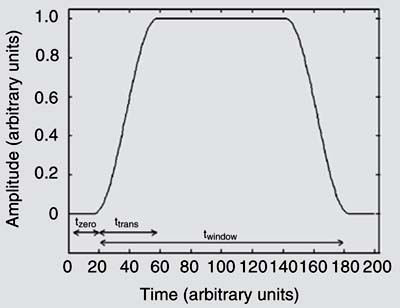
It is well known that the most important SEP components occur within the first 100 ms and that there is a stimulus artifact (synchronized with the stimulation) in the first milliseconds. Since this artifact is wide-band, it produces distortion in the frequency domain and hence in the MSC results. In order to overcome this problem the first 3-ms post-stimulus was set to zero. Considering the zero padding approach, the epoch time duration was W1 = 203 ms (spectral resolution = 1/W1 = 4.93 Hz) for G1 and W2 = 195 ms (spectral resolution = 1/W2 = 5.13 Hz) for G2. Furthermore, a Tukey window (Figure 3) with a 7-ms rising (falling) time was applied to each epoch before estimating the MSC. This window can be defined as:
 Eq.5
Eq.5 where k = 1 to N, N is the number of samples in the window length and  , where ttrans is the rising time and twindow is the Tukey window total time. This procedure is in accordance with the results of Tierra-Criollo and Infantosi (16), who reported that the more important stimulus artifact effect occurs up to 5 ms.
After windowing, the EEG signals were digitally filtered with a low-pass (200 Hz) 6th order Butterworth filter (zero-phase). Moreover, in order to avoid the high variance epochs (low signal-to-noise ratio), which can be considered noisy, an automatic artifact rejection algorithm was also applied (20). This algorithm is based on the SD of 20 s of noise-free background EEG selected as reference for signal level. The epoch is rejected if more than 5% of continuous samples or more than 10% of any samples exceed ± 3 SD (threshold containing approximately 99.5% of samples assuming EEG amplitude to be normally distributed).
Somatosensory evoked potential
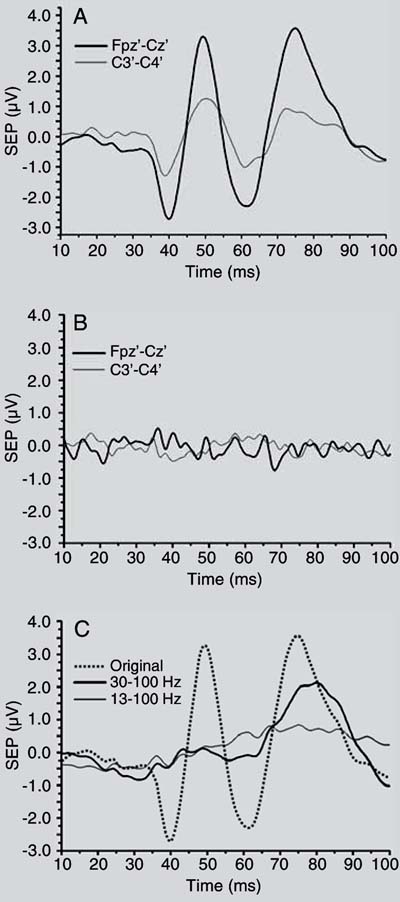
Figure 4A illustrates the resulting SEP of volunteer #6 (G1, stimulated with 15 mA), with M = 500 epochs. For both derivations [Fpz'-Cz'] and [C3'-C4'], the most characteristic SEP latencies, a valley of nearly 40 ms (corresponding to  ) and a peak around 50 ms (
 ) can be easily noted. By applying to the SEP of the [Fpz'-Cz'] derivation a zero-phase stop-band 6th order Butterworth filter (range: 30 to 100 Hz), the and were almost removed (thick line in Figure 4C), indicating that these SEP characteristics are mainly within the gamma band. If the low cut-off frequency of the stop-band filter was changed to 13 Hz, hence including the beta band, the SEP long latency peaks were also de-emphasized (thin line in Figure 4C). On the other hand, for another subject (volunteer #6 from G2, stimulated with 8 mA), it was not possible to identify the characteristic SEP morphology for any of the derivations, as illustrated in Figure 4B. In this example, the resulting morphology seems to reflect only noise, particularly the 3rd harmonic of the electrical power (180 Hz).
Tables 1 and 2 summarize the mean latencies for and at derivations [Fpz'-Cz'] and [C3'-C4'] for G1 and G2, respectively. For G1 (Table 1), both SEP (P and N) components were identified in [Fpz'-Cz'] for all volunteers and in [C3'-C4'] for only 85% of them. Since the signals from G2 (Table 2) showed a lower signal-to-noise ratio, both components of the somatosensory response were observed for only 8 volunteers (44%) for [Fpz'-Cz']. A similar rate was also found (10 volunteers, equivalent to 55%) for [C3'-C4'].
The latencies of peaks and valleys found for SEP morphology, with values ranging from 34 to 45 ms () and from 39 to 55 ms () for [Fpz'-Cz'] and [C3'-C4'], agree with the values reported in the literature for motor threshold (20).
Linear model: x[n] is an impulse train (stimulus), h[n] is the system transfer function, s[n] is the stimulus-response, r[n] is the backgrond EEG, and y[n] is the measured signal.
Tukey window: tzero is the time set to zero, ttrans is the rising time and twindow is the window total time.
Somatosensory evoked potential (SEP) with M = 500 for derivations [Fpz'-Cz'] (thick line) and [C3'-C4'] (thin line) of volunteer #6. (A) From G1, stimulated with 15 mA; (B) from G2, stimulated with 8 mA. (C) [Fpz'-Cz'] shown in (A) but stop-band filtered (6th order Butterworth, zero-phase) in the range from 30 to 100 Hz (thick line) and from 13 to 100 Hz (thin line). Original signal represented by the dashed line.
Somatosensory evoked potential short latency (with 500 epochs) components at [Fpz'-Cz'] and [C3'-C4'] of the 26 volunteers of group 1.
Somatosensory evoked potential short latency components at [Fpz'-Cz'] and [C3'-C4'] of the 18 volunteers of group 2.
Results
Applying the MSC to the EEG during stimulation allows the rejection of the null hypothesis of the absence of the response at any frequency if . Figure 5 illustrates the procedure for the detection of the MSC driving response ( = 0.0060, with M = 500 and a = 0.05) applied to distinct volunteers stimulated at different frequencies. For subject #6 (G1) stimulated at 4.93 Hz with 15 mA (Figure 5A), it can be noted that the response detection occurred at multiples of the stimulation frequency up to 88.7 Hz for [Fpz'-Cz'] and up to 73.9 Hz (except for 9.8, 19.7, 69.0 Hz) for [C3'-C4']. For another subject, #6 (G2), stimulated at 5.13 Hz with 8 mA as shown in Figure 5B, the response was detected within the range from 20.5 to 41.0 Hz for [C3'-C4'] and from 20.5 to 51.3 Hz (except 35.9 Hz) for [Fpz'-Cz']. A better response detection occurred with the [C3'-C4'] lead, from 34.5 to 64.0 Hz (except 35.9 Hz), than with [Fpz'-Cz'], as depicted in Figure 5C, for volunteer #19 (G1) stimulated at 4.93 Hz with 15.6 mA.
Figure 6 shows the percentage of volunteers for whom detection of the driving response (M = 500 and a = 0.05) can be assumed in each derivation and at multiples of the stimulation frequency within the range from 14 to 77 Hz. The percentage of detection when both derivations are considered together ("logical-OR detector" - LORD, with false-alarm rate of a = 0.05, and hence a = 0.0253 for each derivation) is also depicted in this Figure. For [C3'-C4'] from subjects of G1 (Figure 6A), the percent detection at 39.4 and 44.3 Hz was higher than 70%, while for [Fpz'-Cz'] it occurred within a broader band [29.5-54.2 Hz]. On the other hand, using the LORD approach ( = 0.0073, with M = 500 and a = 0.05), all frequencies, except at 59.1 Hz, within the range from 14 to 64 Hz resulted in detection higher than 80%. Moreover, this percentage can reach 100% at 34.5 Hz.
For the volunteers stimulated with 5.13 Hz (Figure 6B), detection higher than 70% for both derivations was still predominantly within the low gamma band. Using the LORD approach, all frequencies (14-52 Hz) could be detected for at least 88% of these volunteers. Furthermore, the response was detected for all volunteers at 30.8, 35.9, and 46.2 Hz.
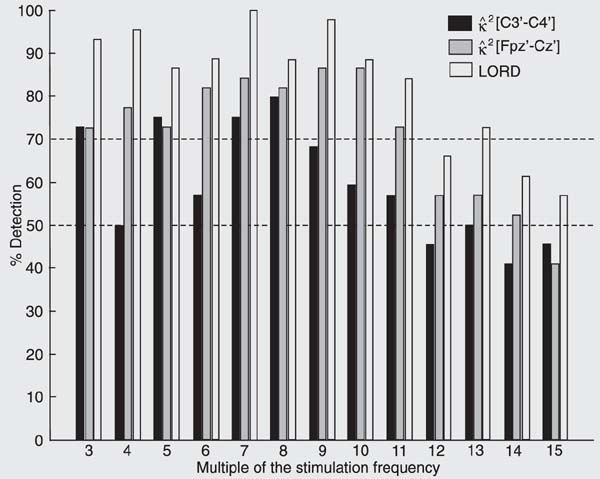
In the subject series as a whole (G1 and G2), the response was detected in at least 70% of the volunteers (Figure 7) from the 3rd to 11th multiples of the stimulation frequency for the [Fpz'-Cz'] derivation and using the LORD procedure. More important is the fact that the responses of almost all volunteers were detected at the 7th and 9th multiples of the stimulation frequency, i.e., around 35 and 45 Hz, respectively.
Percentage of volunteers of (A) G1, stimulation at 4.91 Hz, and (B) G2, stimulation at 5.13 Hz, for whom the driving response was detected for M = 500 and a = 0.05. Horizontal lines: 50 and 70% detection. LORD = "logical-OR detector".
Percentage of volunteers (G1 and G2) for whom the driving response was detected for M = 500 and a = 0.05. The X scale represents the harmonic of the stimulation frequency. Horizontal lines: 50 and 70% detection. LORD = "logical-OR detector".
Discussion
The SEP maximum driving response band was identified within the gamma band, particularly in the range from 30 to 60 Hz. The 7th to 9th multiples (35-45 Hz) of the stimulation frequency - and also some frequencies within the beta band (3rd and 4th, equivalent to 15 and 20 Hz), showed the highest detection rate, being observed in nearly 100% of the volunteers. By using both somatosensory leads in the LORD approach, the percent detection was always higher than or equal to that obtained by using the MSC of only one derivation, except at 49.3 Hz for G1 and 77.0 Hz for G2.
The gamma band seems to be the most relevant frequency range of the short latency components ( and ) of the tibial somatosensory response as one can conclude when the SEP is filtered in this range. Furthermore, the beta band (15-30 Hz) seems to be related to the SEP long latency characteristics. Since these frequency bands reflect the most relevant somatosensory characteristics, and , they could be used for intra-operative monitoring in spine (4) and vascular (5) surgeries.
Additionally, these frequency ranges, mainly the gamma band, should be taken into account for investigating the neurophysiologic basis of SEP, such as the and generators. Although, several studies (21-23) have been carried out with this aim, the localization of such generators remains inconclusive. Therefore, the objective detection technique proposed here could also be a useful tool for mapping the frequency distribution over the scalp and could then be applied to determine the cortical regions in which the stimulus-synchronized response is detected.
These findings, particularly the gamma band, are consistent with the results of tibial nerve stimulation reported by Tierra-Criollo and Infantosi (16). Using the MSC with M = 800, the 30- to 58-Hz frequency range made the highest contribution to SEP morphology (data not shown). Additionally, cortical responses within the 30- to 100-Hz range have also been reported during auditory (14) and visual (15) stimulation. Moreover, according to Basar et al. (24), since the 1980's many investigators have observed gamma band activity in different neurophysiological states and experimental stimulation protocols. These authors speculated that the gamma band and the other EEG oscillations, i.e., beta, alpha, theta, and delta, play an important role in sensory and cognitive information processing.
Different signal processing techniques, such as time-frequency analysis (14) and spectral analysis (15,16), have been applied to identify gamma oscillations. Spectral coherence was applied to the EEG during auditory stimulation (10) and also to the magnetoencephalogram during sleep states (25) and somatosensory stimulation (26). In the present study, the driving responses were identified using the MSC with M = 500. By using M = 800, a good performance in detecting the somatosensory response was also achieved. With a lower number of epochs (M = 100), the performance was still suitable (results not shown). Furthermore, it can also be stated that an improvement in the detection rate could be achieved with higher M values since lower M implies higher estimate variability.
It should be emphasized that increasing the number of epochs leads to an increase in the time needed to identify the driving response. This also implies a reduction in the speed of SEP tracking and could lead to the use of non-stationary records in the estimation of MSC. The analysis of SEP morphology can involve averaging up to M = 2000 epochs (17) (equivalent to 400 s with stimulation of 5 Hz), while the MSC technique allows the detection of the driving response with only M = 500 epochs (equivalent to nearly 100 s), as obtained in the present study.
We conclude that MSC can be a suitable statistical technique for identifying the somatosensory stimulus response at the motor threshold intensity level for the tibial nerve. Using this technique, the frequency range from 15 to 66 Hz (beta and low gamma band) can be considered to be the maximum driving response band when this stimulation protocol is carried out. It is worth emphasizing that the response was detected in [C3'-C4'] at 35.9 Hz and in [Fpz'-Cz'] at 46.2 Hz for all volunteers of G2 when M = 500 epochs were considered. Moreover, using the LORD procedure, the response detection occurred at the 7th multiple of the stimulation frequency for the series as a whole (considering both groups). Finally, since the MSC allows the determination of the maximum driving response band and presents a false-alarm rate established a priori (a level of significance), this frequency domain technique could be used to establish a procedure for monitoring patient responsiveness.
Acknowledgments
We are grateful to the Military Police Central Hospital of Rio de Janeiro for providing infrastructure support. Address for correspondence: A.F.C. Infantosi, Programa de Engenharia Biomédica, COPPE, UFRJ, Caixa Postal 68510, 21941-972 Rio de Janeiro, RJ, Brasil. Fax: +55-21-2562-8591. E-mail: afci@peb.ufrj.br
Research supported by CAPES, CNPq, and FAPERJ. Received January 18, 2006. Accepted August 21, 2006.
- 1. Giugno KM, Maia TR, Kunrath CL, Bizzi JJ. Treatment of intracranial hypertension. J Pediatr 2003; 79: 287-296.
- 2. Pike AA, Marlow N. The role of cortical evoked responses in predicting neuromotor outcome in very preterm infants. Early Hum Dev 2000; 57: 123-135.
- 3. Bose B, Sestokas AK, Schwartz DM. Neurophysiological monitoring of spinal cord function during instrumented anterior cervical fusion. Spine J 2004; 4: 202-207.
- 4. Gundanna M, Eskenazi M, Bendo J, Spivak J, Moskovich R. Somatosensory evoked potential monitoring of lumbar pedicle screw placement for in situ posterior spinal fusion. Spine J 2003; 3: 370-376.
- 5. Galla JD, Ergin MA, Lansman SL, McCullough JN, Nguyen KH, Spielvogel D, et al. Use of somatosensory evoked potentials for thoracic and thoracoabdominal aortic resections. Ann Thorac Surg 1999; 67: 1947-1952.
- 6. Dong CC, MacDonald DB, Janusz MT. Intraoperative spinal cord monitoring during descending thoracic and thoracoabdominal aneurysm surgery. Ann Thorac Surg 2002; 74: S1873-S1876.
- 7. Martin CJ, Sinson G, Patterson T, Zager EL, Stecker MM. Sensitivity of scalp EEG, cortical EGG, and somatosensory evoked responses during surgery for intracranial aneurysms. Surg Neurol 2002; 58: 317-320.
- 8. Dobie RA, Wilson MJ. Objective response detection in the frequency domain. Electroencephalogr Clin Neurophysiol 1993; 88: 516-524.
- 9. Dobie RA, Wilson MJ. Analysis of auditory evoked potentials by magnitude-squared coherence. Ear Hear 1989; 10: 2-13.
- 10. Ramos EG, Zaeyen EJB, Simpson DM, Infantosi AFC. Detection of EEG auditory response in children, using frequency domain techniques. Rev Bras Eng Biomed 2000; 16: 127-137.
- 11. Cagy M, Infantosi AFC, Gemal AE. Monitoring depth of anaesthesia by frequency-domain statistical techniques. Rev Bras Eng Biomed 2000; 16: 95-107.
- 12. Simpson DM, Tierra-Criollo CJ, Leite RT, Zayen EJ, Infantosi AF. Objective response detection in an electroencephalogram during somatosensory stimulation. Ann Biomed Eng 2000; 28: 691-698.
- 13. Miranda de Sá AMFL, Infantosi AFC. A coherence-based technique for evaluating the degree of synchronism in the EEG during sensory stimulation. Rev Bras Eng Biomed 2002; 18: 39-49.
- 14. Snyder JS, Large EW. Gamma-band activity reflects the metric structure of rhythmic tone sequences. Brain Res Cogn Brain Res 2005; 24: 117-126.
- 15. Hoogenboom N, Schoffelen JM, Oostenveld R, Parkes LM, Fries P. Localizing human visual gamma-band activity in frequency, time and space. Neuroimage 2006; 29: 764-773.
- 16. Tierra-Criollo CJ, Infantosi AFC. Low-frequency oscillations in human tibial somatosensory evoked potentials. Arq Neuropsiquiatr 2006; 64-2B: 402-406.
- 17. Misulis KE. General description of evoked potentials. In: Anonimous, Spehlmann's evoked potential primer: Visual, auditory and somatosensory evoked potentials in clinical diagnosis Boston: Butterworth-Heinemann; 1994. p 5-9.
- 18. Lopes da Silva FH. Event-related potentials: methodology and quantification. In: Niedermeyer E, Lopes da Silva FH (Editors), Electroencephalography - basic principles, clinical applications, and related fields Baltimore: Williams & Wilkins; 1999. p 947-957.
- 19. Miranda de Sá AMFL, Infantosi AFC, Simpson DM. Coherence between one random and one periodic signal for measuring the strength of responses in the EEG during sensory stimulation. Med Biol Eng Comput 2002; 40: 99-104.
- 20. Chiappa KH. Evoked potentials in clinical medicine 2nd edn. New York: Raven Press; 1997.
- 21. Valeriani M, Restuccia D, Di Lazzaro V, Barba C, Le Pera D, Tonali P. Dipolar generators of the early scalp somatosensory evoked potentials to tibial nerve stimulation in human subjects. Neurosci Lett 1997; 238: 49-52.
- 22. Valeriani M, Restuccia D, Le Pera D, Barba C, Tonali P. Scalp distribution of the earliest cortical somatosensory evoked potential to tibial nerve stimulation: proposal of a new recording montage. Clin Neurophysiol 2000; 111: 1469-1477.
- 23. Tinazzi M, Fiaschi A, Idone D, Tezzon F, Zanette G. Parkinson's disease and lower limb somatosensory evoked potentials: apomorphine-induced relief of the akinetic-rigid syndrome and vertex P37-N50 potentials. J Neurol Sci 1999; 164: 163-171.
- 24. Basar E, Schurmann M, Basar-Eroglu C, Demiralp T. Selectively distributed gamma band system of the brain. Int J Psychophysiol 2001; 39: 129-135.
- 25. Llinas R, Ribary U. Coherent 40-Hz oscillation characterizes dream state in humans. Proc Natl Acad Sci U S A 1993; 90: 2078-2081.
- 26. Tecchio F, Babiloni C, Zappasodi F, Vecchio F, Pizzella V, Romani GL, et al. Gamma synchronization in human primary somatosensory cortex as revealed by somatosensory evoked neuromagnetic fields. Brain Res 2003; 986: 63-70.
Correspondence and Footnotes

Publication Dates
-
Publication in this collection
12 Feb 2008 -
Date of issue
Dec 2006
History
-
Received
18 Jan 2006 -
Accepted
21 Aug 2006