 Prediction of early myocardial damage in obstructive sleep apnea patients using combined logistic regression and QUEST decision tree models
Abstract
Obstructive sleep apnea (OSA) is linked to cardiovascular complications, including myocardial dysfunction, yet early detection remains difficult. This retrospective study aimed to develop a combined logistic regression and QUEST decision tree model to predict early myocardial dysfunction in OSA patients. Echocardiography left ventricular global longitudinal strain (LVGLS) and right ventricular free wall longitudinal strain (RVFWLS) were used to assess myocardial function in OSA patients. Predictive models were constructed using clinical parameters. External validation involved 100 OSA patients from a respiratory sleep clinic. LVGLS and RVFWLS were significantly impaired in OSA patients, particularly in moderate-to-severe cases. BMI, percentage of sleep time with oxygen saturation <90% (CT90%), and arterial bicarbonate were identified as key predictors. The combined model achieved superior predictive accuracy, with an area under the curve of 0.91 for LVGLS and RVFWLS reductions, outperforming individual models. External validation confirmed the stability and generalizability of the model. The combined logistic regression and QUEST decision tree model accurately predicted early myocardial dysfunction in OSA patients, providing a valuable tool for personalized risk assessment and early intervention.
Obstructive sleep apnea; LVGLS; RVFWLS; Logistic regression; QUEST decision tree
Introduction
Obstructive sleep apnea (OSA) is a common sleep-related breathing disorder characterized by recurrent episodes of apnea and hypopnea during sleep, leading to intermittent hypoxia, oxidative stress, and inflammatory responses (1). These pathological mechanisms are known to exert significant effects on the cardiovascular system, particularly contributing to myocardial injury. Studies have shown that patients with OSA have an increased risk of developing cardiovascular diseases, such as hypertension, heart failure, and coronary artery disease, with myocardial injury often being an early manifestation of these complications (2,3). Early identification and prediction of myocardial damage in OSA patients are critical for reducing the incidence of cardiovascular events and improving patient prognosis.
Early myocardial damage in patients with OSA is often difficult to detect through routine clinical examinations. Studies have shown that myocardial longitudinal strain parameters are sensitive indicators for the early identification of myocardial dysfunction (4,5). The current gold standard for diagnosing OSA is overnight polysomnography (PSG), which classifies disease severity based on the apnea-hypopnea index (AHI) (1). However, while PSG can evaluate OSA severity, it is limited in its ability to predict early myocardial dysfunction. As a result, some patients with mild or moderate OSA may have undetected myocardial damage, potentially delaying timely clinical interventions. Early prediction of myocardial injury not only facilitates better disease assessment but also helps guide treatment strategies, such as the use of continuous positive airway pressure (CPAP), thereby more effectively preventing the progression of cardiovascular complications and potentially even reversing early myocardial functional impairment (6,7).
To address this gap, this study proposes a combined predictive model for early myocardial injury in OSA patients, integrating multivariate logistic regression (LR) and the Quick, Unbiased, Efficient Statistical Tree (QUEST) decision tree model. Logistic regression quantifies the risk factors for myocardial injury and their correlations, while the QUEST model captures nonlinear features and complex interactions. QUEST is a decision tree algorithm that uses statistical tests to select the best predictive variables and ensure unbiased splits. By utilizing a robust splitting criterion, QUEST reduces overfitting and improves predictive performance, particularly when dealing with datasets with complex variable interactions. By incorporating clinical baseline data, blood test indices, PSG data, and echocardiographic findings, the model aims to identify early signs of myocardial dysfunction in OSA patients.
The objective of this study was to establish and validate a predictive model that may guide clinical decision-making, enabling more personalized CPAP therapy for high-risk OSA patients. This approach is expected to reduce the risk of myocardial damage progression to more severe cardiovascular diseases, ultimately improving long-term health outcomes for OSA patients.
Material and Methods
Patients
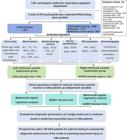
The study consecutively selected 678 patients who visited the Sleep Center of the Third Affiliated Hospital of Anhui Medical University (Hefei First People's Hospital) and underwent PSG examination between March 2019 and March 2022 as research subjects.
Inclusion criteria were: 1) age over 18 years; 2) normal cognitive function and intact autonomous behavior ability; 3) complete clinical data, including general information, blood biochemical indices, and cardiac ultrasound parameters; 4) complete PSG examination during hospitalization; and 5) ability to independently and accurately complete the questionnaire.
Exclusion criteria were: 1) presence of conditions other than OSA that may affect blood gas analysis results, such as laryngeal diseases, vocal cord disorders, tracheal foreign bodies, chronic obstructive pulmonary disease (COPD), acute exacerbation of bronchial asthma, interstitial lung disease, anemia, electrolyte imbalance, and cardiovascular diseases other than hypertension; 2) presence of chronic diseases that may affect blood HCO3- concentration, such as heart and lung failure or liver and kidney dysfunction; 3) use of a ventilator within the past month; 4) presence of other sleep-related breathing disorders aside from OSA; 5) individuals in special conditions or statuses (e.g., pregnancy, lactation, postpartum, or mental disorders); 6) use of sedatives or antipsychotic medications within the past month; 7) use of diuretics; 8) incomplete clinical data; 9) potential abnormal electroencephalogram (EEG) findings (e.g., epilepsy, brain tumors, or deep brain stimulator implants); 10) central respiratory events accounting for more than 50% of total respiratory events; and 11) total nighttime sleep duration of less than 5 h.
This study was approved by the Ethics Committee of the Third Affiliated Hospital of Anhui Medical University (First People's Hospital of Hefei) and was granted a waiver of informed consent.
General clinical data
Basic demographic and clinical data, including gender, age, height, weight, body mass index (BMI), neck circumference (NC), abdominal circumference (AC), systolic and diastolic blood pressures (SBP, DBP), smoking history, and alcohol consumption, were collected.
Blood indicators
Fasting blood samples were collected to assess alanine aminotransferase (ALT), triglycerides (TG), total cholesterol (TC), high- and low-density lipoprotein cholesterol (HDL-C, LDL-C), fasting glucose (GLU), bicarbonate (HCO3-), C-reactive protein (CRP), interleukin-6 (IL-6), and angiotensin I (Ang I).
PSG recording and analysis
Participants underwent PSG using an Alice 6 device (Philips Respironics, USA). Key parameters including AHI, lowest oxygen saturation (LSaO2), and mean oxygen saturation (MSaO2) were recorded. Diagnosis followed 2012 Asian Society of Sleep Medicine (ASSM) guidelines for OSA severity classification: AHI 5-15 (mild), 15-30 (moderate), and >30 (severe).
Arterial blood gas analysis
Arterial blood was collected for blood gas analysis, measuring parameters such as partial pressure of arterial oxygen (PaO2), partial pressure of arterial carbon dioxide (PaCO2), potential of hydrogen (pH), HCO3-, and oxygen saturation (SaO2).
OSA questionnaires
All participants completed the Epworth Sleepiness Scale (ESS) (8), the STOP-Bang questionnaire (9), and the Berlin Questionnaire (10) to categorize them into high-risk and low-risk groups for OSA.
Echocardiography and cardiac systolic function
Transthoracic echocardiography (TTE) was performed to assess left and right ventricular function. Left ventricular global longitudinal strain (LVGLS) and right ventricular free wall longitudinal strain (RVFWLS) were measured using two-dimensional strain echocardiography (2D-STE).
Patient grouping
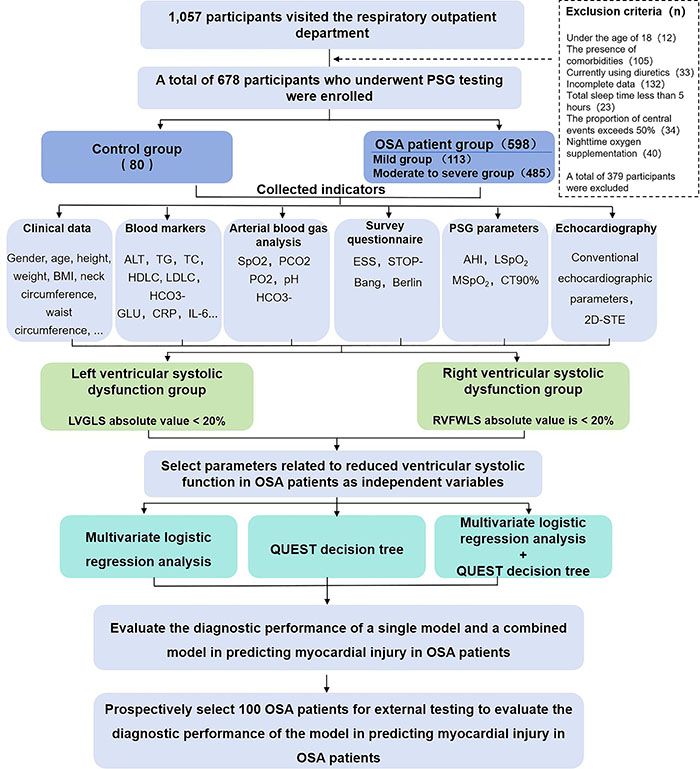
Patients were grouped into: 1) normal, mild, and moderate-to-severe OSA based on AHI; 2) LVGLS<20% indicating early left ventricular systolic dysfunction (11); and 3) RVFWLS<20% indicating early right ventricular systolic dysfunction (11). The patient recruitment process is shown in Figure 1.
Ethical statement
We conducted our study in accordance with the Helsinki Declaration of 1975 as revised in 2024. This study was approved by the Institutional Review Board (IRB) of the Third Affiliated Hospital of Anhui Medical University (Hefei First People's Hospital) (approval number 2024-294-01). Because patient data were retrospectively analyzed, the requirement for written informed consent was waived according to the local ethics guidelines. All patient details were de-identified, ensuring anonymity. The reporting of this study conformed to Strengthening the Reporting of Observational Studies in Epidemiology (STROBE) guidelines (12).
Statistical methods
Data were analyzed using SPSS 19.0 (IBM, USA). Descriptive statistics were used for general information, with normally distributed data reported as means±SD, and non-normally distributed data as median and interquartile range (P75-P25). Sensitivity and specificity were calculated using a 2×2 contingency table, and the comparison between methods was performed with a paired t-test (P<0.05 considered significant).
Logistic regression was performed to identify parameters associated with early myocardial damage (LVGLS<20% or RVFWLS<20%). Significant parameters were treated as independent variables, and LVGLS<20% or RVFWLS<20% were set as dependent variables. Regression coefficients (β) and odds ratios (OR) were calculated to assess the strength and direction of correlations.
The QUEST decision tree model was constructed with a minimum parent node size of 10 and a minimum child node size of 5. Model robustness was assessed using 10-fold cross-validation. The dataset was divided into 10 subsets for training and testing, repeated 10 times.
To assess model performance, we calculated the receiver operating characteristics (ROC) curves and area under the curve (AUC) values for the individual models (logistic regression and QUEST decision tree) and the combined model: for the standalone logistic regression model, the ROC curve was plotted using the logistic regression probability score (P-value) and for the standalone QUEST decision tree model, the ROC curve was derived from the final classification outcome (binary decision: at risk vs not at risk).
For the combined model (Logistic + QUEST), we implemented a weighted probability fusion strategy, where the final probability score (P combined) was computed as a weighted average of the logistic regression and QUEST decision tree outputs by Equation 1:
The weights (ω1 and ω2) were optimized using 10-fold cross-validation to maximize the AUC. The final combined probability score was used to generate the ROC curve and compute the AUC for the ensemble model.
Sample size estimation was based on logistic regression and QUEST model requirements. A total of 598 patients were included, meeting the minimum sample size for model stability and validation. The ROC curve analysis indicated the model's predictive performance with an AUC range of 0.78-0.91.
Results
Clinical characteristics of participants
A total of 678 participants were included in the study after excluding 379 individuals with coronary artery disease, cancer, non-cooperation, or missing clinical data. Participants were categorized based on the AHI into the control group (80 participants) and the OSA group, which was further divided into mild OSA (113 participants) and moderate-to-severe OSA (485 participants).
In the comparison between the control and OSA groups, the OSA group showed significantly higher BMI, smoking history, hypertension, SBP, DBP, ALT, TG, LDLC, GLU, ESS, STOP-Bang scores, and Berlin Questionnaire scores (P<0.05). No significant differences were found in age, gender, alcohol history, Cr, TC, and HDLC (P>0.05). Between the control and mild OSA groups, the latter had higher BMI, NC, AC, SBP, DBP, ALT, TG, LDL-C, ESS, STOP-Bang scores, and Berlin Questionnaire scores (P<0.05). No significant differences were observed in age, gender, smoking history, alcohol consumption, GLU, TC, and HDLC (P>0.05). In comparison between the mild and moderate-to-severe OSA groups, the latter showed significantly higher BMI, SBP, DBP, hypertension, ALT, TG, GLU and STOP-Bang scores (P<0.05). No significant differences were observed in other parameters (P>0.05). OSA patients exhibited significant metabolic abnormalities in BMI, blood pressure, triglycerides, and fasting glucose, with more severe abnormalities in those with more severe OSA (Table 1).
PSG results of the enrolled participants
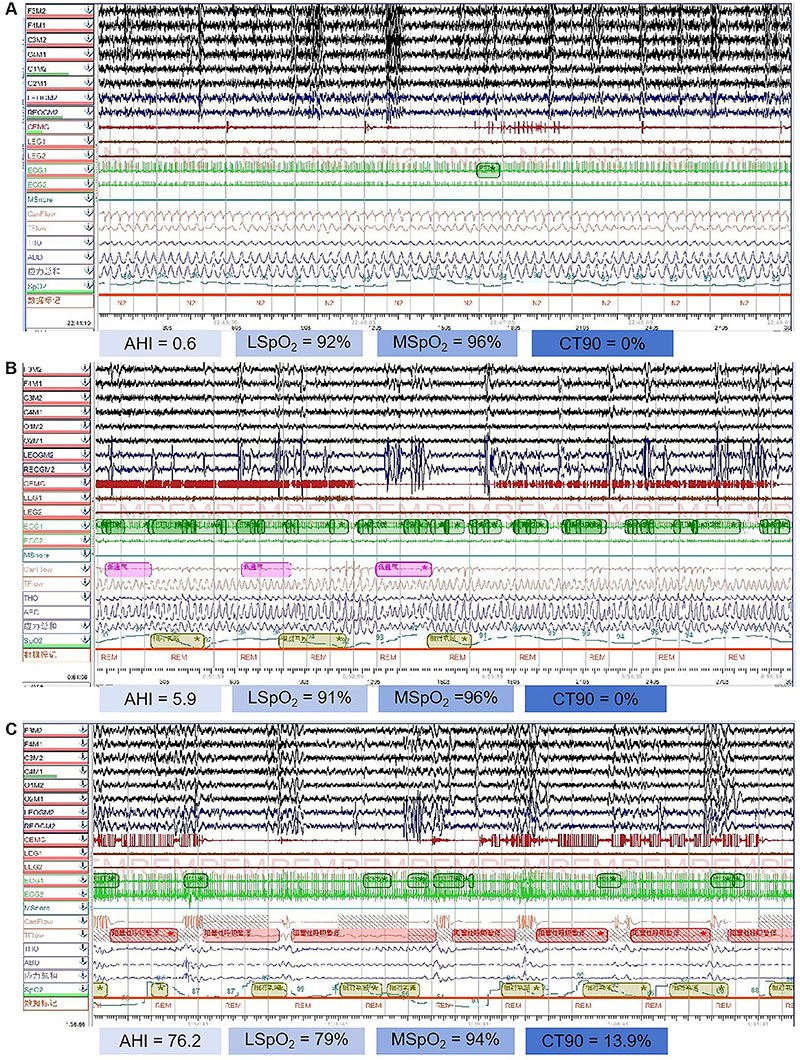
In this study, significant differences were found by comparing the PSG analysis results of the control group, mild OSA group, and moderate-to-severe OSA group (Figure 2). First, regarding the AHI, there were significant differences between the control group, mild OSA group, and moderate-to-severe OSA group (all P<0.001). Second, regarding lowest (L)SpO2, a significant difference was observed between the control group and the moderate-to-severe OSA group (P<0.001), but no statistical difference was found between the control group and the mild OSA group (P=0.094). Third, in terms of mean (M)SpO2, significant differences were found between the control group, mild OSA group, and moderate-to-severe OSA group (all P<0.05). Finally, significant differences were also observed in CT90% between the control group, mild OSA group, and moderate-to-severe OSA group (all P<0.05) (Table 2).
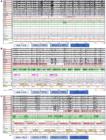
Polysomnography (PSG) test results of participants. A, PSG image of a control group participant. B, PSG image of a mild obstructive sleep apnea (OSA) patient. C, PSG image of a moderate-to-severe OSA patient. PSG: polysomnography; AHI: apnea-hypopnea index; LSpO2: lowest oxygen saturation; MSpO2: mean oxygen saturation; CT90%: percentage of time with oxygen saturation below 90%.
Arterial blood gas analysis results
The arterial blood gas analysis results showed that, compared to the control group, the OSA group had significantly higher PaCO2 and HCO3- levels, along with a lower pH, indicating respiratory dysfunction with carbon dioxide retention and metabolic acidosis. The mild OSA group showed higher HCO3- levels than the control group, but there were no significant differences in SaO2, PaCO2, PaO2, and pH, suggesting early compensatory responses in mild OSA patients. Comparing the mild and moderate-to-severe OSA groups, the latter had significantly lower PaO2, higher PaCO2 and HCO3-, and a lower pH, reflecting more pronounced respiratory and metabolic abnormalities as OSA severity increased (Table 3).
Echocardiographic findings across study groups
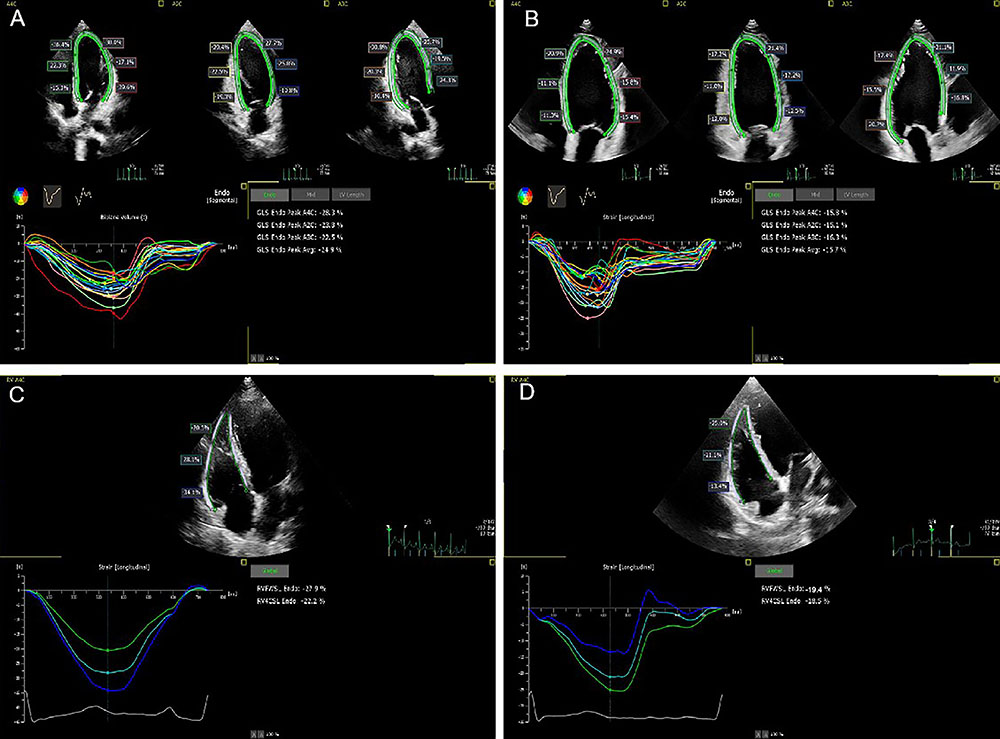
This study compared the left ventricular (LV) parameters among the control, mild OSA, and moderate-to-severe OSA groups. While left ventricular end-diastolic dimension (LVEDD), left ventricular end-systolic dimension (LVESD), left ventricular posterior wall thickness (LVPWT), and left ventricular end-diastolic volume (LVEDV) were within normal ranges for all groups, the interventricular septum diameter (IVSD) exceeded normal limits in the moderate-to-severe OSA group, indicating interventricular septal thickening. Additionally, LVGLS was reduced across all OSA patients, reflecting impaired left ventricular systolic function (Figure 3A and B).
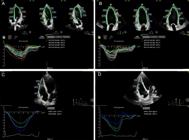
Two-dimensional strain echocardiography measurement of LVGLS and RVFWLS in obstructive sleep apnea patients. A, Upper image showing multiple cross-sectional views of the left ventricle, with green lines marking the endocardial contours. LVGLS=-24.9% and RVFWLS=-27.9%, indicating normal left and right ventricular systolic function. B, Ultrasound images showing cross-sectional views of the left ventricle, with LVGLS=-15.7% and RVFWLS=-19.4%, indicating impaired left and right ventricular systolic function. C, Cross-sectional view of the right ventricular free wall showing LVGLS=-24.9% and RVFWLS=-27.9%, indicating normal left and right ventricular systolic function. D, Cross-sectional view of the right ventricular free wall showing LVGLS=-15.7% and RVFWLS=-19.4%, indicating reduced function in both ventricles. LVGLS: left ventricular global longitudinal strain; RVFWLS: right ventricular free wall longitudinal strain.
Control vs OSA group: the OSA group showed significantly larger LVEDD, LVESD, IVSD, LVPWT, LVEDV, and left ventricular end-systolic volume (LVESV), indicating left ventricular dilation and increased volume load (P1<0.05). Left ventricular ejection fraction (LVEF) and LVGLS were significantly decreased, suggesting impaired systolic function (P1<0.05). Control vs mild OSA group: the mild OSA group had a significantly higher (LVEF) (P2<0.05) but a significantly lower LVGLS (P2<0.05), indicating early changes in left ventricular systolic function. Mild vs moderate-to-severe OSA group: the moderate-to-severe OSA group showed significantly larger LVEDD, LVESD, IVSD, LVPWT, LVEDV, and LVESV (P<0.001), with significantly reduced LVEF and LVGLS (P<0.001), reflecting progressive deterioration of LV function (Table 4).
For right ventricular (RV) parameters, although right ventricular basal diameter (RVBD), right ventricular fractional area change (RVFAC), tricuspid annular plane systolic excursion (TAPSE), and tissue doppler imaging-derived systolic peak velocity (TDI-S') in the OSA group were within normal limits, RVBD was significantly larger, and RVFAC, TAPSE, TDI-S', tricuspid regurgitation velocity (TRV), pulmonary artery systolic pressure (PASP), and RVFWLS were significantly impaired compared to the control group (P1<0.001), indicating RV dilation and systolic dysfunction (Figure 3C and D).
Control vs mild OSA group: the mild OSA group exhibited significantly increased RVBD (P2<0.001), and significantly decreased RVFAC, TAPSE, TDI-S', TRV, PASP, and RVFWLS (P2<0.001), indicating right ventricular dysfunction even in mild OSA. Mild vs moderate-to-severe OSA group: in the moderate-to-severe OSA group, all RV parameters were significantly worsened (P<0.001), confirming progressive right ventricular systolic impairment with increasing OSA severity (Table 5).
Factors influencing early left and right ventricular systolic dysfunction in OSA patients
Left ventricular systolic dysfunction
Among OSA patients, 99 had normal LVGLS and 499 had reduced LVGLS. In the mild OSA group, 24 had normal LVGLS and 89 had reduced LVGLS; in the moderate-to-severe OSA group, 75 had normal LVGLS and 410 had reduced LVGLS. Comparison of parameters revealed that patients with reduced LVGLS had significantly higher BMI (P<0.001), larger NC (P<0.001), and greater AC (P<0.05) compared to those with normal LVGLS. No significant differences were found in terms of SBP, DBP, hypertension prevalence, liver function, lipid metabolism markers, GLU, and questionnaire scores. PSG analysis showed significant differences in AHI (P<0.05), MSpO2, and CT90% (both P<0.001), with arterial blood HCO3- levels significantly higher in the reduced LVGLS group (P<0.001), indicating a compensatory response to respiratory acidosis. No significant differences were observed in conventional echocardiographic parameters, but LVEF was significantly lower in the reduced LVGLS group (P<0.05), though both groups remained within the normal range (Table 6).
Comparison of various data between the normal LVGLS group and the reduced LVGLS group in obstructive sleep apnea patients.
Right ventricular systolic dysfunction
A total of 86 OSA patients had normal RVFWLS and 512 had reduced RVFWLS. Among the mild OSA group, 22 had normal RVFWLS and 91 had reduced RVFWLS; in the moderate-to-severe OSA group, 64 had normal RVFWLS and 421 had reduced RVFWLS. The BMI of the reduced RVFWLS group was significantly higher than the normal group (P<0.001), while NC and AC were also significantly larger in the reduced RVFWLS group (P<0.05). There were no significant differences in smoking history, alcohol consumption, or hypertension prevalence. Blood gas analysis showed significantly higher arterial HCO3- levels in the reduced RVFWLS group (P<0.001). PSG parameters showed differences in AHI (P<0.05) and significant variations in MSpO2 and CT90% (both P<0.001). However, conventional right heart echocardiographic parameters (RVBD, RVFAC, TAPSE, TDI-S', TRV, and PASP) did not differ significantly between the two groups (P>0.05) (Table 7).
Comparison of various data between the normal RVFWLS group and the reduced RVFWLS group in obstructive sleep apnea patients.
Logistic regression prediction of early left and right ventricular systolic dysfunction risk in OSA patients
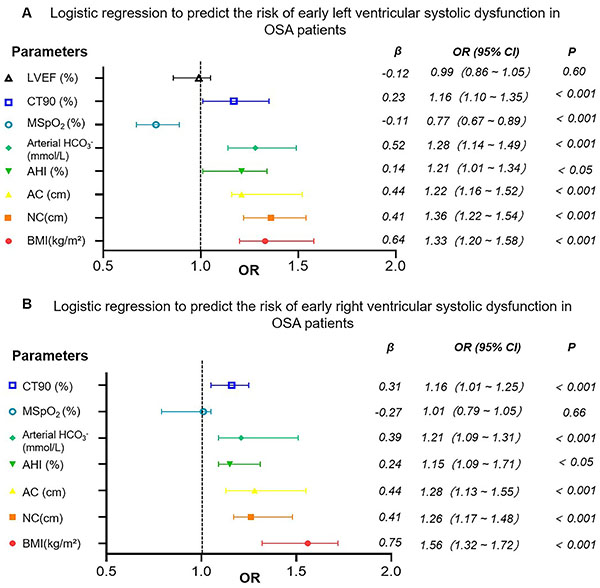
Multivariate logistic regression was conducted to predict the risk of early left and right ventricular systolic dysfunction in OSA patients. For early left ventricular systolic dysfunction (defined as LVGLS<20%), significant parameters included BMI, neck circumference, waist circumference, AHI, arterial blood HCO3-, MspO2, and CT90%, all of which were significantly correlated with reduced LVGLS. LVEF did not show a significant correlation with early left ventricular systolic dysfunction (P=0.60) (Figure 4A).
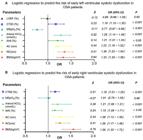
Logistic regression analysis of early left and right ventricular systolic dysfunction in obstructive sleep apnea (OSA) patients. The vertical axis represents variables included in the logistic regression analysis and the horizontal axis shows the odds ratio (OR) and 95% confidence interval (CI). A, Early left ventricular systolic dysfunction: percentage of sleep time with oxygen saturation <90% (CT90%), mean oxygen saturation (MSpO2), arterial blood HCO3-, apnea-hypopnea index (AHI), abdominal circumference (AC), neck circumference (NC), and body mass index (BMI) were significant independent predictors (P<0.05). LVEF did not show a significant correlation (P=0.60). B, Early right ventricular systolic dysfunction: CT90, AHI, AC, NC, and BMI were significant independent predictors (P<0.05). MSpO2 did not show a significant correlation (P=0.66). LVEF: left ventricular ejection fraction.
For early right ventricular systolic dysfunction (defined as RVFWLS<20%), significant parameters included BMI, neck circumference, waist circumference, AHI, arterial blood HCO3-, and CT90%, all of which were significantly correlated with reduced RVFWLS. MSpO2 did not show a significant correlation with the occurrence of early right ventricular systolic dysfunction (P=0.66) (Figure 4B).
Prediction of early left and right ventricular systolic dysfunction in OSA patients using the QUEST decision tree
The QUEST decision tree was used to predict the risk of early left and right ventricular systolic dysfunction in OSA patients based on significant parameters.
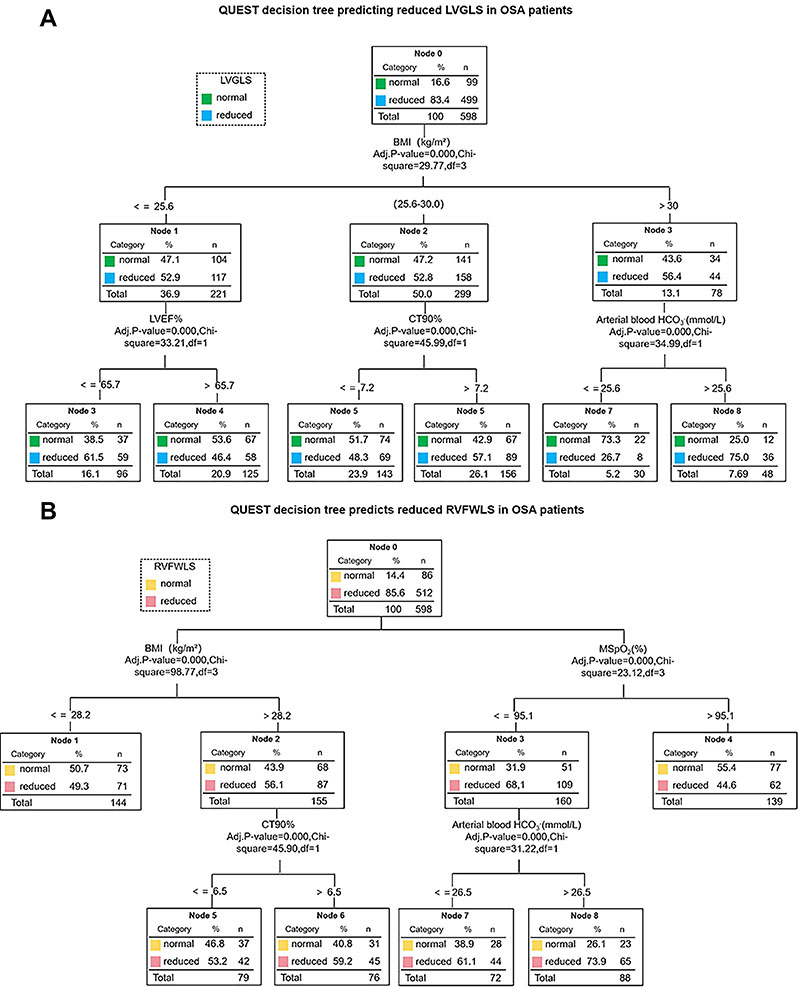
For early left ventricular systolic dysfunction (LVGLS<20%), the key nodes were BMI, arterial blood HCO3-, LVEF, and CT90%. BMI was the first splitting variable, with patients having higher BMI (>0) showing a 93.4% risk of LVGLS reduction (Node 3). In patients with BMI between 25.6 and 30.0, CT90% further divided the samples, with those having CT90%>7.2 showing 57.1% LVGLS reduction (Node 5). For patients with BMI ≤25.6, LVEF was the main splitting factor, with those having LVEF≤65.7% showing 61.5% LVGLS reduction (Node 3). Additionally, for patients with BMI>30, arterial blood HCO3->25.6 was associated with 75.0% LVGLS reduction (Node 8) (Figure 5A).
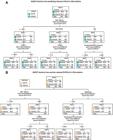
QUEST decision tree-based prediction models for left ventricular global longitudinal strain (LVGLS) and right ventricular free wall longitudinal strain (RVFWLS) reduction in obstructive sleep apnea (OSA) patients. A, The primary splitting variable for LVGLS reduction was body mass index (BMI), followed by mean oxygen saturation (MSpO2), percentage of sleep time with oxygen saturation <90% (CT90%), and arterial blood HCO3-. Each node represents the proportion and sample size, demonstrating how each variable stratifies the risk for LVGLS reduction. B, The primary splitting variables for RVFWLS reduction were BMI and MspO2, followed by CT90% and arterial blood HCO3-. Each node represents the proportion and sample size, showing how each variable influences the risk for RVFWLS reduction.
For early right ventricular systolic dysfunction (RVFWLS<20%), the key nodes were BMI, arterial blood HCO3-, MspO2, and CT90%. BMI was the first splitting variable, with patients having higher BMI (>28.2) showing 56.1% RVFWLS reduction (Node 2). In patients with BMI>28.2, MSpO2 was a significant factor, with MSpO2≤95.1 associated with 68.1% RVFWLS reduction (Node 3). For those with BMI≤28.2, CT90 divided the samples, with those having CT90≤6.5 showing 53.2% RVFWLS reduction (Node 5). Additionally, in patients with MSpO2≤95.1, arterial blood HCO3->26.5 was linked to 73.9% RVFWLS reduction (Node 8) (Figure 5B).
Prediction of early left and right ventricular systolic dysfunction in OSA patients based on logistic regression combined with the QUEST decision tree
Combining the results from logistic regression analysis and the QUEST decision tree, key parameters associated with early left and right ventricular systolic dysfunction were identified and used to construct predictive models for LVGLS and RVFWLS reduction in OSA patients.
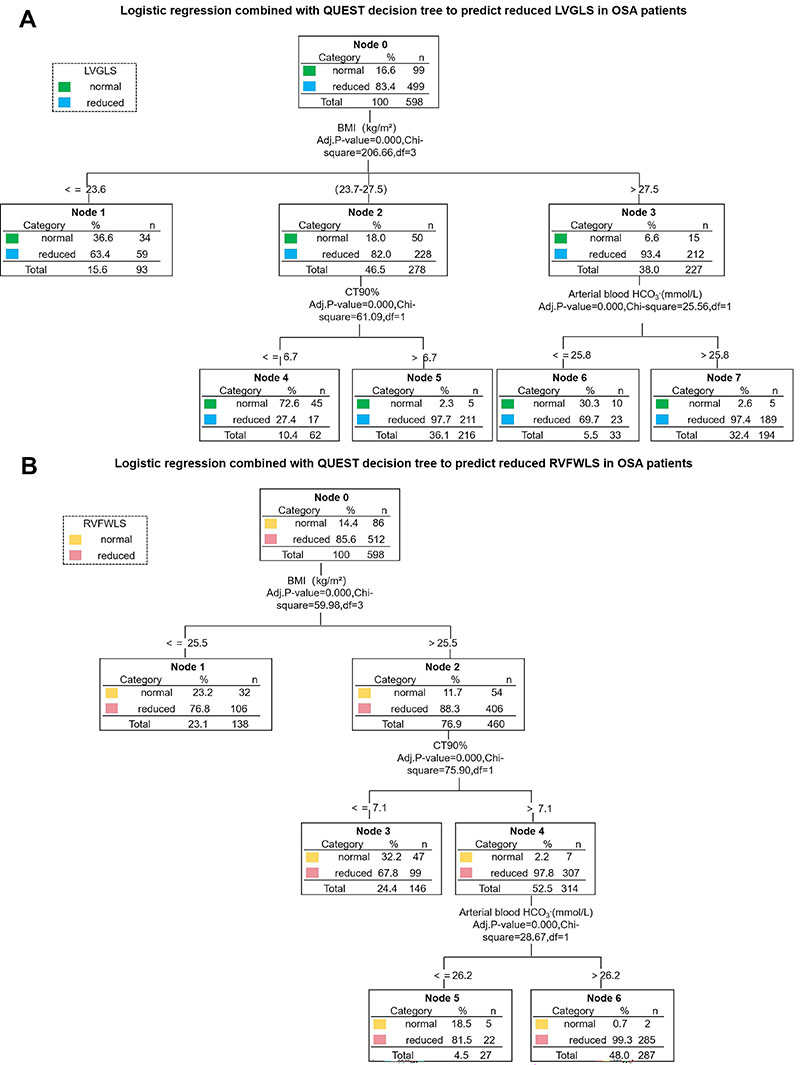
For early left ventricular systolic dysfunction (LVGLS<20%), BMI, arterial blood HCO3-, and CT90% were selected as key parameters. BMI was the primary splitting variable (P<0.001, χ2=76.12), dividing the samples into two groups: BMI≤26.2 (Node 1) and BMI>26.2 (Node 2). The LVGLS reduction rate was 41.9% in the BMI≤26.2 group and 67.3% in the BMI>26.2 group. In patients with BMI>26.2, arterial blood HCO3- further refined the samples (P<0.001, χ2=34.89), with 58.4% of those with HCO3-≤25.8 showing LVGLS reduction (Node 3) compared to 81.6% of those with HCO3->25.8 (Node 4). In patients with BMI≤26.2, CT90% was the next splitting variable (P<0.001, χ2=29.03), with 56.2% of those with CT90%>7.1 showing LVGLS reduction (Node 5), while only 33.7% of those with CT90%≤7.1 had LVGLS reduction (Node 6) (Figure 6A).
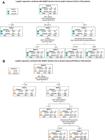
Logistic and QUEST combined models for predicting left ventricular global longitudinal strain (LVGLS) and right ventricular free wall longitudinal strain (RVFWLS) reduction in obstructive sleep apnea (OSA) patients. A, Decision tree for predicting LVGLS reduction based on key variables (BMI, arterial blood HCO3-, CT90%) identified by logistic regression and QUEST decision tree. The model stratifies risk with BMI as the primary variable, followed by arterial blood HCO3- and CT90%. Each node shows proportions for normal and reduced LVGLS. B, Decision tree for predicting RVFWLS reduction based on QUEST decision tree. BMI is the primary splitting variable, followed by CT90% and arterial blood HCO3-, highlighting their roles in risk stratification. Each node shows proportions for normal and reduced RVFWLS, illustrating the impact of each variable on risk.
For early right ventricular systolic dysfunction (RVFWLS<20%), BMI, arterial blood HCO3-, and CT90% were also identified as key parameters. BMI was the first splitting variable (P<0.001, χ2=59.98), dividing the samples into BMI≤25.5 (Node 1) and BMI>25.5 (Node 2). The RVFWLS reduction rate was 76.8% in the BMI≤25.5 group and 88.3% in the BMI>25.5 group. In patients with BMI>25.5, CT90% further split the samples (P<0.001, χ2=75.90), with 67.8% of those with CT90%≤7.1 showing RVFWLS reduction (Node 3) compared to 97.8% of those with CT90%>7.1 (Node 4). In patients with CT90%>7.1, arterial blood HCO3- further split the samples (P<0.001, χ2=28.67), with 81.5% of those with HCO3-≤26.2 showing RVFWLS reduction (Node 5), compared to 99.3% of those with HCO3->26.2 (Node 6) (Figure 6B).
Evaluation of predictive performance of single and combined models for early myocardial contractile dysfunction in OSA patients
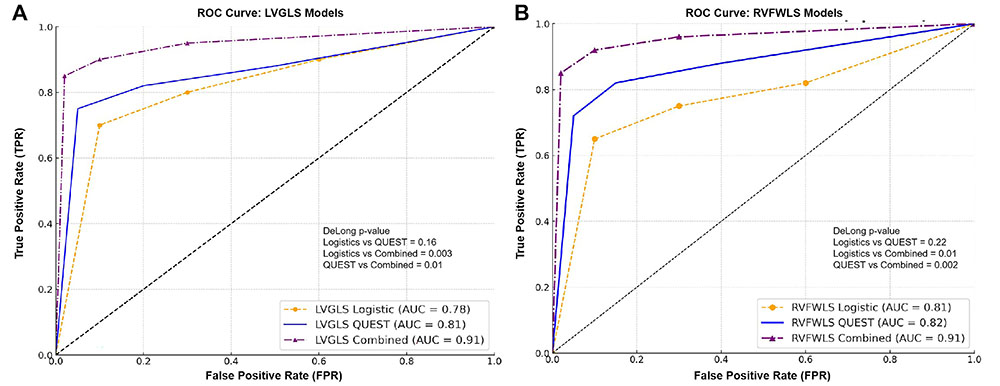
To assess the predictive performance of single and combined models for early myocardial contractile dysfunction in OSA patients, we evaluated the logistic regression model, the QUEST decision tree model, and their combined model using ROC curve analysis. For predicting LVGLS reduction, the logistic regression model yielded an AUC of 0.78, while the QUEST decision tree model showed an improved AUC of 0.81, demonstrating its superior predictive ability. The combined model outperformed both, achieving the highest AUC of 0.91. Similarly, for predicting RVFWLS reduction, the logistic regression model had an AUC of 0.81, the QUEST decision tree model had an AUC of 0.82, and the combined model again demonstrated optimal performance with an AUC of 0.91, confirming its best predictive capability (Figure 7).
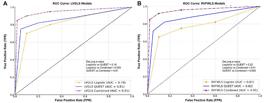
Evaluation of diagnostic performance of models in predicting early myocardial impairment in obstructive sleep apnea (OSA) patients. Panels show the ROC curves and area under the curve (AUC) values for the logistic regression model, QUEST decision tree model, and their combined model in predicting left ventricular global longitudinal strain (LVGLS) (A) and right ventricular free wall longitudinal strain (RVFWLS) (B) reduction.
External validation of the combined logistic regression and QUEST decision tree model in predicting myocardial injury in OSA patients
To further validate the applicability and effectiveness of the combined logistic regression and QUEST decision tree model for predicting early myocardial injury in OSA patients, an external testing study was conducted.
Sample source
The external testing sample included 100 OSA patients prospectively recruited from the respiratory sleep clinic of the Third Affiliated Hospital of Anhui Medical University, consisting of 36 mild and 64 moderate-to-severe cases to ensure representation across various severity levels.
Key parameters
Data on key variables related to the model, including BMI, CT90%, arterial blood HCO3-, as well as LVGLS and RVFWLS from echocardiography, were collected.
Statistical analysis
A random sample of 100 cases from the original dataset, matched to the external testing sample, was used for comparison. Ten parameters - BMI, neck circumference, waist circumference, AHI, MspO2, CT90%, arterial blood HCO3-, LVEF, LVGLS, and RVFWLS - were analyzed using Bland-Altman plots to assess the consistency between the external testing and internal datasets. ROC curve analysis evaluated the diagnostic performance of each model, and the DeLong test compared the AUC differences between the models.
Results
Compared to the mild OSA group, the moderate OSA group showed significantly higher BMI, waist circumference, AHI, CT90%, and HCO3- (P<0.001), along with significantly reduced LVGLS and RVFWLS (P<0.05) (Table 8). In the comparison between the normal and reduced LVGLS groups, BMI, waist circumference, AHI, CT90%, and HCO3- were significantly higher in the LVGLS reduction group (P<0.001) (Table 9). A similar pattern was observed between the normal and reduced RVFWLS groups, with significantly higher values of BMI, waist circumference, AHI, CT90%, and HCO3- in the RVFWLS reduction group (P<0.001) (Table 10).
Comparison of various data between the normal and reduced LVGLS groups in obstructive sleep apnea patients from the external dataset.
Comparison of various parameters between the normal and reduced RVFWLS groups in the external dataset of obstructive sleep apnea patients.
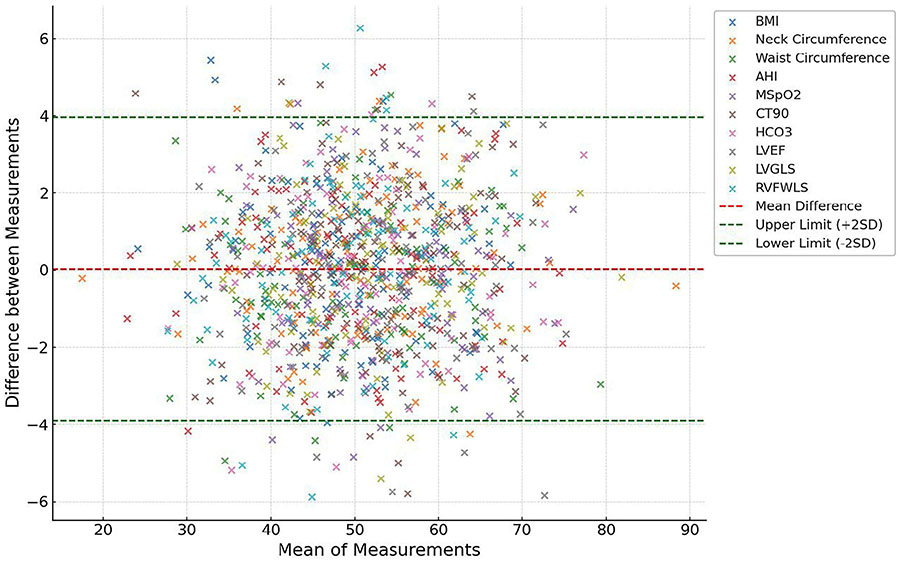
The Bland-Altman plot (Figure 8) was used to demonstrate the consistency between the external testing set and the internal dataset. The plot centered around the ±2SD range, indicating good overall consistency of parameters between the two datasets. The mean difference (red dashed line) for each parameter was close to zero, reflecting minimal systemic bias, and most points fell between the -2SD and +2SD lines, suggesting high measurement consistency. However, certain parameters, such as AHI and CT90%, showed some points near or beyond the ±2SD range, indicating possible larger measurement discrepancies or extreme values in specific cases.
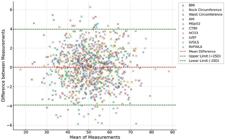
Bland-Altman analysis plots for each parameter in the external test set. The red dashed line represents the mean difference (bias) and the green dashed lines indicate the upper and lower limits (±2SD). The plots demonstrate that differences between external parameters and the internal test dataset fall within the predetermined range of agreement, indicating high consistency. BMI: body mass index; AHI: apnea hypopnea index; MSpO2: mean pulse oxygen saturation; CT90%: cumulative percentage of the time spent at saturations below 90%; LVEF: left ventricular ejection fraction; LVGLS: left ventricular global longitudinal strain; RVFWLS: right ventricular free wall longitudinal strain.
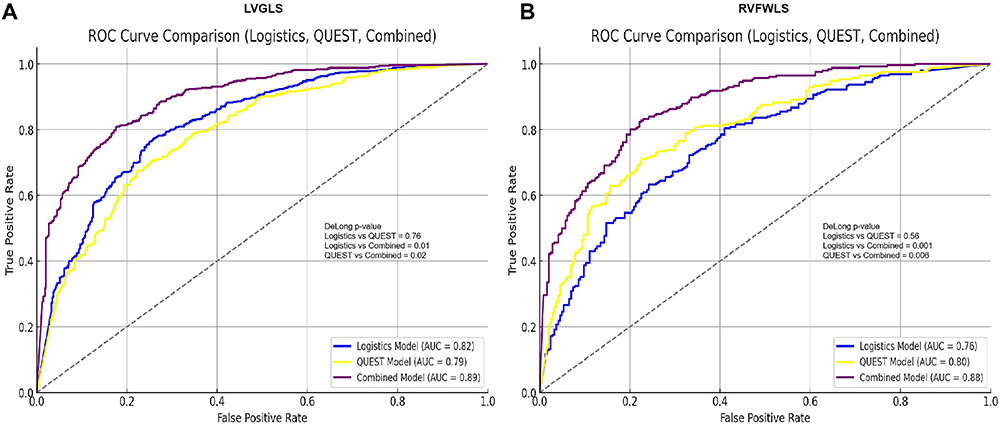
Diagnostic performance (Figure 9) revealed that for the prediction of LVGLS reduction, the AUC of the logistic regression model was 0.82, while the AUC for the QUEST decision tree model was 0.79. The combined model showed a significantly higher AUC of 0.89. DeLong test results indicated no significant difference between the logistic regression and QUEST models (P=0.76), but both models showed statistically significant differences when compared to the combined model (P=0.01 and P=0.02), demonstrating the superior predictive performance of the combined model.
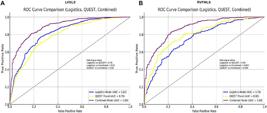
Diagnostic performance of logistic regression, QUEST decision tree, and combined models in predicting left ventricular global longitudinal strain (LVGLS) and right ventricular free wall longitudinal strain (RVFWLS) reduction in obstructive sleep apnea (OSA) patients. A, ROC curves for predicting LVGLS reduction. B, ROC curves for predicting RVFWLS reduction.
For the prediction of RVFWLS reduction, the AUC for the logistic regression model was 0.76, the QUEST decision tree model had an AUC of 0.80, and the combined model achieved an AUC of 0.88. The DeLong test showed no significant difference between the logistic regression and QUEST models (P=0.56), but both models showed significantly lower AUC values compared to the combined model (P=0.001 and P=0.006), further confirming the optimal performance of the combined model in predicting myocardial injury in OSA patients.
Discussion
This study provides a comprehensive evaluation of myocardial function in patients with OSA and explores the factors influencing early myocardial contractile dysfunction. By developing a combined predictive model using logistic regression and the QUEST decision tree, the study offers valuable insights into the mechanisms underlying myocardial injury in OSA and highlights the potential for early intervention and precision treatment.
Artificial intelligence (AI) techniques have already been applied to OSA, primarily focusing on predicting obstructive sleep apnea syndrome using data sources other than the gold standard (PSG), such as anthropometric indices, trachea/respiratory sounds, imaging data, ECG, EEG, oximetry, and screening questionnaires. AI has also been employed to predict treatment outcomes, evaluate treatment efficacy, and personalize treatment (13- 17). Our study represents the first application of AI in the early detection of myocardial dysfunction potentially induced by OSA.
Our findings demonstrated significant impairment in both LVGLS and RVFWLS in OSA patients, with this dysfunction worsening as the severity of the disease increases. Moderate-to-severe OSA patients exhibited significantly lower LVGLS and RVFWLS compared to mild OSA patients, though some decline was already evident in the mild group. This suggests that myocardial dysfunction may begin in the early stages of OSA, and that more pronounced dysfunction occurs as the disease progresses (18- 20). These results support previous studies that have identified early myocardial dysfunction in OSA and emphasize the importance of early identification and timely intervention to prevent further damage to myocardial function.
From a mechanistic perspective, myocardial dysfunction in OSA is likely driven by a combination of factors (21). The recurrent and intermittent nocturnal hypoxia characteristic of OSA leads to systemic oxidative stress and inflammatory responses, which can directly damage myocardial cells (22,23). Additionally, OSA patients often exhibit metabolic abnormalities, such as increased BMI and lipid metabolism disorders (24,25), which further exacerbate structural and functional myocardial damage. This study identified BMI, CT90%, and arterial blood HCO3- as independent predictors of myocardial dysfunction in OSA patients. In particular, increased BMI and prolonged CT90% reflected the core role of obesity and hypoxia in driving myocardial injury, underscoring the importance of managing these risk factors in OSA patients.
To better understand the relationships between these complex factors, we employed a combined approach using multivariable logistic regression and QUEST decision tree analysis. Logistic regression helped quantify the independent contributions of key variables, such as BMI, CT90%, and arterial blood HCO3-, to myocardial dysfunction. For instance, a 1 kg/m2 increase in BMI was associated with a significantly higher risk of LVGLS reduction, while elevated levels of arterial blood HCO3- suggested that the patient's compensatory metabolic mechanisms may be overwhelmed. In contrast, the QUEST decision tree revealed nonlinear relationships and interaction effects between variables, providing a more nuanced understanding of how factors such as BMI and CT90% interact to increase myocardial risk. This dual approach, combining linear and nonlinear models, not only enhanced the predictive accuracy of our model but also improved its interpretability and clinical applicability (26).
In terms of diagnostic performance, the combined model outperformed both the logistic regression and QUEST decision tree models alone. The AUC for predicting LVGLS and RVFWLS reductions was 0.91 for the combined model, significantly higher than the AUCs of 0.78 and 0.81 for the logistic regression and QUEST models, respectively. This suggests that integrating the strengths of both models provides a more comprehensive assessment of the multiple factors influencing myocardial dysfunction in OSA, improving the accuracy and reliability of risk stratification. By more accurately identifying high-risk patients, the combined model offers valuable guidance for clinicians in tailoring treatment strategies (27).
External validation further supported the robustness and generalizability of the combined model. The AUCs for the external dataset remained high, demonstrating that the model's predictive performance was stable across different populations and clinical settings. This suggests that the combined model has strong potential for real-world applications, extending beyond the internal dataset used in this study.
This study also underscored the clinical significance of monitoring key indicators such as BMI, CT90%, and arterial blood HCO3- in OSA patients. These variables not only exhibit high reproducibility and measurability but also reflect the overall health status and disease progression. For example, patients with elevated BMI may benefit from proactive weight management, including dietary interventions and exercise, to reduce cardiovascular risk and improve sleep quality (28). For patients with elevated CT90%, intensified CPAP therapy could help alleviate hypoxia and reduce myocardial strain (29). Furthermore, dynamic monitoring of arterial blood HCO3- levels may provide valuable insights into a patient's metabolic status, guiding therapeutic decisions and optimizing treatment outcomes (30).
However, several limitations must be acknowledged. The study sample primarily consisted of symptomatic OSA patients from a sleep clinic, with a higher proportion of moderate-to-severe cases. This may introduce sample bias, limiting the generalizability of our findings to patients with mild OSA. Additionally, the study was cross-sectional in design, and no long-term follow-up was conducted to track changes in myocardial function over time, limiting our ability to draw causal inferences. Furthermore, the underlying mechanisms of some variables, such as the increase in arterial blood HCO3-, require further investigation to clarify whether it was a direct result of metabolic compensation or influenced by other factors. Finally, while we did observe patients with biventricular dysfunction in our study, this investigation specifically focused on early myocardial dysfunction in OSA. Given the exceptionally low prevalence of biventricular impairment in the mild OSA subgroup (insufficient sample size) and its predominant association with moderate-to-severe cases, no further mechanistic investigations or in-depth analyses were conducted on this subset.
Future research should address these limitations by expanding the sample size and validating the model's generalizability through multicenter studies. Longitudinal studies would also help explore temporal changes in myocardial function and their relationship with therapeutic interventions in OSA patients. Moreover, further basic research is needed to elucidate the mechanistic roles of key variables, providing a more solid theoretical foundation for personalized treatment. Finally, incorporating advanced machine learning and AI techniques into predictive models could further enhance their clinical utility and accuracy.
In conclusion, this study developed an integrated predictive model that effectively assessed early myocardial dysfunction in OSA patients by combining logistic regression and the QUEST decision tree. The study highlights the critical roles of BMI, CT90%, and arterial blood HCO3- as predictive factors, offering important insights for early risk stratification and personalized treatment. The superior diagnostic performance of the combined model suggests it has strong potential for clinical application. With further optimization and validation, this model could become an essential tool for improving the long-term health outcomes of OSA patients.
Acknowledgments
The authors thank all the subjects for their participation in this study.
References
-
1 Kapur VK, Auckley DH, Chowdhuri S, Kuhlmann DC, Mehra R, Ramar K, et al. Clinical practice guideline for diagnostic testing for adult obstructive sleep apnea: an American academy of sleep medicine clinical practice guideline. J Clin Sleep Med. 2017;13(3):479-504, doi: 10.5664/jcsm.6506.
» https://doi.org/10.5664/jcsm.6506 -
2 Yeghiazarians Y, Jneid H, Tietjens JR, Redline S, Brown DL, El-Sherif N, et al. Obstructive sleep apnea and cardiovascular disease: a scientific statement from the American Heart Association. Circulation. 2021;144(3):e56-e67, doi: 10.1161/CIR.0000000000000988.
» https://doi.org/10.1161/CIR.0000000000000988 -
3 Yue F, Yang HZ, Hao YY, Chen H, Zhang JY, Hu K. A long-term follow-up study of noninvasive positive pressure ventilation on all-cause mortality in patients with chronic obstructive pulmonary disease-obstructive sleep apnea overlap syndrome [in Chinese]. Zhonghua Jie He He Hu Xi Za Zhi. 2023;46(4):373-9, doi: 10.3760/cma.j.cn112147-20220808-00663.
» https://doi.org/10.3760/cma.j.cn112147-20220808-00663 -
4 Zhang Y, Tan Y, Liu T, Fu Y, Lin Y, Shi J, et al. Decreased ventricular systolic function in chemotherapy-naive patients with acute myeloid leukemia: a three-dimensional speckle-tracking echocardiography study. Front Cardiovasc Med. 2023;10:1140234, doi: 10.3389/fcvm.2023.1140234.
» https://doi.org/10.3389/fcvm.2023.1140234 -
5 Liu R, Xu LA, Zhao Z, Han R. Application of two-dimensional speckle-tracking echocardiography in radiotherapy-related cardiac systolic dysfunction and analysis of its risk factors: a prospective cohort study. BMC Cardiovasc Disord. 2024;24(1):328, doi: 10.1186/s12872-024-03981-1.
» https://doi.org/10.1186/s12872-024-03981-1 -
6 Li JR, Gao XH, Han JQ, Wang GY, Kang LY, Ji ES. Zhongguo Ying Yong Sheng Li Xue Za Zhi. 2018;34(5):457-61, doi: 10.12047/j. cjap.5707.2018.103.
» https://doi.org/10.12047/j. cjap.5707.2018.103 -
7 Chang YS, Yee BJ, Hoyos CM, Wong KK, Sullivan DR, Grunstein RR, et al. The effects of continuous positive airway pressure therapy on Troponin-T and N-terminal pro B-type natriuretic peptide in patients with obstructive sleep apnoea: a randomised controlled trial. Sleep Med. 2017;39:8-13, doi: 10.1016/j.sleep.2017.08.007.
» https://doi.org/10.1016/j.sleep.2017.08.007 -
8 Chen NH, Johns MW, Li HY, Chu CC, Liang SC, Shu YH, et al. Validation of a Chinese version of the Epworth sleepiness scale. Qual Life Res. 2002;11(8):817-21, doi: 10.1023/a:1020818417949.
» https://doi.org/10.1023/a:1020818417949 -
9 Nagappa M, Liao P, Wong J, Auckley D, Ramachandran SK, Memtsoudis S, et al. Validation of the STOP-Bang questionnaire as a screening tool for obstructive sleep apnea among different populations: a systematic review and meta-analysis. PloS One. 2015;10(12):e0143697, doi: 10.1371/journal.pone.0143697.
» https://doi.org/10.1371/journal.pone.0143697 -
10 Duan X, Zheng M, Zhao W, Huang J, Lao L, Li H, et al. Associations of depression, anxiety, and life events with the risk of obstructive sleep apnea evaluated by Berlin questionnaire. Front Med (Lausanne). 2022;9:799792, doi: 10.3389/fmed.2022.799792.
» https://doi.org/10.3389/fmed.2022.799792 -
11 Recommendations for cardiac chamber quantification by echocardiography in adults: an update from the American Society of Echocardiography and the European Association of, Cardiovascular Imaging. Eur Heart J Cardiovasc Imaging. 2016;17(4):412, doi: 10.1093/ehjci/jew041.
» https://doi.org/10.1093/ehjci/jew041 - 12 von Elm E, Altman DG, Egger M, Pocock SJ, Gøtzsche PC, Vandenbroucke JP, et al. The Strengthening the Reporting of Observational Studies in Epidemiology (STROBE) statement: guidelines for reporting observational studies. Ann Intern Med. 2007;147: 573-7.
-
13 May J, Malkani RG. Artificial intelligence for diagnosis of obstructive sleep apnea. Curr Pulmonol Rep. 2024;13:297-309, doi: 10.1007/s13665-024-00361-0.
» https://doi.org/10.1007/s13665-024-00361-0 -
14 Bazoukis G, Bollepalli SC, Chung CT, Li X, Tse G, Bartley BL, et al. Application of artificial intelligence in the diagnosis of sleep apnea. J Clin Sleep Med. 2023;19(7):1337-63, doi: 10.5664/jcsm.10532.
» https://doi.org/10.5664/jcsm.10532 -
15 Huo J, Quan SF, Roveda J, Li A. BASH-GN: a new machine learning-derived questionnaire for screening obstructive sleep apnea. Sleep Breath. 2023;27(2):449-57, doi: 10.1007/s11325-022-02629-8.
» https://doi.org/10.1007/s11325-022-02629-8 -
16 Conte L, De Nunzio G, Giombi F, Lupo R, Arigliani C, Leone F, et al. Machine learning models to enhance the Berlin questionnaire detection of obstructive sleep apnea in at-risk patients. Appl Sci. 2024;14:5959, doi: 10.3390/app14135959.
» https://doi.org/10.3390/app14135959 -
17 De Nunzio G, Conte L, Lupo R, Vitale E, Calabrò A, Ercolani M, et al. A new Berlin questionnaire simplified by machine learning techniques in a population of italian healthcare workers to highlight the suspicion of obstructive sleep apnea. Front Med (Lausanne). 2022;9:866822, doi: 10.3389/fmed.2022.866822.
» https://doi.org/10.3389/fmed.2022.866822 -
18 Li T, Ou Q, Zhou X, Wei X, Cai A, Li X, et al. Left ventricular remodeling and systolic function changes in patients with obstructive sleep apnea: a comprehensive contrast-enhanced cardiac magnetic resonance study. Cardiovasc Diagn Ther. 2022;12(4):436-52, doi: 10.21037/cdt-22-38.
» https://doi.org/10.21037/cdt-22-38 -
19 Lévy P, Naughton MT, Tamisier R, Cowie MR, Bradley TD. Sleep apnoea and heart failure. Eur Respir J. 2022;59(5):2101640, doi: 10.1183/13993003.01640-2021.
» https://doi.org/10.1183/13993003.01640-2021 -
20 Raut S, Gupta G, Narang R, Ray A, Pandey RM, Malhotra A, et al. The impact of obstructive sleep apnoea severity on cardiac structure and injury. Sleep Med. 2021;77:58-65, doi: 10.1016/j.sleep.2020.10.024.
» https://doi.org/10.1016/j.sleep.2020.10.024 -
21 Wang N, Su X, Sams D, Prabhakar NR, Nanduri J. P300/CBP regulates HIF-1-dependent sympathetic activation and hypertension by intermittent hypoxia. Am J Respir Cell Mol Biol. 2024;70(2):110-8, doi: 10.1165/rcmb.2022-0481OC.
» https://doi.org/10.1165/rcmb.2022-0481OC -
22 Sun M, Liang C, Lin H, Chen Z, Wang M, Fang S, et al. Association between the atherogenic index of plasma and left ventricular hypertrophy in patients with obstructive sleep apnea: a retrospective cross-sectional study. Lipids Health Dises. 2024;23(1):185, doi: 10.1186/s12944-024-02170-5.
» https://doi.org/10.1186/s12944-024-02170-5 -
23 Tadic M, Cuspidi C. Obstructive sleep apnea and right ventricular remodeling: do we have all the answers? J Clin Med. 2023;1(6):2421, doi: 10.3390/jcm12062421.
» https://doi.org/10.3390/jcm12062421 -
24 Zhang M, Weng X, Xu J, Xu X. Correlation between obstructive sleep apnea and weight-adjusted-waist index: a cross-sectional study. Front Med (Lausanne). 2024;11:1463184, doi: 10.3389/fmed.2024.1463184.
» https://doi.org/10.3389/fmed.2024.1463184 -
25 Wei Z, Tian L, Xu H, Li C, Wu K, Zhu H, et al. Relationships between apolipoprotein E and insulin resistance in patients with obstructive sleep apnoea: a large-scale cross-sectional study. Nutrit Metab (Lond). 2024;1(1):40, doi: 10.1186/s12986-024-00816-w.
» https://doi.org/10.1186/s12986-024-00816-w -
26 Lin CX, Li HD, Wang J. LIMO-GCN: a linear model-integrated graph convolutional network for predicting Alzheimer disease genes. Brief Bioinform. 2024;26(1):bbae611, doi: 10.1093/bib/bbae611.
» https://doi.org/10.1093/bib/bbae611 -
27 Prybutok AN, Cain JY, Leonard JN, Bagheri N. Fighting fire with fire: deploying complexity in computational modeling to effectively characterize complex biological systems. Curr Opin Biotechnol. 2022;75:102704, doi: 10.1016/j.copbio.2022.102704.
» https://doi.org/10.1016/j.copbio.2022.102704 -
28 Joosten SA, Hamilton GS, Naughton MT. Impact of weight loss management in OSA. Chest. 2017;152(1):194-203, doi: 10.1016/j.chest.2017.01.027.
» https://doi.org/10.1016/j.chest.2017.01.027 -
29 Silva C, Iranzo A, Maya G, Serradell M, Muãoz-Lopetegi A, Marrero-González P, et al. Stridor during sleep: description of 81 consecutive cases diagnosed in a tertiary sleep disorders center. Sleep. 2021;44(3):zsaa191, doi: 10.1093/sleep/zsaa191.
» https://doi.org/10.1093/sleep/zsaa191 -
30 Berger KI, Ayappa I, Sorkin IB, Norman RG, Rapoport DM, Goldring RM. Postevent ventilation as a function of CO (2) load during respiratory events in obstructive sleep apnea. J Appl Physiol (1985). 2002;93(3):917-24, doi: 10.1152/japplphysiol.01082.2001.
» https://doi.org/10.1152/japplphysiol.01082.2001