Abstract
cDNA microarray is an innovative technology that facilitates the analysis of the expression of thousands of genes simultaneously. The utilization of this methodology, which is rapidly evolving, requires a combination of expertise from the biological, mathematical and statistical sciences. In this review, we attempt to provide an overview of the principles of cDNA microarray technology, the practical concerns of the analytical processing of the data obtained, the correlation of this methodology with other data analysis methods such as immunohistochemistry in tissue microarrays, and the cDNA microarray application in distinct areas of the basic and clinical sciences.
Biotechnology; cDNA microarray; Gene expression; Genomics
Braz J Med Biol Res, October 2005, Volume 38(10) 1543-1552 (Review)
A conceptual and practical overview of cDNA microarray technology: implications for basic and clinical sciences
 V. de Mello-Coelho and K.L. Hess
Departamento de Histologia e Embriologia, Instituto de Ciências Biomédicas, Universidade Federal do Rio de Janeiro, Rio de Janeiro, RJ, Brasil
 Text
Text
References
Correspondence and Footnotes
Correspondence and Footnotes
Correspondence and Footnotes

cDNA microarray is an innovative technology that facilitates the analysis of the expression of thousands of genes simultaneously. The utilization of this methodology, which is rapidly evolving, requires a combination of expertise from the biological, mathematical and statistical sciences. In this review, we attempt to provide an overview of the principles of cDNA microarray technology, the practical concerns of the analytical processing of the data obtained, the correlation of this methodology with other data analysis methods such as immunohistochemistry in tissue microarrays, and the cDNA microarray application in distinct areas of the basic and clinical sciences.
Abstract
Key words: Biotechnology, cDNA microarray, Gene expression, Genomics
Introduction
Genes are hereditary units formed by deoxyribonucleic acid (DNA) sequences organized in chromosomes in the cell nucleus. The intricate process of transcription from these sequences results in the generation of messenger ribonucleic acids (mRNA). These mRNA code for proteins, which are composed of amino acids, and carry out the designated function of the gene (1). Thus, the structural and functional features of cells and tissues are determined by the simultaneous, selective, and differential expression of thousands of genes.
Since the last decade, studies involving gene mapping, cloning, and sequencing have provided significant information for the structural analysis of distinct genomes (2,3). The quantity of information obtained from these investigations necessitates organization of the acquired data. To satisfy this need, public databases have been created to store millions of gene sequences and expressed sequences tags (ESTs), permitting accession to gene sequences for analysis of the similarities as well as the differences between genomes of distinct species (4).
Structural studies of genomes have raised numerous questions related to the functional and regulatory understanding of gene expression profiles in distinct cell types and tissues from various organisms (3,5,6). DNA microarray technology was developed to study the complex biological processing involving several thousand genes (7,8). One such microarray technology uses single DNA strands or probes (oligomers) which are imprinted onto a glass surface using photolithography (9). Another DNA microarray methodology, which is the focus of the present review, is complementary DNA (cDNA) microarray technology (10). With these methodologies it is possible 1) to simultaneously compare the dynamic expression pattern of thousands of genes in cells or tissues, 2) to detect molecular differences during distinct stages of cellular processes, e.g., differentiation, proliferation, and the induction of apoptosis, 3) to identify transcriptional differences between non-diseased and pathological conditions, 4) to identify changes in cells due to a drug response, and 5) to identify novel biomarkers for potential use in the diagnosis, prognosis and clinical therapy of diseases.
The principles of cDNA microarray technology
A classical methodology used for the detection and quantification of mRNA in a given cell is called Northern blot analysis (11). The main principle of Northern blot analysis is the hybridization of a radiolabeled gene-specific probe to mRNA bound to a filter, in order to determine if that gene is present. Another method used to detect expression of a specific gene is the reverse transcription polymerase chain reaction (RT-PCR). RT-PCR involves the use of gene-specific primers and reverse transcriptase to synthesize a cDNA sequence to the mRNA. The cDNA is then amplified by multiple rounds of polymerase-mediated transcription of this template cDNA (12). There are several types of RT-PCR and the most precise one in terms of quantification is the real-time RT-PCR method, which requires an automated system able to detect fluorescence induced during the RT-PCR reaction (12). During RT-PCR, the expression of a certain gene can be deduced by comparing it to constitutively expressed genes, also known as "housekeeping" genes.
cDNA microarray technology, which analyzes the gene expression levels of thousand of genes simultaneously, is based on the same principles as those for both Northern blot and RT-PCR analyses (7,8). Essentially, cDNA microarray is the hybridization of thousands of genes from cDNA to their corresponding targets on a chip or filter. However, the current challenge of this technology is to analyze the substantial amounts of raw numerical data obtained through the acquisition of hybridization signals (13). Computational and biostatistical analyses are necessary to accurately process significant data for the specific aims of the investigation (Figure 1).
Producing a cDNA microarray matrix
Recently, several companies have designed cDNA microarrays focused on specific gene expression profile systems. These matrices are commercially available by biotechnology companies, including SuperArray Bioscience Corporation and Affymetrix, for use at affordable prices. In this section, we attempt to describe the basic steps in the production of a cDNA microarray matrix.
The first step for producing a cDNA microarray matrix is selection and amplification of total or partial fragments of cDNA sequences to be printed on substrates, which will be subsequently hybridized with target cDNA sequences (14,15). The most common methods for selecting sequences are based on the following resources: 1) gene data banks such as Unigene, dbEST and GenBank, which give information about the specific gene's function and chromosome localization; 2) clone collections or available cDNA sequences in website homepages of commercial enterprises; 3) custom-made constructions of cDNA libraries from target cell or tissue material previously cloned and sequenced for EST identification. Once selected, cDNA fragments are amplified by PCR on multiwell microplates, purified by chemical precipitation, and then examined for quality and quantity by gel electrophoresis. The PCR products are printed onto a slide or membrane using a robotic machine, the microarrayer. During the robotic printing, or deposition, of the DNA, capillary tubes receive a constant pressure and serially deposit the DNA on the slide or membrane, thereby creating a "microarray" design (16). Various types of substrates, including glass slides and nylon membranes are pre-treated to augment their hydrophobic charges, thus resulting in an increase in the total adherence of DNA sequences to the substrates (13). Most importantly, data indexing containing the location of thousands of the cDNA clones printed on the substrates is performed by cautious labeling of each microplate using software designed for database analysis. This database also includes the clone identity (clone ID), the gene name, chromosome location, and gene function(s).
Hybridization of the cDNA probe with the target DNA microarray matrix
A crucial factor for successful hybridization of the cDNA probe to the target DNA microarray matrix relies on the quality of the mRNA from cells or tissues. Contaminants of the probe RNA with genomic DNA, proteins, or detergent residues may result in false-positive/false-negative data.
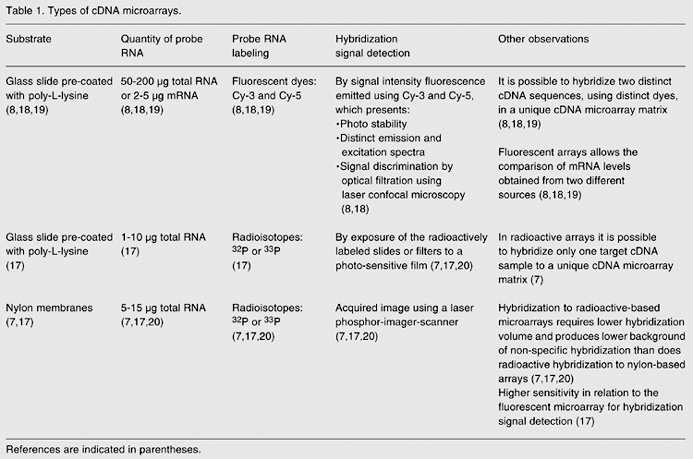
Labeling the probe during cDNA synthesis by reverse transcription of RNA sequences depends on the type of cDNA microarray being used (16). In general, when cDNA microarray analysis is performed using nylon membranes as the substrate, the probe RNA is radioactively labeled by incorporation of dCTP-P33 nucleotides during the process of reverse transcription (7). In the case of a cDNA microarray printed on glass slides, radioactive nucleotides (17) and fluorescent dyes with high efficiency rates of incorporation, such as the cyanines Cy-3 dUTP and Cy-5 dUTP, are used (8). For more information about types of cDNA microarrays and the hybridization process (7,8,17-20), see Table 1.
Analysis tools for the identification of gene expression patterns using cDNA microarray technology
Tools for the analysis of the massive amounts of data generated from cDNA microarrays are still being developed. Currently, investigators analyze cDNA microarray data using diverse software programs (21-24). This means that there is no single method for analyzing the massive quantity of data obtained using this technology. The use of biostatistical tools has become increasingly important in analyzing the significance of gene expression profiles.
To provide a general idea about some of the types of methods used to analyze cDNA microarray data, we will describe and discuss steps that could hinder the analysis process. Of the utmost importance is the validation of results by completing multiple replicate experiments. After acquisition of the hybridization signals, the substrates are examined visually using computational programs. In this case, the quality of the substrates is considered. For example, fuzzy spot images, dye precipitates, or samples with strong background signals are usually discarded. This analysis is important to eliminate artifacts, which can result in the detection of false-positive signals (16). Various investigators apply the method of background subtraction of the hybridization signals to the nonspecific signals in the background. In this step, depending on the software used, it is possible to subtract background signals in the following two ways: 1) by the arithmetic mean or median resulting from the signal intensity between the positive signals of spots in the substrate, or 2) by the arithmetic mean or median of the nonspecific signal, such as the signal intensity resulting from the immediate area around each spot corresponding to a specific gene signal. By these two methods, the arithmetic mean or median values are subtracted from the positive signal representing a differentially expressed gene (16). The acquisition of positive signal intensity in grids of localization created using specific software is completed in arbitrary values known as algorithms. These values can be accessed directly in the database software, which contains previously catalogued information of each gene printed on the substrate.
Due to the enormous quantity of simultaneously analyzed genes and the variability in all of the technical steps of the cDNA microarray technique, it is important to create a factor of adjustment or compensation, which is done through a data normalization process. The existence of nonspecific signals on the substrates, problems related to quantity or quality of the RNA prior to hybridization, or variability in probe incorporation of the RNA can all result in the impairment of sample normalization (14,16). For further meaningful interpretation of the data, the normalization process performs a comparative analysis of the arithmetic mean of the algorithms from an individual group with another, frequently chosen as a control (24,25). There are several types of normalization methods and selecting the most appropriate method can be a challenge. The reason for this is that multiple experimental variables often prevent the accurate identification of differentially expressed genes without false-positive/false-negative results contaminating the evaluation of the data. Mathematical, statistical, and bioinformatic support is critical at this stage in cDNA microarray technology.
Normalization methods include: 1) the logarithmic ratio of measured expression levels between distinct groups based on the mean, median, median differences, or variance obtained from all the positive signals located on the substrates; 2) regression analysis, which is evaluated through the correlation coefficient or Euclidian distance, and is based on the distribution represented by the algorithms corresponding to the signal intensities in the distinct samples of the same group, and 3) statistical tests such as the t-test or associative analysis, which consider multiple paired comparisons based on the significant threshold of P < 0.05 and t-test threshold significance correction, respectively (25,26). In addition, the locally weighted linear regression (lowess) normalization method, frequently used for fluorescent arrays, accounts for decreasing variations of intensity hybridization signals and spatial location of spotted cDNA on the slide (27).
After normalization, the simplest method to identify differences between patterns of gene expression is to use the ratio difference between a sample and its appropriate control. In this case, an arbitrary limit is established and from this value it is possible to select the differentially expressed genes using database software. For example, it is possible to establish a 2-fold threshold to identify genes with significant changes in expression level. During this process, the genes within this range will be selected and organized in tables located in the database. The genes meeting the selection criteria can be visualized from databases using software that shows self-organizing maps (28,29). Furthermore, these changes in the gene expression profiles between distinct groups can be visualized in dendrograms based on hierarchical clustering analysis (25,29,30). In this case, genes that are down-regulated are generally shown in green and up-regulated genes are generally shown in red. As the gene regulation difference is more intense, so is its respective color. Software programs to analyze cDNA microarray data are available via the Internet.
It is important to note that the analysis of gene expression profiles acquired by cDNA microarray technology involves thousands of genes being analyzed concurrently. Before doing physiologic studies of selected genes, the cDNA microarray results should be confirmed at the RNA level by Northern blot analysis or real time RT-PCR (14). This eliminates the possibility of false-positive cDNA microarray results due to cross-hybridization between genes within the same gene family. Further confirmation is also highly recommended at the protein level, such as by Western blot analysis, flow cytometry or immunohistochemistry. In this context, it is currently possible to evaluate genes at the protein level using tissue microarray assays (31-33). Tissue microarray assay is a method that allows the evaluation of up to one thousand tissues at once using a specific marker. Basically, small core biopsies of 1 mm or less are isolated from individual paraffin-embedded tissue blocks with a special metallic device or needle, and placed in another paraffin block in an arrayed manner. The advantages of this technique are: 1) the economy and preservation of the original tissue specimens obtained for biopsy to construct the array; 2) to avoid technical problems since the array is constructed in a single glass slide, thus facilitating the washing and staining technical processes, and 3) the speed to perform in situ analysis simultaneously in several tissue specimens at one time. Clinically, it is a powerful technique to use conjointly with cDNA microarray analysis to identify novel biomarkers for potential use as diagnostic, prognostic and therapeutic tools against pathological conditions (31,32).
cDNA microarray technology: applications and perspectives
In terms of application, cDNA microarray technology leads to the identification of specific genes and allows researchers to compare the profiles of gene expression in normal versus pathological conditions in various organisms. In basic science, cDNA microarray has been used to identify the role of several genes involved in cellular processes, such as cellular differentiation, through the comparison of gene expression patterns between normal and transfected cell cultures, for example (34). Many research groups have used cDNA microarray technology to study distinct types of cancers as well as the pathogenesis of infectious diseases (35-40). In this case, identification of novel genes or changes in the gene expression patterns in tissues from non-diseased to diseased state has contributed to better understanding the molecular mechanisms regulating onset and progress of diseases. Additionally, cDNA microarray has been considered a very interesting methodology in pharmaceutical industry. In this context, the analysis of gene expression profile in large scale of cells submitted to distinct drug tests could be relevant to classify potential agents for therapeutical use (41). Several examples of the application of cDNA microarray methodology in basic and clinical sciences (34-48) are described in Table 2.
cDNA microarray analysis is a costly methodology, but the abundance of results generated from this technology is an unquestionable payoff. Once a central research unit is organized for the development of this methodology, various researchers can enjoy the advantage of using previously printed cDNA microarray substrates to investigate differentially expressed genes in both biological and clinical areas. For the organization of cDNA microarray units, the multidisciplinary interaction between mathematical and biological arenas must be considered. A simple hypothetical schematic model demonstrating the infrastructure of a cDNA microarray unit is shown in Figure 2.
Finally, centralized banks containing data of gene expression profiles analyzed by cDNA microarray technology have been created and are available for inspection via the Internet (49,50). In this way, different groups all over the world will be able to compare data of selected gene profiles with others deposited in molecular data banks such as Gene Expression Omnibus or Array Express, designed by the European Bioinformatics Institute (51).
A problem that has restricted a beneficial interaction between various research groups using cDNA microarray technology is the lack of standards for presenting and exchanging results. To compensate for this predicament, the Minimal Information for the Annotation of a Microarray Experiment (MIAME) was created (52). Guidelines leading to the standardization of cDNA microarray experiments have been proposed by the Micro-array Gene Expression Data Society (MGED). MIAME is basically composed of six sections: 1) experimental design; 2) array design; 3) samples used, extract preparations, and hybridization; 4) procedures and parameters of hybridization; 5) image, quantification, and parameter measurement, and 6) types, values, and specifications for normalization controls. MIAME has become a requirement to publish cDNA microarray results in many scientific journals. Additionally, distinct groups including MGED, Rosetta, Agilent, and Affymetrix have worked together using bioinformatics to design microarray gene expression (MAGE), which is a common flexible structure platform that permits communication between different research groups using cDNA microarray technology. MAGE is composed of the following: 1) MAGE-ON (object model), a centric data model that uses unified modeling language and implements the MIAME requirements; 2) MAGE-ML (markup language), which documents translation from MAGE-OM to an XML-based data format, and 3) MAGE-SLK, a freely accessible software that defines the application programmers interface to MAGE-OM, thus allowing data export to MAGE-ML and subsequently resulting in the storage of data in a relational database (53).
Recently, nanotechnology has been widely implemented in various arenas, such as industrial, pharmaceutical and governmental applications, to improve modern scientific advancements. Due to the unique physical and chemical characteristics of nanoparticles, these materials have the ability to enhance sensory devices, propulsion additives, tissue remodeling techniques, and drug targeting mechanisms. Furthermore, nanotechnology has been utilized to improve microarray proficiency (54) and to assist in the development of protein nanoarrays (55). Within the laboratory setting, scientists are now beginning to investigate the potential positive/negative impact that nanoparticles have on the induction/inhibition of genes within cells by using the microarray technique (56). Finally, the combination of nanotechnology with microarray technology has even advanced the current knowledge of genes differentially regulated during disease processes (57,58).
Together, these tools can contribute to the understanding of novel gene functions in diverse genomes and of how they correlate with disease pathogenesis in humans. The development and application of cDNA microarray technology have brought a lot of progress to the discovery of drugs, research diagnostics, and potential gene therapy destined to the treatment of various diseases. This fundamental technology assists researchers in understanding the molecular mechanisms involved in multiple and diverse biological processes.
Address for correspondence: V. de Mello-Coelho, Departamento de Histologia e Embriologia, ICB, UFRJ, 21941-590 Rio de Janeiro, RJ, Brasil. Fax: +55-21-2562-6483. E-mail: coelhova@histo.ufrj.br
Presented at SIMEC 2004 (International Symposium on Extracellular Matrix), Angra dos Reis, RJ, Brazil, September 27-30, 2004. Received March 28, 2005. Accepted July 22, 2005.
- 1. Sweeney BP (2004). Watson and Crick 50 years on. From double helix to pharmacogenomics. Anaesthesia, 59: 150-165.
- 2. Katsanis N, Worley KC & Lupski JR (2001). An evaluation of the draft human genome sequence. Nature Genetics, 29: 88-91.
- 3. Kim SK, Lund J, Kiraly M et al. (2001). A gene expression map for Caenorhabditis elegans Science, 293: 2087-2092.
- 4. Adams MD, Kelley JM, Gocayne JD et al. (1991). Complementary DNA sequencing: expressed sequence tags and human genome project. Science, 252: 1651-1656.
- 5. Shoemaker DD, Schadt EE, Armour CD et al. (2001). Experimental annotation of the human genome using microarray technology. Nature, 409: 922-927.
- 6. Raghuraman MK, Winzeler EA, Collingwood D et al. (2001). Replication dynamics of the yeast genome. Science, 294: 115-121.
- 7. Lennon GG & Lehrach H (1991). Hybridization analyses of arrayed cDNA libraries. Trends in Genetics, 7: 314-317.
- 8. Schena M, Shalon D, Davis RW et al. (1995). Quantitative monitoring of gene expression patterns with a complementary DNA microarray. Science, 270: 467-470.
- 9. Sengupta R & Tompa M (2002). Quality control in manufacturing oligo arrays: a combinatorial design approach. Journal of Computational Biology, 9: 1-22.
- 10. Weeraratna AT, Nagel JE, de Mello-Coelho V et al. (2004). Gene expression profiling: from microarrays to medicine. Journal of Clinical Immunology, 24: 213-224.
- 11. Alwine JC, Kemp DJ & Stark GR (1977). Method for detection of specific RNAs in agarose gels by transfer to diazobenzyloxymethyl-paper and hybridization with DNA probes. Proceedings of the National Academy of Sciences, USA, 74: 5350-5354.
- 12. Bustin A (2000). Absolute quantification of mRNA using real-time reverse transcription polymerase chain reaction assays. Journal of Molecular Endocrinology, 25: 169-193.
- 13. Schulze A & Downward J (2001). Navigating gene expression microarrays - a technology review. Nature Cell Biology, 3: E190-E195.
- 14. Duggan DJ, Bittner M, Chen Y et al. (1999). Expression profiling using cDNA microarrays. Nature Genetics, 21: 10-14.
- 15. Vo-Dinh T, Alarie JP, Isola N et al. (1999). DNA Biochip using a phototransistor integrated circuit. Analytical Chemistry, 71: 358-363.
- 16. Beissbarth T, Fellenberg K, Brors B et al. (2000). Processing and quality control of DNA array hybridization. Bioinformatics, 16: 1014-1022.
- 17. Whitney LW & Becker KG (2001). Radioactive 33-P probes in hybridization to glass cDNA microarrays using neural tissues. Journal of Neuroscience Methods, 106: 9-13.
- 18. DeRisi J, Penland L, Brown PO et al. (1996). cDNA microarray to analyse gene expression patterns in human cancer. Nature Genetics, 14: 457-460.
- 19. Shalon D, Smith SJ & Brown PO (1996). A DNA microarray system for analyzing complex DNA samples using two-color fluorescent probe hybridization. Genome Research, 6: 639-645.
- 20. Bertucci F, Bernard K, Loriod B et al. (1999). Sensitivity issues in DNA array-based expression measurements and performance of nylon microarrays for small samples. Human Molecular Genetics, 8: 1715-1722.
- 21. Mills JC, Roth KA, Cagan RL et al. (2001). DNA microarray and beyond: completing the journey from tissues to cell. Nature Cell Biology, 3: E175-E178.
- 22. Kerr MK & Churchill GA (2001). Bootstrapping cluster analysis: assessing the reliability of conclusions from microarray experiments. Proceedings of the National Academy of Sciences, USA, 98: 8961-8965.
- 23. Planet PJ, Desalle R, Sidall M et al. (2001). Systematic analysis of DNA microarray data: ordering and interpreting patterns of gene expression. Genome Research, 11: 1149-1155.
- 24. Tanaka TS, Jaradat SA, Lim MK et al. (2000). Genome-wide expression profiling of mid-gestation placenta and embryo using a 15,000 mouse developmental cDNA microarray. Proceedings of the National Academy of Sciences, USA, 97: 9127-9132.
- 25. Quackenbush J (2001). Computational analysis of microarray data. Nature Genetics, 2: 418-427.
- 26. Dozmorov I & Centola M (2003). An associative analysis of gene expression array data. Bioinformatics, 19: 204-211.
- 27. Yang YH, Dudoit S, Luu P et al. (2002). Normalization for cDNA microarray data: a robust composite method addressing single and multiple slide systematic variation. Nucleic Acids Research, 30: e15.
- 28. Tamayo P, Slonim D, Mesirov J et al. (1999). Interpreting patterns of gene expression with self-organizing maps: methods and application to hematopoietic differentiation. Proceedings of the National Academy of Sciences, USA, 96: 2907-2912.
- 29. Sherlock G (2000). Analysis of large-scale gene expression data. Current Opinion in Immunology, 12: 201-205.
- 30. Eisen MB, Spellman PT, Brown PO et al. (1998). Cluster analysis and display of genome-wide expression patterns. Proceedings of the National Academy of Sciences, USA, 95: 14863-14868.
- 31. Braunschweig T, Chung JY & Hewitt SM (2004). Perspectives in tissue microarrays. Combinatorial Chemistry and High Throughput Screening, 7: 575-585.
- 32. Shergill IS, Shergill NK, Arya M et al. (2004). Tissue microarrays: a current medical research tool. Current Medical Research and Opinion, 20: 707-712.
- 33. Rangel LB, Agarwal R, Sherman-Baust CA et al. (2004). Anomalous expression of the HLA-DR alpha and beta chains in ovarian and other cancer. Cancer Biology and Therapy, 3: 1021-1027.
- 34. Tseng YH, Butte AJ, Kokkotou E et al. (2005). Prediction of preadipocyte differentiation by gene expression reveals role of insulin receptor substrates and necdin. Nature Cell Biology, 7: 601-611.
- 35. Rosamond J & Allsop A (2000). Harnessing the power of the genome in the search for new antibiotics. Science, 287: 1973-1976.
- 36. Staudt LM (2001). Gene expression physiology and pathophysiology of the immune system. Trends in Immunology, 22: 35-40.
- 37. Berns A (2000). Gene expression in diagnosis. Nature, 403: 491-492.
- 38. Sawiris GP, Sherman-Baust CA, Becker KG et al. (2002). Development of a highly specialized cDNA array for the study and diagnosis of epithelial ovarian cancer. Cancer Research, 62: 2923-2928.
- 39. Khan J, Wei JS, Ringner M et al. (2001). Classification and diagnostic prediction of cancers using gene expression profiling and artificial neural networks. Nature Medicine, 7: 673-679.
- 40. Chang JC, Hilsenbeck SG & Fuqua SA (2005). Genomic approaches in the management and treatment of breast cancer. British Journal of Cancer, 92: 618-624.
- 41. Lovett RA (2000). Toxicogenomics. Toxicologists brace for genomics revolution. Science, 289: 536-537.
- 42. Flores-Morales A, Stahlberg N, Tollet-Egnell P et al. (2001). Microarray analysis of the in vivo effects of hypophysectomy and growth hormone treatment on gene expression in the rat. Endocrinology, 142: 3163-3176.
- 43. Liu K, Li Y, Prabhu V et al. (2001). Augmentation in expression of activation-induced genes differentiates memory from naive CD4+ T cells and is a molecular mechanism for enhanced cellular response of memory CD4+ T cells. Journal of Immunology, 166: 7335-7344.
- 44. Hess K, Yang Y, Golech S et al. (2004). Kinetic assessment of general gene expression changes during human naive CD4+ T cell activation. International Immunology, 16: 1711-1721.
- 45. Brown PO & Botstein D (1999). Exploring the new world of the genome with DNA microarrays. Nature Genetics, 21: 33-37.
- 46. Hacia JG, Fan JB, Ryder O et al. (1999). Determination of ancestral alleles for human single-nucleotide polymorphisms using high-density oligonucleotide arrays. Nature Genetics, 22: 164-167.
- 47. de Mello-Coelho V, Rangel LBA, Morin PJ et al. (2004). Preadipocyte-like cells in the aging thymus. In: Monduzzi Editore International Proceedings Division, Immunology 2004 Medimond SRL, Bologna, Italy, 279-284.
- 48. Lee CK, Klopp RG, Weindrucht R et al. (1999). Gene expression profile of aging and its retardation by caloric restriction. Science, 285: 1390-1393.
- 49. Miles M (2001). Microarray: lost in a storm of data? Nature Neuroscience, 2: 441-443.
- 50. Becker KG (2001). The sharing of cDNA microarray data. Nature Neuroscience, 2: 438-440.
- 51. Brazma A, Parkinson H, Sarkans U et al. (2003). ArrayExpress - a public repository for microarray gene expression data at the EBI. Nucleic Acids Research, 31: 68-71.
- 52. Brazma A, Hingamp P, Quackenbush J et al. (2001). Minimum information about a microarray experiment (MIAME)-toward standards for microarray data. Nature Genetics, 29: 365-371.
- 53. Spellman PT, Miller M, Stewart J et al. (2002). Design and implementation of microarray gene expression markup language (MAGE-ML). Genome Biology, 3: Research 0046.1-0046.9.
- 54. Wang X, Jiang N, Feng X et al. (2003). A novel approach for high-quality microarray processing using third-dye array visualization technology. IEEE Transactions on Nanobioscience, 2: 193-201.
- 55. Lynch M, Mosher C, Huff J et al. (2004). Functional protein nanoarrays for biomarker profiling. Proteomics, 4: 1695-1702.
- 56. Berry CC, Charles S, Wells S et al. (2004). The influence of transferring stabilized magnetic nanoparticles on human dermal fibroblasts in culture. International Journal of Pharmaceutics, 269: 211-225.
- 57. Crnic I & Christofori G (2004). Novel technologies and recent advances in metastasis research. International Journal of Developmental Biology, 48: 573-581.
- 58. Carella M, Volinia S & Gasparini P (2003). Nanotechnologies and microchips in genetic diseases. Journal of Nephrology, 16: 597-602.
Correspondence and Footnotes
Publication Dates
-
Publication in this collection
01 Nov 2005 -
Date of issue
Oct 2005
History
-
Received
28 Mar 2005 -
Accepted
22 July 2005