Abstract
The hydrostatic-pressure and applied electric field dependencies of the binding energy and the optical-absorption spectra, associated with transitions between the n = 1 valence subband and the donor-impurity band, in symmetrical and asymmetrical GaAs-Ga1-xAl xAs double quantum-well structures are calculated using a variational procedure within the effective-mass approximation. Results are obtained for different well and barrier widths, shallow-donor impurity positions, hydrostatic pressure, and applied electric field.
Electric field; Hydrostatic pressure; Quantum well; Absorption spectra
ELECTRONIC AND MAGNETIC PROPERTIES OF NANOSCOPIC SYSTEMS
Donor-related optical absorption spectra for a GaAs-Ga0.7Al0.3As double quantum well under hydrostatic pressure and applied electric field effects
A. L. Morales; N. Raigoza; C. A. Duque
Instituto de Física, Universidad de Antioquia, AA 1226, Medellín - Colombia
ABSTRACT
The hydrostatic-pressure and applied electric field dependencies of the binding energy and the optical-absorption spectra, associated with transitions between the n = 1 valence subband and the donor-impurity band, in symmetrical and asymmetrical GaAs-Ga1-xAlxAs double quantum-well structures are calculated using a variational procedure within the effective-mass approximation. Results are obtained for different well and barrier widths, shallow-donor impurity positions, hydrostatic pressure, and applied electric field.
Keywords: Electric field; Hydrostatic pressure; Quantum well; Absorption spectra
I. INTRODUCTION
The physics of low-dimensional semiconductor systems, such as single and multiple quantum wells (QWs), quantum dots, quantum-well wires and superllatices, has been widely studied in the last few decades, due to its importance for potential applications in electronic and optoelectronic devices.
The study of hydrostatic pressure effects on low dimensional systems has proven to be invaluable tool in the context of optical properties such as [1,2]: the detuning between the type-I and type-II transitions, the intervalley scattering rates, the switching for electron-hole transitions, the mixing for the valence and conduction bands, and the pressure and quantum confinement dependent energy shift of the excitonic peak in the absorption and photoluminescence (PL) spectra. The application of an electric field in the growth direction of the heterostructure gives rise to a polarization of the carrier distribution and to an energy shift of the quantum states which may be of importance for control and modulation of intensity outputs of optoelectronic devices. Several studies about the effects of an external electric field and hydrostatic pressure on the binding energy and density of impurity states associated with shallow donors and acceptors in GaAs-Ga1-xAlxAs semiconductor heterostructures, have been performed. Theoretical studies for donor- and acceptor-related optical-absorption and PL spectra in low dimensional systems have reported the presence of well defined structures related to on center and on edge impurities [1-7].
The combined effect of an applied electric field and hydrostatic pressure modifies the PL line shape and the donor-and excitonic-related pressure coefficient in low dimensional semiconductor heterostructures. It is possible to modulate the donor-related optical absorption spectra, via hydrostatic pressure and applied electric fields, from states of the valence-band to final states related to randomly distributed donor-impurities along the QW heterostructures.
In this work, we make theoretical development about the combined effects of the hydrostatic pressure and applied electric field on the binding energy and the optical-absorption spectra, associated with transitions between the n = 1 valence subband and the donor-impurity band, in symmetrical and asymmetrical GaAs-Ga1-xAlxAs double quantum-well (DQW) heterostructures.
II. THEORETICAL FRAMEWORK
In the effective-mass approximation, the Hamiltonian for a hydrogenic shallow impurity in a GaAs-Ga1-xAlxAs DQW under hydrostatic pressure (P), at low temperature (T) and electric field in z-direction (F) is given by
where r is the carrier-impurity distance, m* the conduction effective-mass [8], e the static dielectric constants [9] and V(z, P) the potential barriers that confines the donor-electron (hole) in the well regions, defined as zero in the well region and V0(P) elsewhere [10]. The trial wave function for the ground state is chosen as [5,6,11]
where N is a normalization constant, g(r) = exp(-lr) is the hydrogenic part, where l is a variational parameter. f(z) is the eigenfunction of the Hamiltonian in Eq. (1), without the impurity potential term.
The donor impurity binding energy is calculated from the definition
where Emin is the eigenvalue for the Hamiltonian in Eq. (1), minimized with respect to the variational parameter, and E0 is the eigenvalue for the Hamiltonian in Eq. (1) without the impurity-potential term.
The transition probability per unit time from the n = 1 valence subband to the donor-impurity band (associated with a single donor-impurity located at z = zi) is proportional -in the dipole approximation- to the square of the matrix element of the electron-photon interaction between the wave functions of the initial and final states, i.e.
with Hint = C  ·
·  , where
  is the polarization vector in the direction of the electric field of the radiation,
  is the momentum operator, and C is a factor containing the photon vector potential. For details of the calculations see for example the reference [3].
III. RESULTS AND DISCUSSION
Optical-absorption spectra calculations associated with transitions between the n = 1 valence subband and the donor-impurity band have been performed for DQW structures of dimensions (well length,barrier length,well length): (50 Å, 10 Å, 50Å )(W1), (50 Å, 30 Å, 50Å )(W2), and (50 Å, 10 Å, 75Å )(W3). The applied electric field and hydrostatic pressure values were 0, 50, 100 kV/cm and 0, 10, 30 kbar respectively, the first two pressure values corresponds to the direct transition regime and the third one is beyond the G-X crossing where the potential barrier decreases strongly.
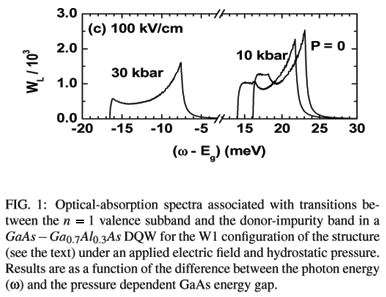
Fig.1 presents the optical absorption results for W1-DQW. The upper curve (fig. 1a) shows a decrease in the optical absorption intensity as the pressure increases from zero to 30 kbar, also the absorption edge decreases as the pressure increases which is referred as a red shift. It is important to recall at this point that the gap is also pressure dependent so the final effect is a blue shift, modified by a red shift, of the absorption spectrum [3]. It is noticeable the increase of the absorption spectra bandwidth as the pressure increases; this is a direct consequence of the impurity electron bandwidth shown in Table 1 and also to the increase of the maximum value of the binding energy due to the dimension contraction of the structure which produce a larger confinement to the impurity electron. As regard to the spectra line shape they look quite similar, the largest peak at the absorption edge is related to the maximum binding energy and the second peak is related to the binding energy values at the edges of the DQW [3].
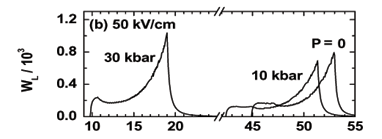
In the middle curve(fig. 1b) the field is turned on to 50 kV/cm essentially attracting the impurity electron to the left of the heterostructure (the field is applied to the right) in this way increasing the binding energy of the impurities lying on that side and also producing a more confining potential. These effects are seen in Table 1 as a large increase in the binding energy bandwidth and also in strong changes in the absorption line shape where a three peak structure appears. Again the first peak is due to the maximum binding energy and the other two peaks to the two different binding energy values at the edges of the DQW.
The peaks are closer to each other in intensity as opposed to fig. 1a. where the first peak is more intense, this change of probability distribution is a consequence of the density of impurity states (DOIS) which in turn depends on the binding energy. In Fig. 1a the first peak corresponds to a singularity at the maximum binding energy where the inverse slope tends to infinity, i.e. a large DOIS value, and the second smaller peak comes from the binding energy at the border of the DQW where the inverse slope has a large finite value, i.e. a smaller value of the DOIS. In fig. 1b, the binding energy slopes at the structure borders are smaller due to the electric field effect giving larger values of the DOIS and in this way producing similar absorption intensities. It is important also to consider the effects of the overlap function, which is a function of all model parameters, which has an important influence in further shaping the spectra. One of the peaks seems to disappear for the largest pressure but what is happening is the merging of the first two peaks due to their close binding energy values. The absorption edge decreases as pressure increases in a more dramatic way than in fig. 1a. The intensity of the absorption spectra decreases in a similar way as for the zero field case. In going from fig. 1a to fig. 1b it is noticed a strong decrease in the intensity of the absorption spectra, this is due to the fact that the applied electric field is pushing the electron cloud to the left and the hole cloud to the right making the overlap in eq. (5) smaller than in the zero applied field case, as the field increases it is expected a corresponding decrease in the overlap function. As the field goes to 100 kV/cm in fig. 1c the effects seen previously are larger, i.e., the binding energy bandwidth increases, the field related intensity decrease with respect to fig. 1b, the absorption edge moves to smaller values, the line shape still shows the three peaks discussed above but now the intensity of the high energy peak is the largest. The pressure related effects are similar to the previous curve.
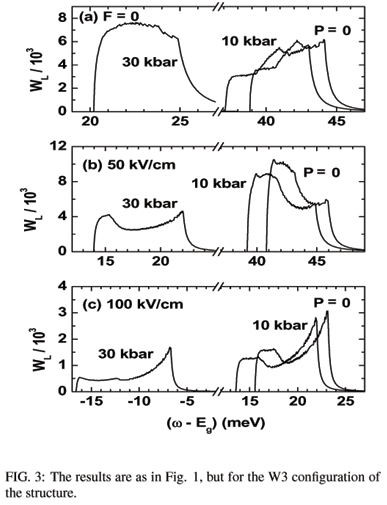
The 30 kbar plots require a closer look since at this pressure the system has undergone the G-X transition and the barrier height, both for the central and border barriers, has substantially decrease becoming a bulk-like structure. For zero field the absorption edge shift is larger than for the other pressure values, the same trend occurs for the applied field cases. The absorption line shape shows only two peaks in contrast with the other pressure values since the first two DOIS peaks are very close. This behavior is kept for structures W2 and W3 considered below.
The optical absorption results for the W2-DQW are shown in Fig. 2. Comparing with Fig. 1 it is seen that the absorption edge is also a function of the DQW dimensions since this leads to different values for the maximum binding energy, for instance small central barrier widths like the ones used here form a minimum in the binding energy inside the barrier region [5] as opposed to a maximum in a single QW with no external perturbations applied. This structure has a larger central barrier which isolates the wells more than in the first case above. This leads to an absorption edge shift to larger energies, the binding energy bandwidth decreases (see Table 1) due to the fact that the wells are a bit more isolated than the first case, the absorption edge shift due to the electric field is larger than in fig. 1b. The larger electric field effect can be understood since this structure has largest dimensions and the electron cloud becomes more polarizable. As a result the applied field binding energy bandwidth is larger than in the previous case so a larger absorption range is achieved, the line shapes present larger peaks to high energies due to the combination of DOIS and overlap function effects. There is a three peak structure in zero field fig. 2a, while a two peak structure is present in fig. 1a., due to the maximum, minimum, and edges of the binding energy [5] discussed above. The three peak structure disappears in the other curves due to the close binding energy values, the maximum and the left edge values.
In Fig. 3 the results for the absorption spectra for an asymmetrical dimensions DQW are shown. The general discussions about the absorption edge, pressure effects, and field effects are similar to the previous cases. This structure has the larger dimensions considered in this study, on the other hand the barrier is smaller than W2 so the asymmetrical wells are more connected, the expectation leads to larger field effects. However, it seems from Fig 3, and comparison with Fig. 1 and 2, that these effects are smaller since all three peaks are clearly seen. What happens is due to the dimensional asymmetry of W3, this produces a zero field maximum binding energy inside the wider well, as opposed to the symmetric DQW which shows a maximum for W1 or a minimum for W2 at the center, with different slopes at the structure edges. There is a tendency of the electron cloud to go to wider right well and this softens the effect of the applied electric field, so the field dependent results are closer to W1 than to W2. The absorption edges in Fig. 3a are lower than the corresponding Fig. 1a due to the dimensions of the well which change the relative ground state energies for the n = 1 conduction and valence subbands, respectively. The edges for the applied field cases are similar to Fig. 1 meaning that the electric field effect is smaller in shifting the spectra.
IV. CONCLUSIONS
The transition probabilities between the n = 1 valence subband and the donor-impurity band are calculated for symmetrical and asymmetrical GaAs-Ga0.7Al0.3As DQWs as functions of hydrostatic pressure and applied electric field.
The impurity absorption bandwidth increases with pressure, at constant values of the electric field, due to the combined effect of an increasing pressure decreasing the dimensions, i.e. producing a larger impurity confinement, and the electric field attracting the impurity electron cloud to the left of the structure and placing it close to impurity positions on that side of the DQW, i.e. increasing the binding energy.
The absorption edge changes also due to both effects of increasing pressure and applied electric field. As the pressure increases the binding energy increases this causes the absorption edge to move to smaller values with respect to the case of no applied pressure. The electric field further confines the impurity electron also producing an increase of the binding energy, in our case for impurities situated to the left of the DQW, this also moves the absorption edge to smaller values of photon energy. The simultaneous action of both effects produces an even larger displacement of the edge. The absorption edge is also a function of the DQW dimensions since this leads to different values for the maximum binding energy, for instance small central barrier widths like the ones used here form a deep in the binding energy curve [5] as opposed to a maximum in a single QW with no external perturbations applied.
V. ACKNOWLEDGEMENTS
The authors would like to thank the Colombian COLCIENCIAS Agency and CODI-Universidad de Antioquia, for partial financial support. This work has been partially supported by the Excellence Center for Novel Materials ECNM, under Colciencias contract No. 043-2005.
Received on 8 December, 2005
- [1] M. Chandrasekhar and H. R. Chandrasekhar, Phil. Mag. B 70, 369 (1994).
- [2] B. S. Ma, X. D. Wang, F. H. Su, Z. L. Fang, K. Ding, Z. C. Niu, and G. H. Li, J. Appl. Phys. 95, 933 (2004).
- [3] R. B. Santiago, L. E. Oliveira, and J. d'Albuquerque e Castro, Phys. Rev. B 46, 4041 (1992).
- [4] A. Latgé, N. Porras-Montenegro, M. de Dios-Leyva, and L. E. Oliveira, J. Appl. Phys. 81, 6234 (1997).
- [5] N. Raigoza, A. L. Morales, A. Montes, N. Porras-Montenegro, and C. A. Duque. Phys. Rev. B 69, 045323 (2004).
- [6] A. L. Morales, N. Raigoza, A. Montes, N. Porras-Montenegro, and C. A. Duque. Phys. Stat. Sol. (b) 241, 3224 (2004).
- [7] N. Raigoza, A. L. Morales, and C. A. Duque. Physica B 363, 262(2005).
- [8] S. Adachi, J. Appl. Phys. 58, R1 (1985).
- [9] G. A. Samara, Phys. Rev. B 27, 3494 (1983).
- [10] A. M. Elabsy, J. Phys.: Condens. Matter 6, 10025 (1994).
- [11] A. L. Morales, A. Montes, S. Y. López, and C. A. Duque, J. Phys.: Condens. Matter 14, 987 (2002).
Publication Dates
-
Publication in this collection
04 Dec 2006 -
Date of issue
Sept 2006
History
-
Received
08 Dec 2005


