ABSTRACT
A rapid, sensitive, and accurate high performance liquid chromatography for the determination of Axitinib (AN) in rabbit plasma is developed using crizotinibe as an internal standard (IS). Axitinib is a tyrosine kinase inhibitor, used in the treatment of advanced kidney cancer, which works by slowing or stopping the growth of cancer cells. The chromatographic separation was performed on a Waters 2695, Kromosil (150 mm × 4.6 mm, 5 µm) column using a mobile phase containing buffer (pH 4.6) and acetonitrile in the ratio of 65:35 v/v with a flow rate of1 mL/min. The analyte and internal standard were extracted using liquid-liquid extraction with acetonitrile. The elution was detected by photo diode array detector at 320 nm.The total chromatographic runtime is 10.0 min with a retention time for Axitinib and IS of 5.685, and 3.606 min, respectively. The method was validated over a dynamic linear range of 0.002-0.2µg/mL for Axitinib with a correlation coefficient of r2 0.999.
Keywords:
High performance liquid chromatography/method validation; Axitinib/determination; Axitinib/ kidney cancer treatment; Crizotinibe; Rabbit plasma; Tyrosine kinase inhibitor
INTRODUCTION
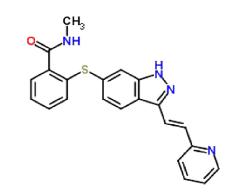
Axitinib is an oral, potent, and selective inhibitor of vascular endothelial growth factor receptors (VEGFR) 1, 2, and 3 (Cohenet al., 2008Cohen E, Rosen L, Vokes E, Kies M, Forastiere A, Worden F, et al. Axitinib is an active treatment for all histologic subtypes of advanced thyroid cancer: results from a phase II study. J Clin Oncol. 2008;26(29):4708-4713.). Axitinib is marketed under the name Inlyta (2014), and if one previous systemic therapy for kidney cell cancer has failed, Axitinib is indicated (leaflet (Pfizer) revised 8/2014). IUPAC name was (N-methyl-2-[[3-[(E)-2-pyridin-2-yl-ethenyl]-1H-indazol-6-yl]sulfanyl]benzamide). It is soluble in DMSO (42 mg/mL at 25°C), water (<1 mg/mL at 25 °C), ethanol (<1 mg/mL at 25 °C), methanol, and DMF (~0.25 mg/mL) (NCBI Compound Database, 2016). Axitinib prevents the progression of cancer by inhibiting angiogenesis and blocking tumor growth (Van Geel, Beijnen, Shellens et al., 2012Van Geel R, Beijnen J, Schellens J. Concise drug review: pazopanib and Axitinib. Oncologist. 2012;17(8):1081-1089.). The chemical structure of Axitinib is given in Figure1.
Crizotinibe is a tyrosine kinase receptor inhibitor (Wani et al.,2014Wani TA, Iqbal M, Darwish IA, Khalil NY, Zargar S. Development and validation of sensitive UPLC-MS/MS based method for estimation of crizotinib in human plasma. Digest J Nanomat Biostr. 2014;9(2):693-704.). More specifically, it inhibits anaplastic lymphoma kinase (ALK), hepatocyte growth factor receptor (HGFR, c-MET), and Recepteur d’Origine Nantais (RON). Abnormalities in the ALK gene caused by mutations or translocations may lead to the expression of oncogenic fusion proteins. In patients with NSCLC, they have the EML4-ALK gene. Crizotinibe inhibits ALK tyrosine kinase, which ultimately results in the decreased proliferation of cells that carry the genetic mutation and tumor survivability (Wani et al., 2014; Probhash et al., 2013Probhash K, Sahu A, Noronha V, Joshi A, Desai S. Crizotinib: a comprehensive review. South Asian J Cancer. 2013;2(2):91-97.).
The literature survey revealed very few analytical methods for the estimation of Axitinib (Sagar, Bera, Panda et al., 2016Sagar SP, Bera VVRK, Panda N. Development and validation of a superior high performance liquid chromatographic method for quantification of Axitinib in solid oral dosage form. Am J Modern Chromatogr. 2016;3(1):33-43.; Sarada, Reddy, 2016Sarada NC, Reddy BJC. Development and validation of stability indicating RP-HPLC method for the determination of Axitinib in bulk and its pharmaceutical formulations. Der Pharmacia Lettre. 2016;8(11):97-106.), which included estimation in biological fluids (Garrettet al., 2014Garrett M, Poland B, Brennan M, Hee B, Pithavala YK, Amantea MA. Population pharmacokinetic analysis of Axitinib in healthy volunteers. Brit J Clin Pharmacol. 2014; 77(3):480-492.). The available methods include LC-MS (Sparidans et al., 2009Sparidans RW, Iusuf D, Schinkel, AH, Schellens JHM, Beijnen JH. Liquid chromatography-tandem mass spectrometric assay for the light sensitive tyrosine kinase inhibitor Axitinib in human plasma. J Chromatogr B. 2009;877(32):4090-4096.) ion mobility spectrometry and DART mass spectrometry (Likar et al., 2011Likar MD, Cheng G, Mahajan N, Zhang Z. Rapid identification and absence of drug tests for AG-013736 in 1 mg Axitinib tablets by ion mobility spectrometry and DART(tm) mass spectrometry. J Pharm Biomed Anal. 2011;55(3):569-573.). The present work emphasizes the development of a rapid, economical and simple method, which utilizes protein precipitation for sample preparation and HPLC using UV detection for the quantification of Axitinib in rabbit plasma.
EXPERIMENTAL
Chemicals and reagents
The pure samples of Axitinib and crizotinibe were obtained from Sigma-Aldrich. HPLC grade Acetonitrile, HPLC grade Methanol and all other chemicals were obtained from Merck chemical division, Mumbai. HPLC grade water obtained from a Milli-Q water purification system was used throughout the study. Rabbit plasma was purchased from albino labs, Miyapur, Hyderabad.
Instrumentation
Chromatography was performed with the waters 2695 HPLC system provided with a high speed autosampler, column oven, degasser and 2996 PDA detector to provide a compact process and with class Empower-2 software.
Chromatographic method
The separation was carried on a Kromosil C18 analytical column (150 mm×4.6 mm×5 µm) using the mobile phase containing buffer and acetonitrile in the ratio of 65:35%v/v; this was delivered isocratically at a flow rate of 1 mL/min. The injection volume was 10 µL and the run time was 10 min. The temperatures of the column and autosampler were maintained at 30 °C and 5 °C, respectively. The detection was performed at a wavelength of 320 nm.
Buffer preparation
One mL of perchloric acid was transferred into a 1000 mL volumetric flask and made up to 1000 mL with water; pH was adjusted to 4.6 using triethylamine.
Preparation of standard solutions
The standard stock solution of Axitinib was prepared at 0.1mg/mL with the diluent composition of water:acetonitrile 50:50%v/v. Axitinib spiking solutions (0.46 µg/mL to 46 µg/mL) were prepared from stock solution. Calibration standards were prepared by spiking stock solution into blank plasma to obtain 0.002, 0.004, 0.02, 0.04, 0.08, 0.1, 0.15 and 0.2 µg/mL.
Sample preparation
To 250 µLof drug free plasma, 50 µL of internal standard and 10 µL of Axitinib was spiked and 2 mL of acetonitrile was added. The above mixture was subjected to the cyclomixer for 15 s, vortexed for 2 min and finally centrifuged for 3 min at 3200 rpm. After centrifugation, the organic layer was collected and 10 µL was directly injected into HPLC.
Method validation
A thorough and complete method of validation was performed following the USFDA guidelines. The method was validated for system suitability, autosampler carryover, specificity and screening of the biological matrix, sensitivity, matrix effect, linearity, precision and accuracy, recovery of analyte and internal standard, ruggedness on precision accuracy and linearity (Maring et al., 2005Maring JG, Schouten L, Greijdanus B, Vries EGED, Uges DRA. A simple and sensitive fully validated HPLC-UV method for the determination of 5-fluorouracil and its metabolite 5,6-dihydrofluorouracil in plasma. Ther Drug Monitoring. 2005;27(1):25-30.; Rote et al., 2013Rote AR, Sonavame PR. Bioanalytical method development and validation for determination of metoprolol tartarate and hydrochlorothiazide using HPTLC in human plasma. Braz J Pharm Sci. 2013;49(4):845-851.; Phatak, Vaidya, Phatak, 2014Phatak MS, Vaidya VV, Phatak HM. Development and validation of a rapid high performance liquid chromatography method for simultaneous quantification ofornidazole and miconazole from cream formulations. Int J Pharm Res Scholars.2014;3(4):191-197.), reinjection reproducibility and stability on day zero, long batch, LT at -28 °C and LT at -80 °C.
System suitability was assessed by a middle quality control (MQC) sample at a concentration of 0.08 µg/mL, with six homogenous injections; relative standard deviation (%RSD) values for retention time and response of the analyte and internal standard were calculated. Autosample carryover was assessed by injecting a sequence of standard blank, an upper limit of quantification (ULOQ) concentration of 0.2 µg/mL and a lower limit of quantification (LLOQ) concentration of 0.002 µg/mL.
Specificity and screening of the biological matrix was assessed using six blank standards and LLOQ level samples. All samples were checked for any interference of blank and sample response. Sensitivity was assessed by LLOQ level sample to determine the lowest limit of detection and the % mean accuracy and % CV (coefficient of variation) were calculated. Matrix effect on analyte quantitation with respect to consistency in signal (suppression/enhancement) was checked in six different lots of Axitinib plasma; three replicates, at LQC and HQC levels, were prepared from these plasma samples (total 36 QC samples) and assessed for accuracy in terms of % bias in all of the QC samples.
Linearity of the method was determined by analysis of standard plots associated with an 8-point standard calibration curve. The calibration curve was found be linear over the range of 0.002-0.2 µg/mL. Intra-batch and inter-batch accuracy and precision were evaluated at four different concentrations levels (LLOQ, LQC, MQC and HQC) in six replicates for both analytes. Mean values were obtained for calculated drug concentrations over these batches. The accuracy and precision were calculated and expressed in terms of % accuracy and coefficient of variation (% CV), respectively.
Recovery of the analytes from the extraction procedure was performed at LQC, MQC, and HQC levels. It was evaluated by comparing the peak area of the extracted samples (spiked before extraction) to the peak area of unextracted samples (quality control working solutions spiked in extracted plasma). Ruggedness of the method was assessed by using different analysts for linearity, precision and accuracy in the levels of ULOQ, LQC, MQC and HQC.
Stability studies were performed at Zero hours, Long batch, LT at -28 °C and LT at -80 °C. Day zero had two samples with six replicates of HQC and LQC levels. Long batch had 35 replicates of LLOQ, LQC, MQC and HQC level of samples with %Mean accuracy. LT at -28 °C and LT at -80 °C had HQC and LQC levels with % stability findings by comparing stability sample with freshly spiked samples.
RESULTS AND DISCUSSIONS
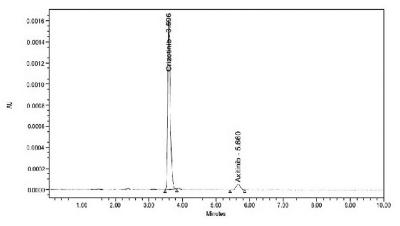
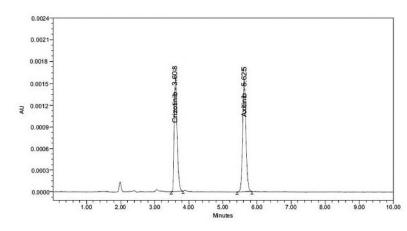
The chromatographic separation of Axitinib using crizotinibe was optimized after several trials using the C18 column mobile phase with different ratios of perchloric acid buffer and acetonitrile at various pH. The best results were achieved by using perchloric acid buffer (pH 4.6 adjusted by using triethyl amine) and acetonitrile in the ratio of 65:35v/v. Good sensitivity was obtained at a wavelength of 320 nm. The best separation was achieved with a flow rate of 1 mL/min. The analyte and internal standard were eluted at 5.685, and 3.606 min, respectively.
System suitability and auto sampler carryover
Six replicate samples of middle quality control samples at different concentrations were injected along with internal standards and % CV was calculated. The % CV of the retention time of analyte and IS was found to be ≤2.00%. The % CV of the peak area ratio of analyte to IS was found to be ≤5.00%. The results were found to be within the limits and are summarized in Table I.
The carryover experiment was performed to ensure that it does not affect the accuracy and precision. There was no carryover observed. The results were presented in Table II.
Specificity and screening of biological matrix
The response of interfering peaks in the standard blank at the retention time of analyte should be ≤20.00% of that in LLOQ. The response of interfering peaks in the standard blank at the retention time of IS should be ≤5.00% of that in LLOQ. All of the samples were found to be free of interference at retention time of the analyte in blank samples. The results are shown in Table III. This shows the specificity of the method towards Axitinib by the absence of interfering peaks.
Sensitivity
The accuracy and precision of Axitinib at LLOQ level was found to be 6.50% CV and % mean accuracy was found to be 107.31%. Acceptance criteria state that at least 67% (4 out of 6) of samples should be within 80.00-120.00%. % Mean accuracy should be within the range 80.00-120.00%. % CV accuracy should be ≤20.00%. The results meet the acceptance limit and are shown in Table IV. This confirms that the method is highly sensitive for Axitinib.
Matrix effect
The matrix effect data of HQC and LQC are presented in Table V. The acceptance criteria state that at least 67% (2 out of 3) of samples at each level should be within the range 85.00-115.00%. At least 80% (5 out of 6) of the matrix lot should be within the acceptance criteria. The % mean accuracy of back calculated concentration of LQC and HQC samples prepared from different biological matrix lots should be within the range 85.00-115.00%.
Linearity
The linearity of the method was evaluated at eight concentration levels including the LLOQ. The calibration curve was found to be linear in the range 0.002-0.2 µg/mL, with a correlation coefficient (r2) of 0.999. The calibration curves were defined in three runs based on triplicate assays of the spiked blank plasma samples. The linear graph is shown in Figure 2. Each back-calculated standard concentration was within the acceptance limits. The data of calculated calibration standards are presented in Table VI.
Precision
The inter-day and intraday precisions were measured as relative standard deviations and expressed as percentages of the concentration (Alanazi et al., 2012Alanazi F.K, Mowafy H.A, Magharaby G.M.E. Development and validation of an HPLC-UV method for the quantification of carbamazepine in rabbit plasma. Saudi Pharm J. 2012;20:29-34.) of Axitinib. The % CV of estimated concentrations for all four quality control samples with six replicates for analyte was within the range 6.54-11.68%. The % mean accuracy for LLOQ, LOQ, MOQ and HQC was within the range 95.06-107.71%. For inter-day precision and accuracy, the % CV and accuracy results of all quality control samples were within the ranges 7.49-8.95% and 98.51-104.84%, respectively. The acceptance criterion states that at least 67% of the QC samples should be ≤15.00% and for the LLOQ should be ≤20.00%. % Mean accuracy for LQC, MQC and HQC samples should be within the range 85.00-115.00% and for the LLOQ sample should be within the range 80.00-120.00%. The data for precision and accuracy are given in Table VII. The chromatogram of quality control samples is shown in Figures 3-7. The data obtained indicate an acceptable precision for all concentrations assayed for both intraday and inter-day samples.
Recovery of analyte
Recovery is the detector response obtained from an amount of analyte added to and extracted from the biological matrix (FDA, 2001). The extraction recovery of Axitinib at HQC, MQC and LQC was found to be 50.45, 57.40 and 58.21, respectively, and that of the internal standard was 74.76. This indicates that the results are coherent. The results of the recovery study are given in Tables VIII and IX. The results are within the acceptance limit. The acceptable limit was % CV of recovery at each QC level and IS of ≤15.00%. The overall mean recovery % CV for all QC levels should be ≤20.00%.
Ruggedness
The present method showed good ruggedness when it was performed using different analysts and on different instruments of the same make. The results of the ruggedness study for Axitinib were within the acceptance limit. The data are shown in Table X. The precision and accuracy values for different columns with different analysts ranged from 4.21% to 10.68% and 94.85% to 110.60%.
Stability studies
The stability of the analytes was studied by keeping replicates of low, middle and high quality control samples at Zero hours, Long batch, LT at -28 °C and LT at -80 °C. The results of LQC, MQC and HQC were found to be greater than 95%, which is within the acceptance limit. This shows that the analyte was stable for the entire analytical period. The results are compiled in Table XI.
SUMMARY AND CONCLUSION
The proposed HPLC method for the determination of Axitinib in rabbit plasma by using a UV detector is simple, accurate and utilizes protein precipitation with acetonitrile. The isocratic elution, short elution time of less than 10 min and UV detection makes the method cost effective. The results obtained prove that the method was accurate and reproducible. In summary, the developed chromatographic method may be used for the routine bioanalysis of Axitinib.
ACKNOWLEDGEMENT
The authors are thankful to V.V. Institute of Pharmaceutical Sciences, Gudlavalleru for providing facilities to carry out this work.
REFERENCES
- Alanazi F.K, Mowafy H.A, Magharaby G.M.E. Development and validation of an HPLC-UV method for the quantification of carbamazepine in rabbit plasma. Saudi Pharm J. 2012;20:29-34.
- Cohen E, Rosen L, Vokes E, Kies M, Forastiere A, Worden F, et al. Axitinib is an active treatment for all histologic subtypes of advanced thyroid cancer: results from a phase II study. J Clin Oncol. 2008;26(29):4708-4713.
- Food and Drug Administration. FDA. Guidance for industry, bioanalytical method validation. Silver Spring: FDA, 2001.
- Garrett M, Poland B, Brennan M, Hee B, Pithavala YK, Amantea MA. Population pharmacokinetic analysis of Axitinib in healthy volunteers. Brit J Clin Pharmacol. 2014; 77(3):480-492.
- Inlyta: Axitinib tablet, film coated. New York: Pfizer Laboratories; 2014. [accessed May 19, 2016] Avaiable from: http://labeling.pfizer.com/ShowLabeling.aspx?id=759
- Likar MD, Cheng G, Mahajan N, Zhang Z. Rapid identification and absence of drug tests for AG-013736 in 1 mg Axitinib tablets by ion mobility spectrometry and DART(tm) mass spectrometry. J Pharm Biomed Anal. 2011;55(3):569-573.
- Maring JG, Schouten L, Greijdanus B, Vries EGED, Uges DRA. A simple and sensitive fully validated HPLC-UV method for the determination of 5-fluorouracil and its metabolite 5,6-dihydrofluorouracil in plasma. Ther Drug Monitoring. 2005;27(1):25-30.
- National Center for Biotechnology Information. NCBI. PubChem Compound Database;CID=6450551. [cited 2016 May 19]. Available from: https://pubchem.ncbi.nlm.nih.gov/compound/6450551
» https://pubchem.ncbi.nlm.nih.gov/compound/6450551 - Phatak MS, Vaidya VV, Phatak HM. Development and validation of a rapid high performance liquid chromatography method for simultaneous quantification ofornidazole and miconazole from cream formulations. Int J Pharm Res Scholars.2014;3(4):191-197.
- Probhash K, Sahu A, Noronha V, Joshi A, Desai S. Crizotinib: a comprehensive review. South Asian J Cancer. 2013;2(2):91-97.
- Rote AR, Sonavame PR. Bioanalytical method development and validation for determination of metoprolol tartarate and hydrochlorothiazide using HPTLC in human plasma. Braz J Pharm Sci. 2013;49(4):845-851.
- Sagar SP, Bera VVRK, Panda N. Development and validation of a superior high performance liquid chromatographic method for quantification of Axitinib in solid oral dosage form. Am J Modern Chromatogr. 2016;3(1):33-43.
- Sarada NC, Reddy BJC. Development and validation of stability indicating RP-HPLC method for the determination of Axitinib in bulk and its pharmaceutical formulations. Der Pharmacia Lettre. 2016;8(11):97-106.
- Sparidans RW, Iusuf D, Schinkel, AH, Schellens JHM, Beijnen JH. Liquid chromatography-tandem mass spectrometric assay for the light sensitive tyrosine kinase inhibitor Axitinib in human plasma. J Chromatogr B. 2009;877(32):4090-4096.
- Van Geel R, Beijnen J, Schellens J. Concise drug review: pazopanib and Axitinib. Oncologist. 2012;17(8):1081-1089.
- Wani TA, Iqbal M, Darwish IA, Khalil NY, Zargar S. Development and validation of sensitive UPLC-MS/MS based method for estimation of crizotinib in human plasma. Digest J Nanomat Biostr. 2014;9(2):693-704.
Publication Dates
-
Publication in this collection
2017
History
-
Received
01 Oct 2016 -
Accepted
25 Apr 2017