Abstracts
Biotic indices to monitor water quality are helpful tools for evaluating the health of rivers and lakes. In Brazil water samples are mainly analyzed using physical and chemical attributes, because most biotic indices were developed in other countries and their effective application to Brazilian ecosystems requires significant research. This study compared four biotic indices commonly used to evaluate water quality via benthic macroinvertebrates in order to determine which index best reflects ecosystem health in a coastal river in Brazil's Paraná state. We also analyzed functional feeding groups. The indices studied were: 1) EPT (percent of Ephemeroptera, Plecoptera and Trichoptera); 2) BMWP' (Biological Monitoring Work Party System); 3) BMWP'-ASPT (Average Score per Taxon); and 4) HFBI (Hilsenhoff Family Biotic Index). All indices were calculated from five samples collected from April 2005 to April 2006 at two stations on the coastal do Pinto River. The river's headwaters are inside a protected area but impacts increase downriver (e.g., towns, cattle grazing, tourism). The HFBI index did the poorest job of reflecting water quality. No one index performed better than the others, and all indices yielded water quality scores that did not accurately reflect macroinvertebrate community structure because all of them had differences between ordination scores and the structure of assemblage. The functional feeding groups protocol classified the lower stretch of the river as disturbed due to human impacts, suggesting that this method is a good one to evaluate health in environments.
macroinvertebrates; biomonitoring; functional feeding groups; biotic index; coastal stream
A utilização de índices bióticos como ferramenta para o biomonitoramento da qualidade de recursos hídricos tem sido eficaz no diagnóstico de rios e lagos. As variáveis utilizadas atualmente para o monitoramento da qualidade de água são de caráter biológico, físico e químico. Os índices bióticos aplicados no país são de origem estrangeira na sua maioria, não sendo, portanto, totalmente representativos dos ecossistemas regionais. É preciso testar a eficiência destes índices bióticos nas nossas ecorregiões. Este estudo teve como objetivo fazer uma análise comparativa entre quatro índices bióticos de avaliação da qualidade de água utilizando a macrofauna de invertebrados bentônicos com o intuito de diagnosticar o índice mais indicado para os rios litorâneos no Paraná, bem como caracterizar o ambiente e avaliar sua saúde ambiental por meio da utilização de análises dos grupos de alimentação funcional. Para isso foram selecionados quatro índices bióticos: 1) EPT INDEX (Porcentagem de Ephemeroptera, Plecoptera e Trichoptera); 2) BMWP' (Biological Monitoring Work Party System); 3) BMWP'-ASPT (Average Score per Taxon); e 4) HFBI (Hilsenhoff Family Biotic Index), que foram aplicados em dois trechos de um rio litorâneo do Estado do Paraná. O rio do Pinto nasce em área preservada e recebe ao longo de seu curso uma série de despejos, sejam de origem doméstica, agrícola ou de atividade de lazer. Foram feitas cinco amostragens entre abril de 2005 e abril de 2006 em dois pontos distintos do rio do Pinto, Morretes (PR). Foi constatado que dos índices bióticos, o HFBI é o que menos reflete as condições de qualidade de água e não há um índice biótico mais recomendado, uma vez que todos apresentam discrepâncias entre os escores obtidos e a estrutura da composição faunística. O protocolo de grupos de alimentação funcional revela um rio desestruturado na porção a jusante que se encontra sob influência antrópica, sugerindo ser este um método eficiente de diagnóstico de ambientes.
macroinvertebrados; biomonitoramento; grupos tróficos funcionais; índices bióticos; riacho costeiro
ARTICLES
A comparative analysis of biotic indices that use macroinvertebrates to assess water quality in a coastal river of Paraná state, southern Brazil
Análise comparativa de índices bióticos de avaliação de qualidade de água, utilizando macroinvertebrados, em um rio litorâneo do estado do Paraná, sul do Brasil
Fábio Bertolini GonçalvesI; Márcia Santos de MenezesII,* * Corresponding author: Márcia Santos de Menezes, e-mail: msmenezes@ufpr.br
IPrograma de Pós-graduação em Ecologia e Conservação, Universidade Federal do Paraná UFPR
IIUniversidade Federal do Paraná UFPR, Rua Pioneiro, n. 2153, Jardim Dallas, CEP 85950-000, Palotina, PR, Brazil
ABSTRACT
Biotic indices to monitor water quality are helpful tools for evaluating the health of rivers and lakes. In Brazil water samples are mainly analyzed using physical and chemical attributes, because most biotic indices were developed in other countries and their effective application to Brazilian ecosystems requires significant research. This study compared four biotic indices commonly used to evaluate water quality via benthic macroinvertebrates in order to determine which index best reflects ecosystem health in a coastal river in Brazil's Paraná state. We also analyzed functional feeding groups. The indices studied were: 1) EPT (percent of Ephemeroptera, Plecoptera and Trichoptera); 2) BMWP' (Biological Monitoring Work Party System); 3) BMWP'-ASPT (Average Score per Taxon); and 4) HFBI (Hilsenhoff Family Biotic Index). All indices were calculated from five samples collected from April 2005 to April 2006 at two stations on the coastal do Pinto River. The river's headwaters are inside a protected area but impacts increase downriver (e.g., towns, cattle grazing, tourism). The HFBI index did the poorest job of reflecting water quality. No one index performed better than the others, and all indices yielded water quality scores that did not accurately reflect macroinvertebrate community structure because all of them had differences between ordination scores and the structure of assemblage. The functional feeding groups protocol classified the lower stretch of the river as disturbed due to human impacts, suggesting that this method is a good one to evaluate health in environments.
Keywords: macroinvertebrates, biomonitoring, functional feeding groups, biotic index, coastal stream.
RESUMO
A utilização de índices bióticos como ferramenta para o biomonitoramento da qualidade de recursos hídricos tem sido eficaz no diagnóstico de rios e lagos. As variáveis utilizadas atualmente para o monitoramento da qualidade de água são de caráter biológico, físico e químico. Os índices bióticos aplicados no país são de origem estrangeira na sua maioria, não sendo, portanto, totalmente representativos dos ecossistemas regionais. É preciso testar a eficiência destes índices bióticos nas nossas ecorregiões. Este estudo teve como objetivo fazer uma análise comparativa entre quatro índices bióticos de avaliação da qualidade de água utilizando a macrofauna de invertebrados bentônicos com o intuito de diagnosticar o índice mais indicado para os rios litorâneos no Paraná, bem como caracterizar o ambiente e avaliar sua saúde ambiental por meio da utilização de análises dos grupos de alimentação funcional. Para isso foram selecionados quatro índices bióticos: 1) EPT INDEX (Porcentagem de Ephemeroptera, Plecoptera e Trichoptera); 2) BMWP' (Biological Monitoring Work Party System); 3) BMWP'-ASPT (Average Score per Taxon); e 4) HFBI (Hilsenhoff Family Biotic Index), que foram aplicados em dois trechos de um rio litorâneo do Estado do Paraná. O rio do Pinto nasce em área preservada e recebe ao longo de seu curso uma série de despejos, sejam de origem doméstica, agrícola ou de atividade de lazer. Foram feitas cinco amostragens entre abril de 2005 e abril de 2006 em dois pontos distintos do rio do Pinto, Morretes (PR). Foi constatado que dos índices bióticos, o HFBI é o que menos reflete as condições de qualidade de água e não há um índice biótico mais recomendado, uma vez que todos apresentam discrepâncias entre os escores obtidos e a estrutura da composição faunística. O protocolo de grupos de alimentação funcional revela um rio desestruturado na porção a jusante que se encontra sob influência antrópica, sugerindo ser este um método eficiente de diagnóstico de ambientes.
Palavras-chave: macroinvertebrados, biomonitoramento, grupos tróficos funcionais, índices bióticos, riacho costeiro.
Introduction
Water quality and water availability are intimately linked with socioenvironmental problems. As the growth of the human population has severely reduced access to clean water, the wide variety of anthropogenic wastes generated in watersheds can make water unsuitable for drinking, cause siltation in rivers, reduce microhabitat diversity and associated biodiversity (Callisto et al. 2005), increase the frequency of waterborne diseases, and diminish aesthetic and recreational values (Corgosinho et al. 2004).
Given this state of affairs, efficient assessments of water quality are a critical tool for managing water resources (Buss et al. 2003). The most commonly used variables to monitor water quality at present include physical and chemical attributes (e.g., pH, conductivity, water temperature, current speed, streamflow, biochemical oxygen demand (BOD5), chemical oxygen demand (COD), phosphate, nitrate, nitrite, and oils and grease) as well as biological attributes (e.g., benthonic macroinvertebrates, fish, algae, and bacteria). While physical and chemical analyses are capable of detecting pollutants directly, they only reflect water quality at the moment of sampling (Metcalfe 1989, Alba-Tercedor 1996). In contrast, biological communities provide a more faithful reflection of environmental conditions, since they are continually exposed to them (Rosenberg & Resh 1993). As some groups of organisms are extremely sensitive to environmental conditions while others can survive in severely disturbed systems, aquatic communities are a good indicator of environmental quality (Buss et al. 2003).
An accurate assessment of the aesthetic, recreational, and ecological value of lakes and rivers is only possible using an integrated approach to water quality, i.e., by taking into account the vegetation, anthropogenic activities, and other biotic components of the area under study (Allan 1995, Metcalfe 1989).
Biomonitoring takes various forms, including: 1) ecological indices that quantify diversity and similarity (Washington 1984, Beisel et al. 2003); 2) biotic indices that include both quantitative species diversity measures and qualitative data on the sensitivity of individual taxa to environmental changes (Czerniawska-Kusza 2005); 3) predictive bioassessment tools like the "River Invertebrate Prediction and Classification System" (RIVPACS) (Wright et al. 2000), the "Australian River Assessment System" (AusRivAS) (Simpson & Norris 2000) or the "Assessment by Nearest Neighbour Analysis" (ANNA) (Linke et al. 2005); and 4) protocols for rapid water quality assessments (PAR) (Barbour et al. 1999, Callisto et al. 2002) and for the classification of macroinvertebrates into functional feeding groups (FFG) (Merritt & Cummins 1996, Cummins et al. 2005). In Brazil, few researches take care off health aquatic systems, being an area that needs the improvement.
FFG qualitatively group macroinvertebrates into trophic guilds that use the same resources in a similar morphological and/or behavioral fashion (Simberloff & Dayan 1991, Rosenberg & Resh 1993, Merritt & Cummins 1996). The distribution of such groups along a river can determine the availability of feeding resources and the status of related environmental conditions. Deviations from the expected abundances of these groups (Vannote et al. 1980) can indicate disturbance, since FFG's are sensitive to both natural and anthropogenic changes occurring along rivers (Silveira 2004). For these reasons FFG's are frequently used in environmental impact assessments.
Predictive models and PAR's require reference rivers, i.e., unpolluted rivers where the biotic community is well known and undisturbed. Since such reference rivers have not been defined in Brazil, biological monitoring there to date has mostly relied on biotic indices.
This study compared four biotic indices commonly used to evaluate water quality via benthic macroinvertebrates in order to determine which index best reflects ecosystem health in a coastal river in Brazil's Paraná state comparing to the functional feeding groups results.
Methods
The headwaters of the do Pinto River are located in Pau Oco State Park in the township of Morretes, southern Brazil, inside an Environmental Protection Area (Área de Proteção Ambiental, or APA) in the Serra do Mar mountain range. In its headwaters forests grow densely and human settlements and agricultural plots are absent. Under Koeppen's (1948) classification system the regional climate is Cfb (humid subtropical, mesothermal). Data from the Paraná State Weather Service (SIMEPAR) show a regional rainfall regime marked by intense rainfall peaks between December and February.
Measuring 14.23 km in length, the do Pinto River begins in its headwaters as a typically montane river on a rocky bed and gradually changes to a silted bed downriver, due to significant degradation and removal of the original riparian vegetation. Water use and bank conditions vary along the river's length and are important drivers of water quality.
We collected data at two sampling points. Point 1 (25º 34' 17'' S and 48º 53' 08'' W, 206 masl) is located in a stretch of third order river characterized by abundant rapids. The predominant substrates are rocks and gravel, with leaf litter and sand only present in calm areas along the banks. Given its crystal-clear, odor-free water, riparian vegetation protecting part of the current, and no houses or farms upriver, we considered this stretch of river to be well-conserved.
Point 2 (25º 30' 16.1'' S and 48º 49' 48 5'' W, 37 masl) is a stretch of fourth order river where substrates are mostly gravel and sand and a portion of the riparian vegetation consists of Brachiaria spp. grasses, which are underwater during high water in especially rainy periods. The water is cloudy and smells bad in some stretches, the banks have suffered erosion and siltation, and houses and farms are present both upstream and in the immediate surroundings.
Collections were carried out in 2005 during April, July, and October, and in 2006 during February and April. We sampled macroinvertebrates close to the riparian vegetation with a Surber sampler and sieve. Both had a mesh size of 0.5 mm and measured 30 × 30 cm. Samples were quantitative, with three replicates collected from all available substrates. To characterize the rainy and dry seasons, we obtained precipitation data for the region from SIMEPAR.
Collections were fixed in the field in 10% formalin, stored in plastic bags or flasks, subsequently preserved in 70% alcohol, and sorted on a light box or using the flotation method (Silveira et al. 2004).
Organisms were identified to family level using simple and compound microscopes, with the help of identification keys and specialized literature (McCafferty 1981, Pérez 1988, Lopretto & Tell 1995, Trivinho-Strixino & Strixino 1995, Chacón & Segnini 1996, Merrit & Cummins 1996, Wiggins 1996, Nieser & de Melo 1997, Buckup & Bond-Buckup 1999, Costa et al. 2004).
Four biotic indices were selected for the analyses, based on their current or potential use in biological monitoring systems in Brazil and the fact that they were developed outside of the country. The biotic indices were: 1) BMWP'-Biological Monitoring Work Party Scoring System (Loyola & Brunkov 1999, Loyola 2000); 2) BMWP'-ASPT-Average Score Per Taxon (Walley & Hawkes 1997); 3) HFBI-Hilsenhoff Family Biotic Index (Hilsenhoff 1988); and 4) EPT-Percentage of Ephemeroptera, Plecoptera, and Trichoptera (Cairns & Pratt 1993).
The BMWP' index, which was historically based on the "Saprobiensystem" (Kolkwitz & Marsson 1909), was developed in England in the 1970s. It is a scale from 1 to 10 along which the sensitivity of various insect and other macroinvertebrate families are scored, with the highest scores assigned to species most sensitive to organic pollution. This index was modified for rivers in Brazil's Paraná state by Loyola (2000), and has been used by the Paraná Environmental Institute (Instituto Ambiental do Paraná, IAP) for biological monitoring of hydrological systems there.
The BMWP'-ASPT index is an adapted version of the BMWP' index. It is calculated as the ratio of the score obtained in the BMWP index to the number of families scored in the sample (i.e., it provides a mean value per family recorded).
The HFBI index scores organisms based on the saprobiotic system, in a fashion inverse to that of the BMWP. Scores are calculated as follows: HFBI = ΣnVT/N, where: VT is the tolerance value of each family, n = the number of individuals in each family, and N = the total number of individuals.
The EPT index is calculated based on the relative abundances in the sample of the orders Ephemeroptera, Plecoptera and Trichoptera, in comparison to the total number of individuals in the sample. The higher the relative abundance of those taxa in the sample represent the higher water quality at the site. This index relies on the fact that the majority of organisms in these three orders are sensitive to organic pollution (Carrera & Fierro 2001, Resh & Jackson 1993, Rosenberg & Resh 1993).
The scores of the biotic indices were classified into the four diagnostic categories of the EPT index according to similarities among them (because they are the simplest) and the sampling points compared using UPGMA cluster analyses by Bray-Curtis similarity index (Krebs 1989), as shown in Table 1.
The normality of datasets were previously tested. Datasets corresponding to different sampling dates at a given sampling site were compared by multiple comparison tests (χ2 for k independent samples) for all taxa with relative frequencies >1% (Zar 1999). When significant differences were detected we applied a comparison of two proportions test (Zar 1999) for each individual taxon in order to identify which groups showed significant variation. This test allowed us to determine to what extent the results of the biotic indices corresponded to changes in faunal composition observed in the study, and thus how sensitive each index is in reflecting community structure.
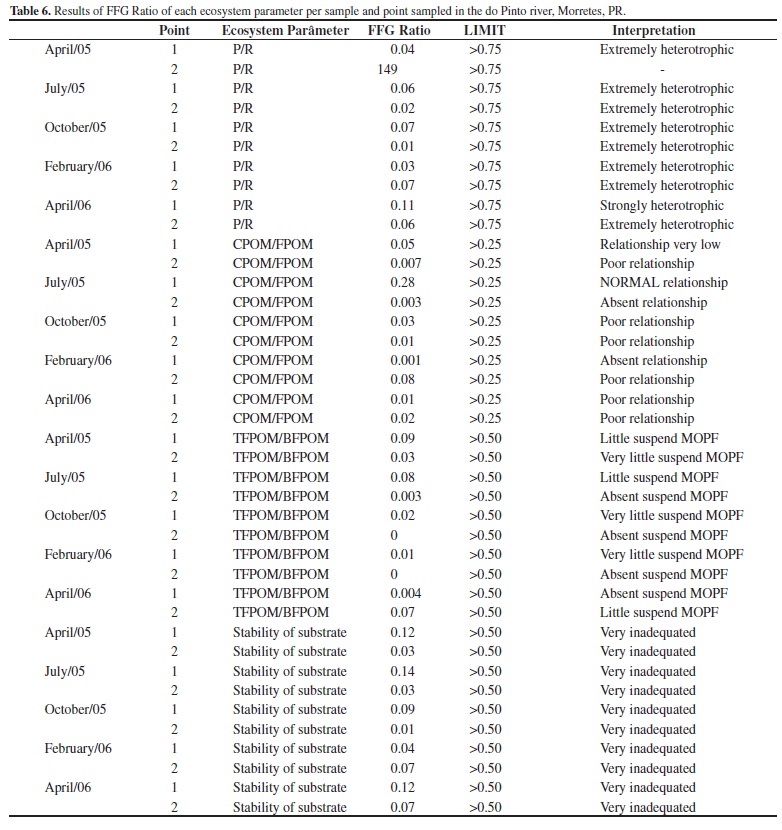
The ratio between FFG's was calculated to estimate the environmental health (Moulton 1998) of each sampling point, following Cummins et al. (2005). We used the following FFG proportions to characterize ecological conditions in each stretch of river: P/R-the ratio of autotrophy (animals that consume algae and vascular plants-P) to heterotrophy (animals that consume leaves of riparian vegetation-R); CPOM/FPOM-the relationship between the input of course particulate organic matter from the riparian forest (CPOM) and that of fine particulate organic matter from the river's own food web (FPOM); TFPOM/BFPOM: the relative dominance of transported fine particulate organic matter (TFPOM) with that deposited in sediments (BFPOM); and the stability of the substrate (as suggesting by Cummins et al. 2005).
Results
The rainfall data obtained for the watershed during the sampling period (April 2005-April 2006) show rainy periods in April 2005 and February 2006 and "dry" periods in July 2005, October 2005 and April 2006. It is important to point out that there is no true dry period. It was considered as a dry period when the pluviosity was below 200 mm.
At the two sampling points we collected 8,677 individual macroinvertebrates belonging to Insecta, Crustacea, Acarina, Oligochaeta, and Mollusca. Insects dominated throughout the sampling period, especially the families Chironomidae and Simulidae (Diptera), Elmidae (Coleoptera), Hydropsychidae (Trichoptera), and Baetidae (Ephemeroptera).
Across the entire sampling period, Point 1 yielded more individuals (6,571 in 58 taxa) than Point 2 (2,106 in 41 taxa). Samples taken in April 2005 and April 2006 yielded the largest number of individuals for Point 1, with 2,121 and 1,853 individuals respectively. At Point 2, the greatest number of individuals sampled was 748, in April 2006. The smallest number of individuals in a sample at Point 1 was 819 in February 2006; the comparable figure for Point 2 was 232 in April 2005.
When the scores of the biotic indices are grouped in four diagnostic categories (very good = 0; good = 1; average = 2 and bad = 3), it is clear that the BMWP' index was not influenced by rainfall. That index showed "very good" water quality at Point 1 in April 2005 (rainy) and July 2005 ("dry"), periods which had very different levels of rainfall. At Point 2, the index recorded "good" water quality in April 2006 and "average" on all the other sampling dates (Figures 1 and 2). The BMWP' index (Table 2) described water quality at Point 1 as "excellent" in July and April 2005, indicating very clean and crystal-clear waters, and "good" on the other sampling dates. Scores for Point 2 showed "acceptable" quality on all sampling dates, except for "good" scores in July 2005 and April 2006.
The BMWP'-ASPT index showed greater sensitivity to rainfall at Point 1 (Figure 1), indicating "very good" water quality in dry season and "average" water quality in rainy months. At Point 2, however, the index was not influenced by rainfall, indicating "average" water quality for all the sampling dates except April 2006 ("very good") (Figure 2). The BMWP'-ASPT index gave more similar results for the two sampling points (Table 2), scoring almost all samples as indicating "doubtful" water quality. The exceptions were April 2006, when the index indicated "excellent" water quality at both sampling points, and July 2005, when it indicated "excellent" quality at Point 1.
The EPT index are not influenced by the rainfall at Point 1, indicating "good" water quality (Figure 1) in October 2005, "bad" water quality in April 2006, and "average" quality for the remaining sampling dates. At Point 2, this index showed almost the same results in all periods (Figure 2). the EPT index (Table 2) was more stable and homogeneous, scoring almost all the samples as "average" or "good" quality, except Point 1 in April 2006, which was designated as "bad."
The HFBI index indicated "average" quality at Point 1 in April 2006 and at Point 2 in October 2005; all other sampling points and dates gave scores of "good" to "very good." These scores were independent of rainfall (Figures 1 and 2). The HFBI index did a poor job assessing water quality in the do Pinto River, scoring Point 2 as "good" or "very good" in almost the entire sampling period (Table 2).
The analysis of the similarity of biotic index scores for a given sampling period revealed that at Point 1 (Figure 3), the two most similar indices were EPT and BMWP'-ASPT (68.26%).
At Point 2, the EPT and BMWP' indices were very similar (93.77%), while the HFBI index was the least similar to the others (53.23%) (Figure 4). Indices showed a higher degree of similarity at Point 2 than at Point 1.
The multiple comparisons test between the sampling periods at each sampling point showed a significant ifference between all the periods at both points, except for April and July 2005 at Point 1. The dominant groups at Point 1 (Table 3) were Baetidae, Leptohyphidae, Blephareceridae, Chironominae, Elmidae, Orthocladinae, and Leptoceridae; at Point 2 they were Chironominae, Elmidae, Leptohyphidae, Tanypodinae, Simuliidae, Hydropsychidae, Baetidae, Calopterygidae, and Hydracarina (Table 4).
FFG's were used as external pattern in order to add more information about the system. In the entire dataset the dominant FFG's were scavengers and scrapers (Table 5). Point 1 showed a higher abundance of all FFG's than Point 2.
We observed a small number of grazers at Point 1 in February 2006 and at Point 2 in April, July and October 2005. We observed a small number of scrapers at Point 2 in April and October 2005 and a small number of filter feeders in almost all samples from Point 2.
Ecological conditions of the do Pinto River at the sites we studied indicate impacts at both sampling points. All four environmental indicators described by the FFG's reflect a disturbed river system.
Based on the criteria used to calculate the FFG proportions (Table 6), the two sampling points showed high levels of heterotrophy in all the sampling periods. In the April 2005 sample from Point 2, the P/R parameter could not be determined because scrapers were absent.
The CPOM/FPOM ratio (the relationship between input of CPOM from the riparian forest and input from shredders which transform CPOM into FPOM) showed a weak relationship at Point 2 in April 2005 and February 2006, and at both points in October 2005 and February 2006. The April 2005 sample at Point 1 showed a weak relationship between the riparian forest and shredders and no relationship at Point 2 in July 2005 or at Point 1 in February 2006. The only sample with a normal relationship was the July 2005 sample from Point 1 (FFG ratio of 0.28).
The TFPOM/BFPOM ratio revealed for all samples and both sampling points a quantity and quality of suspended FPOM that was lower than expected for supporting a filter-feeding population.
Substrate stability (according to Cummins et al. 2005) was poor throughout the study.
Discussion
Recent years have seen renewed efforts to improve the efficiency of biological monitoring tools to assess water resources (Buss et al. 2003, Czerniawska-Kusza 2005). The effective use of these tools requires a better understanding of the organisms that have the greatest influence on biotic index results, as well as of the processes that underlie the distribution and occurrence of bioindicator taxa in the environment.
Distributions of bioindicator taxa are influenced by food availability, hydrological characteristics, nutrient supply, substrate type, predation pressure and natural or anthropogenic disturbances, in addition to variation in water quality itself, which is what makes these biotic indices important tools for assessing the health of rivers (Allan 1995, Buss et al. 2002, 2004, Gonçalves & Aranha 2004, Silveira 2004).
Point 1 yielded many more individual macroinvertebrates (75.65% of the total), with Chironomidae as the dominant taxon; this may be explained by the great colonizing capacity of this group (Gonçalves & Aranha 2004, Carvalho & Uieda 2006) and by its plasticity in resource requirements (Obrdlik & Garcia-Lozano 1992, Strixino & Trivinho-Strixino 1998). At Point 2, which yielded just 24.27% of individual macroinvertebrates, Baetidae was dominant. The presence of riverside vegetation substrates at this point could potentially favor this group, which lacks morphological adaptations for rapids (Ribeiro & Uieda 2005).
The higher abundance of organisms at Point 1 is related to the greater availability of heterogeneous substrates and to the greater coverage of intact riparian vegetation, which offers a greater supply of allochthonous material that serves as both food and substrate for the community. Roque et al. (2003) hypothesized that areas with greater vegetation coverage should have greater taxonomic richness.
The lower frequency of organisms at Point 2 could be related to the loss of riverbank vegetation and its replacement by shrubby, exotic vegetation, and to a lower availability of heterogeneous substrates (mostly sand), as noted by Bueno et al. (2003).
Although April 2005 had the highest monthly rainfall of the study period (685 mm) and that sampling date yielded high numbers of macroinvertebrates at both sampling points (2,356 individuals), we did not find a relationship between rainfall and macroinvertebrate abundances. For example, April 2006 had the lowest rainfall (64.20 mm) but the highest number of collections (2,620). The greater abundance of taxa in the month of April in both years could be related to the biological cycles of the organisms sampled, and may indicate a period in which new individuals are being recruited into the populations.
In classifying water quality at Point 1, the HFBI index gave scores of Good to Very Good, with the exception of April 2006 (Moderate). This result was expected, since this sampling point is located within an environmental protection area, is well-preserved, and has intact riparian vegetation. At Point 2, however, the index did not successfully reflect the obvious anthropogenic impacts there, giving scores similar to those at Point 1 (from Good to Very Good). This index was developed for temperate systems, and has not yet been adapted for South American watersheds. This reduces its usefulness for tropical environments, since it does not include a significant number of families found there. Likewise, while it is a quantitative index, it was not consistent in the analyses of the environment we studied. The HFBI index's lack of scoring for Gripopterigidae and Perlidae (Plecoptera), which are the only two families of Plecoptera recorded in our region (Olifiers et al. 2004) and which are known to be highly sensitive to pollutants (Czerniawska-Kusza 2005, Bispo et al. 2006) is one example. Low-sensitivity taxa are also lacking, such as Culicidae and Thaumaleidae, flies considered tolerant by the BMWP' index (Alba-Tecedor 1996) and present in Brazil.
Water quality at Point 1 was classified by the EPT, and BMWP'-ASPT indices as moderate. Plecoptera, as well as Ephemeroptera and Trichoptera, are considered very sensitive groups and are widely used to assess water quality (Czerniawska-Kusza 2005). The EPT index gave scores of BAD to AVERAGE, with the exception of a sample from October 2005 scored as GOOD. That date corresponds to a rainier period, which may be explained by an increase in the relative proportion of the three EPT families in our overall samples (Bispo et al. 2001), which tend to decrease with greater current flow in rainy periods (Kikuchi & Uieda 1998). Similar scores were found for the BMWP'-ASPT index.
By contrast, the BMWP' index showed excellent scores for Point 1, varying from "good" to "excellent," a result which better reflects the observed conditions. Results of the EPT and BMWP'-ASPT indices were much similar to each other than to those of the BMWP' index. Water quality at Point 2 was scored by all indices as generally bad, with the exception of HFBI. This sampling point had a mostly sandy substrate and showed obvious anthropogenic impacts (e.g., exotic shrubby vegetation along the banks and a road running parallel to the river). The water there had a characteristically unpleasant odor, and decomposing animals were sometimes found in the current.
While the index results for Point 2 were expected, certain aspects deserve special mention. The EPT scores, for example, indicated average water quality, with the exception of one good score in April 2005, because the threshold between average and good in this index is 50%, and the EPT proportion in the April 2005 sample was 54.31%, the score of that sample is very close to average. Caution is required, however, in categorizing water quality classes. Ephemeroptera are adapted to hard substrates and are not frequent in sandy substrates, which may affect the index's results. Bueno et al. (2003) noted that sandy substrates can limit the distributions of species, since they lack hiding places and have low food availability. Future comparisons of these indices may benefit from comparing only sites with similar substrates.
When we assessed the similarity of the biotic indices grouped in the four diagnostic categories of the EPT index for the first and second sampling points, the HFBI index gave the least similar results to the other indices, probably because it is poorly adapted to the local fauna. This result corroborates Semenchenko and Moroz's (2005) similar finding in Belarus.
The analysis of community structure over time suggested that the communities we studied are very dynamic, with individual taxonomic groups increasing and decreasing in abundance throughout the year. It is reasonable to suppose that these changes are reflected in the biotic index scores. However, there was little correlation between proportions and scores. Variation in community structure at Point 1 were only related to the EPT and HFBI indices, and for Point 2 to the HFBI index. The quantitative approach of these indices may obscure the results, since the EPT scores are obtained as the ratio of EPT to the entire sample, while HFBI index scores are obtained based on the proportion of each group.
It is important to note, however, that even a decrease in the proportion of constituent taxa between samples does not necessarily reflect a change in the water quality score. Care must be taken in categorizing water quality classes, as community structure does not necessarily reflect the final scores.
The FFG protocol classified the do Pinto River as a very disturbed system. This analyze added a very important information contributing for a whole comprehension about the river. The ratio of autotrophy to heterotrophy (P/R) revealed an extremely heterotrophic river at the two sampling points, as also found for this same river in 2005 by the authors of the protocol (Cummins et al. 2005). At Point 1 this may reflect the scarcity of primary production, because in headwaters site there is a greater input of allochthonous energy (Vannote et al. 1980). On the other hand, it could reflect low environmental quality at Point 2, where there should be more secondary production.
The CPOM/FPOM values also suggested a poor link between the input of plant material from riparian vegetation and its association with grazers. This relationship was practically nule at the second sampling site, reflecting the absence of intact riparian forest there and the dominance of Brachiaria sp. Cummins et al. (2005) found the same result.
The ratio of transport to deposition of FPOM (TFPOM/BFPOM) reflected grazers' and scrapers' conversion of CPOM into FPOM along the river (Vannote et al. 1980). This process is expected to occur gradually along the length of the system (Allan 1995). Our results showed that the quality and availability of FPOM is very low at both sampling points, independent of sampled period, which may reflect the montane characteristics of the river at Point 1 compared to the broader floodplain character at Point 2. This pattern is different from that found by Cummins et al. (2005), who found high-quality FPOM in the do Pinto River but attributed its presence to rainfall before sampling. Channel stability (i.e., the relative permanence of substrate components) was very poor at almost all of the points in our study. Our result may be related to terrain characteristics: mostly rocky and gravelly substrates with a moderate gradient and strong current at Point 1, and mostly sand substrate with a low gradient and weak current at Point 2. This suggests a similar instability at the two sites but for different reasons: the stretch of river at Point 1 is unstable for natural reasons (i.e., marked gradient, stronger current, rocky bottom) while the stretch of disturbed river at Point 2 may be unstable for unnatural reasons (i.e., a mostly sandy bottom). However, a close comparison of our data with those of Cummins et al. (2005) is not possible, since their article does not state which site(s) they studied on the do Pinto. Given that the river crosses a great variety of landscapes, sedimentary formations, and anthropogenic impacts in its 15 km length, this lack of information compromises our results and serves as a reminder that site selection and the number of sampling points can influence results in a study of this kind.
Studies to assess the performance of biotic indices in Brazil remain rare, although studies of adaptations, corrections, and comparisons of such indices with physical and chemical parameters are common.
We concluded that of all the biotic indices studied, the HFBI index did the worst job of reflecting water quality in this region. We found no one best index, as all of them showed inconsistencies in comparing the water quality values obtained and the compositional structure of the fauna in each point and sampling period. We hypothesize that including sensitive groups of the local fauna may improve the HFBI index's performance in the type of river we studied.
Received 08/02/2011
Revised 29/09/2011
Accepted 06/10/2011
- ALBA-TERCEDOR, J. 1996. Macroinvertebrados acuáticos y calidad de las aguas de los rios. In IX Simpósio del Agua en Andalucia (SIAGA).Almeria, p.203-213.
- ALLAN, D.A. 1995. Stream ecology: structure and function of running waters. Chapman & Hall, London.
- BARBOUR, M.T., GERRITSEN, J., SNYDER, B.D. & STRIBLING, J.B. 1999. Rapid bioassessment protocols for use in streams and wadeable rivers: Peryphiton, Benthic Macroinvertebrates and fish. 2nd ed. Environmental Protection Agency, Washighton.
- BEISEL, J.N., USSEGLIO-POLATERA, P., BACHMANN, V.& MORETEAU, J.C. 2003. A comparative analysis of evenness index sensitivity. Internat. Rev. Hydrobiol.88:3-15. http://dx.doi.org/10.1002/iroh.200390004
- BISPO, P.C., OLIVEIRA, L.G. , CRISCI, V.L. & SILVA, M.M. 2001. A pluviosidade como fator de alteração da entomofauna bentônica (Ephemeroptera, Plecoptera e Trichoptera) em córregos do planalto Central do Brasil. Acta Limnol. Bras. 13:1-9.
- BISPO, P.C., OLIVEIRA, L.G., BINI, L.M. & SOUSA, K.G. 2006. Ephemeroptera, Plecoptera and Trichoptera assemblages from riffles in mountain streams of Central Brazil: environmental factors influencing the distribution and abundance. Rev. Bras. Zool. 66:611-622.
- BUCKUP, L. & BOND-BUCKUP, G. 1999. Os Crustáceos do Rio Grande do Sul. Editora da Universidade UFRGS, Porto Alegre.
- BUENO, A.A.P., BOND-BUCKUP, G. & FERREIRA, B.D.P. 2003. Estrutura da comunidade de invertebrados bentônicos em dois cursos d'água do Rio Grande do Sul, Brasil. Rev. Bras. Zool.20:115-125. http://dx.doi.org/10.1590/S0101-81752003000100014
- BUSS, D.F., BAPTISTA, D.F., SILVEIRA, M.P., NESSIMIAN, J.L. & DORVILLE, L.F.M. 2002. Influence of water chemistry and environmental quality on the macroinvertebrate assemblages in an river basin in south-east Brazil. Hydrobiologia 481:125-136. http://dx.doi.org/10.1023/A:1021281508709
- BUSS, D.F., BAPTISTA, D.F. & NESSIMIAN, J.L. 2003. Bases conceituais para a aplicação de biomonitoramento em programas de avaliação da qualidade da água de rios. Cad. Saúde Pública 19:465-473. http://dx.doi.org/10.1590/S0102-311X2003000200013
- BUSS, D.F., BAPTISTA, D.F., NESSIMIAN, J.L. & EGLER, M. 2004. Substrate specificity, environmental degradation and disturbance structuring macroinvertebrate assemblages in neotropical streams. Hydrobiologia 518:179-188. http://dx.doi.org/10.1023/B:HYDR.0000025067.66126.1c
- CAIRNS, J. & PRATT, J.R. 1993. A history of biological monitoring using benthic macroinvertebrates. In Freshwater biomonitoring and benthic macroinvertebrates. Chapman & Hall, New York, p.10-27
- CALLISTO, M., FERREIRA, W., MORENO, P., GOULART, M.D.C. & PETRUCIO, M. 2002. Aplicação de um protocolo de avaliação rápida da diversidade de habitats em atividades de ensino e pesquisa (MG-RJ). Acta Limnol. Bras. 14: 91-98.
- CALLISTO, M., GOULART, M., MEDEIROS, A.O., MORENO, P. & ROSA, C.A. 2005. Diversity assessment of benthic macroinvertebrates, yeasts and microbiological indicators along a longitudinal gradient in Serra do Cipó, Brazil. Braz. J. Biol. 64:743-755. http://dx.doi.org/10.1590/S1519-69842004000500003
- CARRERA, C. & FIERRO, K. 2001. Manual de monitoreo: los macroinvertebrados acuáticos como indicadores de la calidad del água. EcoCiência, Quito.
- CARVALHO, E.M. & UIEDA, V.S. 2006. Rotas de colonização de macroinvertebrados bentônicos em um riacho do sudeste do Brasil. Acta Limnol. Bras. 18: 367-376.
- CHACÓN, M.M. & SEGNINI, S. 1996. Reconocimiento taxonomico de las Nayades del ordem Ephemeroptera en la deriva de dos rios de alta montaña en el EtadoMerida, Venezuela. Bol. Entomol. Venez. N.S. 11:103-122.
- CORGOSINHO, P.H.C., CALIXTO, L.S.F., FERNANDES, P.L., GAGLIARDI, L.M. & BALSAMÃO, V.L.P. 2004. Diversidade de habitats e padrões de diversidade e abundância do bentos ao longo de um afluente do reservatório de Três Marias, MG. Arq. Inst. Biol. 71:227-232.
- COSTA, J.M., DE SOUZA, L.O.I. & OLDRINI, B.B. 2004. Chave para identificação das famílias e gêneros das larvas conhecidas de odonata do brasil: comentários e registros bibliográficos (Insecta, Odonata). Publ. Avulsas Mus. Nac. 99:1-44.
- CUMMINS, K.W., MERRIT, R.W. & ANDRADE, P.C.N. 2005. The use of invertebrate functional groups to characterize ecosystem attributes in selected streams and rivers in south Brazil. Stud. Neotrop. FaunaEnviron. 40:69-89. http://dx.doi.org/10.1080/01650520400025720
- CZERNIAWSKA-KUSZA, I. 2005. Comparing modifield biological monitoring working party score system and several biological indices based on macroinvertebrates for water-quality assessment. Limnologica35:169-176. http://dx.doi.org/10.1016/j.limno.2005.05.003
- GONÇALVES, F.B. & ARANHA, J.M.R. 2004. Ocupação espaço-temporal pelos macroinvertebrados bentônicos na bacia do rio Ribeirão, Paranaguá, PR (Brasil). Acta Biol. Par. 33:181-190.
- HILSENHOFF, W.L. 1988. Rapid field assessment of organic pollution with a family-level biotic index. J. North Am. Benthological Soc. 7:65-68. http://dx.doi.org/10.2307/1467832
- KIKUCHI, R.M. & UIEDA, V.S. 1998.Composição da comunidade de invertebrados de um ambiente lótico tropical e sua variação espacial e temporal. In Ecologia de insetos aquáticos (J.L. Nessimian & A. L. Carvalho, eds). PPGE-UFRJ, Rio de Janeiro, p.157-173. Series Oecologia Brasiliensis, v.5.
- KOEPPEN, W. 1948. Climatologia versão para o espanhol de Pedro R. Hendrichs Pérez. Fondo de Cultura Econômica, México.
- KOLKWITZ, R. & MARSSON, M. 1909. Ökologie der teirischen Saprobien. Beirtröge zur Lehre von des biologischen Gewasserbeurteilung. Int Rev Gesamten Hydrobiol Hydrogr. 2:126-152.
- KREBS, C.J. 1989. Ecological Methodology. Harper & Row, New York.
- LINKE, S., NORRIS, R.H., FAITH, D.L.P. & STOCKWELL, D., 2005. ANNA: a new prediction method for bioassessment programs. Freshw. Biol. 50:147-158. http://dx.doi.org/10.1111/j.1365-2427.2004.01286.x
- LOPRETTO, E.C. & TELL, G. 1995. Ecossistemas de aguas continentales-metodologias para su estudio. Ediciones Sur, La Plata. Tomo II e III.
- LOYOLA, R.G.N. & BRUNKOV, R.F. 1999.Monitoramento da qualidade das águas de afluentes da margem esquerda do reservatório de Itaipu, período: fevereiro de 1996 a agosto de 1997. IAP, Curitiba.
- LOYOLA, R.G.N. 2000. Atual estágio do IAP no uso de índices biológicos de qualidade. In Anais do V Simpósio de Ecossistemas Brasileiros de Conservação. ACIESP, São Paulo, p. 46-52.
- McCAFFERTY, W.P. 1981. Aquatic entomology: the fisherman's and ecologists' illustrated guide to insects and their relatives. Science Books International, Inc, Boston, MA.
- MERRITT, R.W. & CUMMINS, K.W. 1996. An introduction to the aquatic insects of north america.3nd ed. Kendall/Hunt Publishing Company, Dabuqye Iowa.
- METCALFE, J.L. 1989. Biological water quality assessment of running waters based on macroinvertebrate communities: History and present status in Europe. Environ. Pollut. 60:101-139. http://dx.doi.org/10.1016/0269-7491(89)90223-6
- MOULTON, T.P. 1998. Saúde e integridade do ecossistema e o papel dos insetos aquáticos. In Ecologia de insetos aquáticos (J.L. Nessimian& A. L. Carvalho, eds). Universidade Federal do Rio de Janeiro, Rio de Janeiro, p. 281-298. Series Oecologia Brasiliensis, v.5.
- NIESER, N. & DE MELO, A.L. 1997. Os heterópteros aquáticos de Minas Gerais: guia introdutório com chave de identificação para as espécies de Nepomorpha e Gerromorpha. Editora UFMG, Belo Horizonte.
- OBRDLIK, P. & GARCIA-LOZANO, L.C. 1992. Spatio-temporal distribution of macrozoobenthos abundance in the upper rhine alluvial food plani. Arch. Hydrobiol. Stuttgart. 124(2):205-224.
- OLIFIERS, M.H., DORVILLÉ, L.F.M., NESSIMIAN, J.L. & HAMADA, N. 2004. A key to Brazilian genera of Plecoptera (Insecta) based on nymphs. Zootaxa. 651:1-15.
- PÉREZ, G.R. 1988. Guiapara el estúdio de los macroinvertebradosacuáticos Del Departamento de Antioquia. Editorial PresenciaLtda, Bogotá
- RESH, V.H. & JACKSON, J.K. 1993. Rapid assessment approaches to biomonitoring using benthic macroinvertebrates. In Freshwater biomonitoring and benthic macroinvertebrates (D.M. Rosenberg & V.H. Resh, eds). Chapman & Hall, New York, p. 195-233.
- RIBEIRO, L.O. & UIEDA, V.S. 2005. Estrutura da comunidade de macroinvertebrados bentônicos de um riacho de serra em Itatinga, São Paulo, Brasil. Rev. Bras. Zool. 22(3):613-618. http://dx.doi.org/10.1590/S0101-81752005000300013
- ROQUE, F.O., TRIVINHO-STRIXINO, S., STRIXINO, G., AGOSTINHO, R.C. & FOGO, J.C. 2003. Benthic macroinvertebrates in streams of the Jaraguá State Park (Southeast of Brazil) considering multilple spatial scales. J. Insect. Conserv. 7:63-72. http://dx.doi.org/10.1023/A:1025505323668
- ROSENBERG, D.M. & RESH, V.H. 1993.Freshwater biomonitoring and benthic macroinvertebrates. Chapman & Hall, New York.
- SEMENCHENKO, V.P. & MOROZ, M.D. 2005.Compative analysis of biotic índices in the monitoring system of running water in a Biospheric Reserve.Water Resour. 32:200-203. http://dx.doi.org/10.1007/s11268-005-0025-0
- SILVEIRA, M.P, QUEIROZ, J.F. & BOEIRA, R.C. 2004. Protocolo de coleta e preparação de amostras de macroinvertebrados bentônicos em riachos. Embrapa, Jaguariúna. Comunicado Técnico, n. 19.
- SILVEIRA, M.P. 2004. Aplicação do biomonitoramento para avaliação da qualidade da água em rios. Embrapa, Jaguariúna. Documentos, n. 36.
- SIMBERLOFF, D. & DAYAN, T. 1991.The guild concept and the structure of ecological communities.Ann . Rev. Ecolog. Syst. 22:115-143. http://dx.doi.org/10.1146/annurev.es.22.110191.000555
- SIMPSON, J.C & NORRIS, R.H. 2000. Biological assessment of river quality: development of AusRivAS models and outputs. In Assessing the biological quality of fresh waters: RIVPACS and other techniques (J.F. Wright, D.W. Sutcliffe & M.T. Furse, eds). Freshwater Biological Association, Ambleside, p.125-142.
- STRIXINO, G.& TRIVINHO-STRIXINO, S. 1998. Povoamento de Chironomidae (Diptera) em lagos artificiais. In Ecologia de insetos aquáticos (J.L Nessimian& A.L Carvelho, eds). p. 141-154. v. 5.
- TRIVINHO-STRIXINO, S. & STRIXINO, G. 1995. Larvas de Chironomidae (Diptera) do Estado de São Paulo - guia de identificação e diagnose dos gêneros. EdUSCa, São Carlos.
- VANNOTE, R.L., MINSHALL, G.W., CUMMNIS, K.W., SEDELL, J.R. & CUSHING, C.E. 1980. The river continuum concept. Can. J. Fish. Aquat. Sci. 37:130-137. http://dx.doi.org/10.1139/f80-017
- WALLEY, W.J. & HAWKES, H.A. 1997.A computer-based development of the Biological Monitoring Working Party score system incorporating abundancerating, site type and indicator value.Water Res. 31:201-210. http://dx.doi.org/10.1016/S0043-1354(96)00249-7
- WASHINGTON, H.G. 1984. Diversity, biotic and similarity indices: a review with special relevance to aquatic ecosystems. Water Res. 18:653-694. http://dx.doi.org/10.1016/0043-1354(84)90164-7
- WIGGINS, G.B. 1996. Larvae of the North American caddisfly genera (Trichoptera). 2nded. University of Toronto Press, Toronto.
- WRIGHT, J.F., SUTCLIFFE, D.W. & FURSE, M.T. 2000. Assessing the biological quality of freshwaters: RIVPACS and similar techniques. Freshwater Biological Association, Londres.
- ZAR, J.H. 1999. Biostatistical Analysis. 4nd ed. Prentice-Hall do Brasil Ltda., Rio de Janeiro.
Publication Dates
-
Publication in this collection
19 Apr 2012 -
Date of issue
Dec 2011
History
-
Accepted
06 Oct 2011 -
Reviewed
29 Sept 2011 -
Received
08 Feb 2011