
 Computational intelligence applied to the study of genetic diversity of Brazilian grape cultivars under semi-arid tropical conditions
ABSTRACT
This study aimed to estimate genetic parameters and assess the genetic variability among Brazilian grapevine cultivars through morphoagronomic traits, applying restricted maximum likelihood/best linear unbiased prediction (REML/BLUP) and self-organizing maps (SOM). Thirty-six cultivars were evaluated over two consecutive crop seasons based on 11 morphoagronomic characteristics. Variance components were estimated using the REML/BLUP approach, and cluster analyses were performed using Euclidean distance. Estimates of individual repeatability (r) ranged from 0.67 to 0.95, indicating high consistency across all traits. Selection accuracy was also high, varying from 0.89 to 0.98. Cluster analysis revealed the formation of five distinct groups. The unweighted pair group method using arithmetic mean (UPGMA) grouped 19 cultivars (52.8%) together, while SOM analysis clustered 14 cultivars (38.9%). Cultivars in groups 1 and 5 showed marked genetic dissimilarity for most traits, except for bud fertility index. Both REML/BLUP and SOM proved effective in estimating genetic parameters and detecting genetic diversity among grapevine cultivars. The SOM approach provided a clearer separation of cultivars according to biologically relevant traits related to fruit morphology and productive performance, reinforcing its usefulness as a complementary tool to conventional multivariate methods. The observed high genetic variability indicates potential for heterotic gains, particularly in crosses between divergent cultivars such as ‘BRS Ísis’ and ‘BRS Clara’ (table grapes) and ‘BRS Magna’ and ‘BRS Violeta’ (processing grapes).
Key words
Vitis spp.; REML/BLUP; self-organizing maps; multivariate analysis
INTRODUCTION
Grapevine (Vitis spp.) is among the most economically important fruit crops worldwide, owing to its high commercial value in both fresh fruit markets and processed products such as juices and wines, as well as the broad diversity of cultivars and the high productivity of vineyards (Oliveira et al. 2023). Brazil is the 15th largest grape producer worldwide, contributing approximately 1.7 million tons in an area of 75,000 hectares (FAO 2023); the Lower Middle São Francisco Valley region is quite prominent, with around 30% of Brazilian production (Beling 2022).
The Vitis genus exhibits wide genetic variability in morphoagronomic characteristics. In this context, studies on genetic diversity are essential for breeding programs, as they enable the differentiation of cultivars and the identification of contrasting genotypes for use in strategic hybridizations (Campos et al. 2016).
Traditionally, multivariate statistical techniques have been employed to assess genetic diversity based on qualitative and quantitative traits, with the unweighted pair group method using arithmetic mean (UPGMA) being one of the most applied approaches (Abiri et al. 2020). More recently, plant breeding and genetic diversity studies have incorporated advanced methodologies, such as mixed models, including restricted maximum likelihood/best linear unbiased prediction (REML/BLUP), which allow more accurate estimation of genetic parameters and prediction of genotypic values.
In recent years, advances in computational intelligence and data-driven analytical frameworks have expanded the application of machine learning methods in biological and agricultural research. Recent studies highlight the integration of scalable algorithms, uncertainty-aware modeling approaches, and high-dimensional data analysis to improve pattern recognition and decision-making processes in complex systems (Özüpak 2025, Özüpak and Mansurov 2025a, 2025b, Said et al. 2025, Uzel et al. 2025). These approaches enable the exploration of large datasets and nonlinear relationships that are often difficult to capture using traditional statistical models, thereby enhancing the detection of hidden structures and variability patterns in biological datasets.
Among machine learning techniques, artificial neural networks (ANNs) have shown several advantages over conventional statistical approaches, including their non-parametric nature, tolerance to incomplete data, efficient pattern recognition capacity and ability to establish clusters (Kavzoglu and Mather 2003). Among them, self-organizing maps (SOMs) represent a specific class of ANNs based on competitive learning algorithms that enable visualization of data similarity and the formation of clusters according to distance relationships1. Their effectiveness has been demonstrated in genetic diversity studies in grapevine (Cunha et al. 2025), papaya (Barbosa et al. 2011), guava (Campos et al. 2016), cotton (Cardoso et al. 2021), among others. Thus, this study aimed to estimate genetic parameters and assess the genetic variability among Brazilian grapevine cultivars through morphoagronomic traits, applying REML/BLUP and SOM.
MATERIALS AND METHODS
A total of 36 Brazilian Vitis spp. cultivars (Table 1), grafted onto the ‘IAC 572’ rootstock, were evaluated. The plants, aged between 3 and 10 years old, were from the active grapevine germplasm bank of Embrapa Semiárido, located in Juazeiro, Bahia, Brazil (9°24’S, 40°26’W, 365.5 m altitude). Evaluations were conducted over two consecutive crop cycles, corresponding to the second semester of 2022 and the first semester of 2023. The regional climate, according to Köppen’s classification, is BSwh, semiarid, hot, and dry, and vertisol soil (Cunha et al. 2008).
Thirty-six Brazilian cultivars of Vitis spp. from the grapevine active germplasm bank of Embrapa Semiárido.
The experiment was conducted without a formal experimental design, since the cultivars were evaluated in the field as part of an active germplasm bank collection. Under such circumstances, it is not feasible to implement conventional experimental, or replication schemes typically used for segregating populations. To overcome this limitation, genetic parameters were estimated using Model 63 of the Selegen REML/BLUP software (Resende 2002), which allows analysis in the absence of a defined design and incorporates repeated measurements across crop cycles. This approach has been widely applied in perennial crops in which long-term germplasm evaluations are carried out under field conditions, ensuring robust estimation of genotypic values and variance components despite the lack of experimental design (Carvalho et al. 2023, Costa et al. 2023).
The plants were spaced 3 × 2 m apart and trained on a bilateral cordon using the vertical trellis (espalier) system. Irrigation was performed daily by a drip system, with the applied water volume determined based on crop evapotranspiration. Cultural practices followed the technical recommendations for grapevine cultivation in the region.
Berries were harvested when total soluble solids exceeded 16 °Brix for table grapes and 20 °Brix for wine or processing grapes, as determined using a manual refractometer. The first production cycle extended from 16 August 2022 (pruning) to 1st January 2023 (end of harvest), and the second from 7 February to 27 June 2023. The climatic conditions recorded during these two crop cycles are presented in Fig. 1.

Seasonal rainfall variations (mm); mean, minimum, and maximum temperature (°C); relative humidity (%); and global radiation (MJ·m-2) in the years 2022 and 2023 in the experimental station of Mandacaru, Juazeiro, Bahia, Brazil (9°24’S, 40°26’W).
Eleven morphoagronomic traits were assessed in the 36 grapevine cultivars. Plant vigor was estimated based on the fresh weight of branches and leaves (g) removed during pruning, using a digital scale, and expressed as kg per plant. During the early shoot growth stage, approximately 20 days after pruning, the sprouting percentage (%) was calculated according to Eq. 1:
When the inflorescences became visible, the bud fertility index was calculated according to Eq. 2:
Yield (kg.plant-1) was determined by weighing all bunches harvested from each plant. The number of bunches was obtained by counting the total number of bunches present on the plant at harvest time.
Traits related to bunch morphology were assessed using the mean values of samples composed of five bunches per plant, totaling 20 bunches per cultivar. Bunch weight (g) was measured with a precision balance, whereas bunch length and width were obtained using a ruler and expressed in cm. Berries physical attributes were determined from the mean of 10 berries collected from each of the five previously selected bunches, resulting in a total of 50 berries per plant. Measurements included berry weight (g), length (mm), and diameter (mm).
The estimation of variance components was carried out using the restricted maximum likelihood (REML) method, while phenotypic and genotypic values were predicted through the best linear unbiased prediction (BLUP) approach implemented in the Selegen-REML/BLUP software (Resende 2016). The repeatability model applied, which assumes the absence of an experimental design, can be expressed in matrix notation as follows Eq. 3:
where: y: the vector of observations for the evaluated variable; m: the vector of fixed measurement effects combined with the overall mean; p: the vector of permanent phenotypic effects, considered random; e: the vector of random residuals; X: the incidence matrix corresponding to fixed effects; W: the incidence matrix associated with the random permanent phenotypic effects.
The genotypic values predicted by BLUP were employed to estimate the genetic dissimilarity among genotypes using Euclidean distance as a measure of divergence.
The significance of random effects in the model was assessed through analysis of deviance using the likelihood ratio test, implemented via the lme and gls functions of the R nlme package, following the procedure described by Cunha et al. (2025). The most appropriate model was selected based on the Akaike and Bayesian information criteria, as well as log-likelihood (logLik) values, considering significance levels of p ≤ 0.01 and p ≤ 0.05. Differences among genotypes for each evaluated trait were determined at a 95% confidence interval (Costa et al. 2023), using R software (R Core Team 2020).
Before calculating Euclidean distances for cluster analyses (UPGMA and SOM), the predicted genotypic values obtained via BLUP were standardized to eliminate scale effects among morphoagronomic traits measured in different units (kg, g, and mm), ensuring proportional contribution of all variables to the genetic dissimilarity estimates. Genetic dissimilarity among genotype pairs was then calculated based on Euclidean distance using the Genes software (Cruz 2016), and the resulting dissimilarity matrix was subjected to clustering by the UPGMA, generating a dendrogram to illustrate the genetic relationships among genotypes. The cutoff point for group definition was established according to the criterion proposed by Mojena (1977), and the groups obtained from the UPGMA analysis were subsequently used as reference for constructing the Kohonen SOM network.
As an alternative approach to explore the genetic diversity structure, Kohonen SOMs were applied. Network training was conducted using the Gaussian neighborhood function, testing different architectures by varying the number of rows (1 to 5) and columns (1 to 4). According to Kohonen (2001), defining the number of neurons and learning parameters is an empirical procedure that relies on the researcher’s experience and iterative adjustments. For each configuration, 1,000 training iterations were performed to identify the most stable and efficient network topology. A rectangular map structure was adopted, with Euclidean distance used as the similarity measure in the ANN configuration. The analyses were conducted using the Genes software (Cruz 2016) integrated with the R environment.
Boxplots were constructed to evaluate the distribution of the standardized genotypic values of the analyzed variables within the groups obtained by the UPGMA and SOM methods, aiming to compare the patterns identified by the two clustering approaches. This analysis allowed the visualization of differences in the behavior of the variables among the groups generated by each method. All graphical analyses were performed using the R software.
RESULTS
Based on the likelihood ratio test, significant differences among cultivars were detected for 10 of the 11 morphoagronomic traits evaluated. Only the bud fertility percentage did not differ significantly between the full and fixed models (Table 2). Consequently, cluster analyses were performed using the 10 traits that exhibited significant genotypic effects.
Likelihood ratio test (LRT) among the 11 morphoagronomic traits for the 36 grapevine cultivars: bud fertility index (BF); sprouting percentage (S); fresh matter weight of branches and leaves (WL); yield per plant (kg·plant-1) (Y); number of bunches per plant (NB); weight (g) (WB), length (cm) (LB), and width (cm) (WhB) of the bunches; and weight (g) (WBe), length (mm) (LBe), and diameter (mm) (DBe) of the berries. Petrolina, PE, Brazil, 2022–2023<tfn href="tfn01">*</tfn>.
The variance components estimated by the individual REML analysis for the traits that exhibited significant genotypic effects are presented in Table 3. For all evaluated traits, the largest proportion of the individual phenotypic variance (Vp) was attributed to the permanent phenotypic variance among plants (Vpp).
Overall means, permanent phenotypic variance among plants (genotypic variance plus permanent environment variance over crop seasons) (Vpp), temporary environmental variance (Vet), individual phenotypic variance (Vp), individual repeatability (r = h2) and its confidence interval, repeatability of the average of crop seasons or repeated measures (rm), and selection accuracy based on the average of two crop seasons or repeated measures (Acm).
The Vpp values were high for the variables bunch weight (9,103.99) and number of bunches (321.36), intermediate for berry length (11.57) and bunch length (7.13), and low for berry diameter (5.20), yield per plant (4.81), berry weight (2.24), bunch width (1.92), fresh weight (0.47), and bud fertility index (0.11).
The estimates of individual repeatability (r = h2) ranged from 0.67 to 0.95, indicating high repeatability for all evaluated traits, namely, berry length (0.95), berry diameter (0.92), berry weight (0.88), bunch weight (0.85), number of bunches (0.81), fresh weight of leaves and branches (0.78), bud fertility index (0.77), bunch length (0.75), bunch width (0.69), and yield per plant (0.67) (Table 3). According to the classification proposed by Resende (2002) for repeatability (r) in perennial species: low (r ≤ 0.30), moderate (0.30 < r ≤ 0.60), and high (r ≥ 0.60). The mean selection accuracy (Acm) estimated using the REML procedure ranged from 0.89 for yield per plant to 0.98 for berry length and diameter (Table 3), reflecting high precision and reliability in the genetic parameter estimates.
The genotypic values estimated by the individual BLUP procedure for the traits that showed significant differences among the evaluated cultivars are presented in Table 4.
Individual best linear unbiased prediction (BLUP) for the 36 grapevine cultivars based on bud fertility index (BF); fresh matter weight of branches and leaves (WL); yield per plant (kg•plant-1) (Y); number of bunches per plant (NB); weight (g) (WB), length (cm) (LB), and width (cm) (WhB) of the bunches; and weight (g) (WBe), length (mm) (LBe), and diameter (mm) (DBe) of the berries.
There were variations from 0.21 (‘Benitaka’ and ‘Isaura’) to 1.79 bunch.shoot-1 (‘Isabel Precoce’) for the bud fertility index, from 0.80 (‘Isaura’) to 3.13 kg (‘Aurora’) for fresh weight of branches and leaves, from 1.07 (‘Isaura’) to 7.32 kg (‘BRS Magna’) for yield per plant, and from 7.54 (‘BRS Clara’) to 81.16 (‘Isabel Precoce’) for number of bunches per plant (Table 4). In addition, in relation to the traits inherent to the bunches evaluated, the bunch weight ranged from 55.03 (‘Concord Clone’) to 428.50 g (‘BRS Ísis’), bunch length from 9.28 (‘Concord Clone’) to 19.21 cm (‘BRS Ísis’), and bunch width from 6.01 (‘BRS Melodia’) to 10.76 cm (‘BRS Ísis’) (Table 4). Regarding berry traits, berry weight ranged from 1.68 (‘IAC 138-22’) to 7.66 g (‘Itália Muscat’), berry length from 14.29 (‘IAC 138-22’) to 26.59 mm (‘Itália Muscat’), and berry diameter from 12.92 (‘IAC 138-22’) to 22 mm (‘Itália Muscat’) (Table 4).
The UPGMA cluster analysis, based on genotypic dissimilarity (individual BLUP) of 36 grapevine cultivars for all the traits analyzed, except for bud-break percentage, is represented in Fig. 2. The greatest genetic distance was observed between the cultivars ‘A Dona’ and ‘BRS Ísis’ (0.4976), whereas the smallest distance was observed between ‘BRS Carmem’ and ‘BRS Morena’ (0.0613). These last two cultivars were developed by Brazilian Agricultural Research Corporation (Embrapa) (Table 1).

Dendrogram obtained by unweighted pair group method with arithmetic mean (UPGMA), based on genotypic dissimilarities of 36 Brazilian grapevine cultivars.
According to the dendrogram obtained using the UPGMA clustering method (Fig. 2), and considering the subjective cut-off point k₁ = 1.25 (0.3347), five distinct groups were identified. Group 1 was the most numerous, comprising 19 cultivars (52.8%), including table and processing grapes developed by Embrapa and Agronomic Institute of Campinas (IAC) breeding programs. Group 3 consisted of nine cultivars (25%), while Group 2 included five cultivars (13.9%). Group 5 was formed by two cultivars (5.5%), whereas Group 4 contained only one cultivar (2.8%).
The optimal topology of the Kohonen SOM was defined as a grid composed of five columns and four rows, totaling 20 neurons. A total of 1,000 iterations were performed, which was sufficient to ensure the stability of the network during the training process (Fig. 3).

Number of iterations required of Kohonen’s self-organizing map network based on the mean distance to the closest unit. The number of 1,000 interactions was sufficient to achieve stabilization of the distance between neighbors.
Based on the distances between neighboring neurons illustrated in Fig. 4a, a potential cluster can be identified comprising neurons 11, 12, 16, and 17, due to their proximity. Neurons 11, 16, 18, and 19 were located at a greater distance from neuron 5, but were relatively closer to neurons 12, 13, 14, 15, 17, and 20. Neuron 5, in turn, was positioned closer to neurons 1, 2, 3, 6, and 7 compared with the nearest red neurons (Fig. 4a).
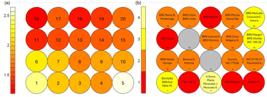
Kohonen’s self-organizing map in rectangular configuration with 20 neurons for 36 grapevine cultivars. (a) Distance between neighboring neurons of Kohonen’s self-organizing map*. (b) Allocation of cultivars and organization of variation established by the self-organizing map network**.
The distribution of cultivars across the neurons is presented in Fig. 4b. Neurons 2, 4, 5, 11, and 18 each contained a single cultivar, while neurons 6, 7, 9, 10, 13, 14, 16, 17, and 19 joined two cultivars each. Neurons 1, 15, and 20 gathered three cultivars each. Neurons 8 and 12 did not contain any cultivars, but this is not considered an analytical error. Since the allocation process is interactive, cultivars that could have been assigned to these neurons were instead distributed to adjacent neurons. Neuron 3 gathered the highest number of cultivars, totaling four, all interspecific hybrids developed by IAC and Embrapa breeding programs.
In the clusters formed by the Kohonen SOM network, five groups were identified (Fig. 5) according to the significance of the analyzed variables.

Grouping according to the importance of the variables analyzed using 20 neurons for 36 grapevine cultivars.
Group 2 (light-green neurons) was the most numerous, comprising eight neurons (3, 4, 8, 9, 10, 13, 14, and 18) and including 14 cultivars (38.9%). Group 1 (red neurons) consisted of four neurons (1, 2, 6, and 7) and encompassed eight cultivars (22.2%). Similarly, Group 5 (purple neurons) was composed of three neurons (15, 19, and 20) and also grouped eight cultivars (22.2%). Group 4 (blue neurons) included four neurons (11, 12, 16, and 17), representing five cultivars (13.9%). In contrast, Group 3 (dark-green neurons) was the smallest cluster, represented by a single neuron (5) and only one cultivar (2.8%).
The distribution of standardized genotypic values for the 10 evaluated variables among the five groups formed by the UPGMA method is presented in Fig. 6. In general, the cultivars allocated to Group 5 showed a tendency toward higher standardized values for several productive and morphological traits, particularly fresh mass of shoots and leaves, yield per plant, cluster weight, cluster length and width, as well as fruit weight, fruit length, and fruit diameter. Cultivars allocated to Group 2 also showed expressive positive values, especially for yield per plant, number of clusters per plant, and cluster dimensions (length and width). In turn, cultivars allocated to Group 3 presented intermediate values for most variables, with moderate emphasis on cluster weight and fruit-related traits (fruit weight, length, and diameter).

Distribution of standardized genotypic values for 10 morphoagronomic traits across clusters defined by unweighted pair group method with arithmetic mean (UPGMA).
In contrast, cultivars allocated to Groups 1 and 4 generally showed negative standardized values for most variables (Fig. 6), indicating lower relative performance. Cultivars allocated to Group 1 presented the lowest values associated with yield and weight-related traits, such as yield per plant, cluster weight, and fruit weight. The cultivar allocated to Group 4, although showing reduced values for several traits, exhibited relatively higher values for bud fertility index, fresh mass of shoots and leaves, and number of clusters per plant.
The distribution of standardized genotypic values of the evaluated variables among the groups formed by the SOM is presented in Fig. 7. Cultivars allocated to Group 1 showed the highest standardized values for cluster weight, cluster length, and cluster width, as well as fruit weight, fruit length, and fruit diameter, in addition to positive values for yield per plant, indicating cultivars with larger fruits and higher productive performance. Cultivars allocated to Group 2 showed positive values for structural traits, particularly bud fertility index, fresh mass of shoots and leaves, yield per plant, and number of clusters per plant, suggesting cultivars with greater capacity for the formation of reproductive structures and good productive performance, although with more moderate values for traits associated with fruit weight.

Distribution of standardized genotypic values for 10 morphoagronomic traits across clusters defined by self-organizing map.
The cultivar allocated to Group 3 stood out by presenting high values for bud fertility index and number of clusters per plant, in addition to positive values for fresh mass of shoots and leaves and yield per plant (Fig. 7). However, this group showed negative values for cluster weight and width and fruit weight, suggesting smaller or less heavy fruits. Cultivars allocated to Group 4 showed intermediate values for most variables, with moderate emphasis on cluster length and width, and fruit length and diameter. In contrast, cultivars allocated to Group 5 generally presented negative standardized values for most evaluated variables, including fresh mass of shoots and leaves, yield per plant, and traits related to clusters and fruits, indicating lower relative performance of these cultivars for production components.
DISCUSSION
Reliable estimates of genetic parameters are essential in breeding programs to identify contrasting genotypes. In this study, the use of a repeatability model under the REML/BLUP framework ensured robust. Similar approaches have been successfully employed in perennial species such as mango (Costa et al. 2023) and grapevine (Sales et al. 2019, Carvalho et al. 2023), allowing precise estimation of genetic parameters in germplasm banks in which experimental designs are not feasible. The high repeatability and accuracy values observed across traits confirm the reliability of the genetic diversity analysis, indicating greater stability of the genotypes in expression of the traits over the crop seasons evaluated.
Despite the advantages of the repeatability REML/BLUP model applied in this study, the absence of a formal experimental design imposes certain limitations on the interpretation of the results. Germplasm bank evaluations are commonly conducted under field conditions without replication structures, which restricts the possibility of strictly controlling environmental heterogeneity (Cunha et al. 2025). Consequently, causal inference regarding genotype performance and the explicit partitioning of genotype × environment interactions cannot be fully addressed (Piepho et al. 2008). Nevertheless, the use of mixed models with repeated measurements helps mitigate these limitations by accounting for permanent phenotypic effects and improving the accuracy of genotypic value predictions (Resende 2007). Even so, future studies conducted under structured experimental designs would be valuable to confirm the stability and performance of the cultivars identified in this work.
Another aspect that should be considered is the restricted temporal and environmental scope of the evaluations. The cultivars were assessed during two crop cycles at a single experimental location in the Brazilian semi-arid region. Although this approach allows the identification of important variability patterns among cultivars under local production conditions, it limits broader inferences regarding long-term stability and adaptability across different environments. Grapevine performance can be strongly influenced by climatic variability, soil conditions, and management practices (Aguilera et al. 2024). Therefore, multi-environment trials conducted across different semi-arid regions and over additional production cycles would provide a more comprehensive understanding of genotype performance and stability (Bernardo et al. 2026).
The mean values obtained for the traits evaluated in this study (Table 3) are consistent with those reported by Carvalho et al. (2023), who analyzed 200 F₁ hybrids derived from 39 crosses among Vitis spp. cultivars over four consecutive crop seasons. The authors reported mean values of 3.03 kg for yield per plant, 211.02 g for bunch weight, 14.13 cm for bunch length, 8.20 cm for bunch width, 2.95 g for berry weight, 18.51 mm for berry length, and 15.97 mm for berry diameter, differing only in the number of bunches, with an average of 15.13. Sales et al. (2019) evaluated 81 table grape hybrids and observed results different from the present study for mean values of number of bunches (48.22) and bunch weight (314.06 g).
It is important to highlight that the aforementioned studies were conducted with new table grape hybrids evaluated in experiments containing only one plant per genotype. In contrast, the present study assessed both table and processing grape cultivars that had already undergone selection and recommendation processes.
The permanent phenotypic variance among plants accounted for most of the total phenotypic variation in all evaluated traits, indicating that environmental effects had a minor influence on their expression. That allowed genetic diversity to be estimated based on the genetic variance of the genotypes for all the traits evaluated. Similar results have been reported in studies on mango (Costa et al. 2023) and grapevine (Sales et al. 2019, Carvalho et al. 2023).
The predominance of permanent phenotypic Vpp over Vet for all analyzed traits indicates the potential to maintain genotype heritability through vegetative propagation or by using these genotypes in new crosses, thereby preserving the desirable characteristics of Brazilian grapevine cultivars. Carvalho et al. (2023) also reported higher Vpp values than Vet for berry weight, length, and diameter, suggesting that environmental effects were less influential than genetic factors for these traits. Conversely, Sales et al. (2019) observed greater Vet values than Vpp for bunch yield and bunch weight in grapevine hybrids. These differences between Vpp and Vet likely reflect variations in the genetic structure of the populations studied, as well as the influence of biotic and abiotic environmental factors.
The genotypic values obtained in this study demonstrated the adequacy of all morphoagronomic traits evaluated in both table and processing grape cultivars (Table 4), meeting the quality standards required by domestic and international markets (Santos et al. 2013).
The REML/BLUP approach, used to estimate genetic variance from phenotypic data, provided greater accuracy in assessing genetic dissimilarity among the Brazilian grapevine cultivars evaluated. Carvalho et al. (2020) used REML/BLUP to estimate the genetic variance in Euterpe edulis based on permanent phenotypic variance and identified estimates of genetic diversity that differed from the common approach using phenotypic data, leading to more accurate estimates of genetic diversity.
The clustering analyses performed using UPGMA and the SOM consistently revealed the presence of five groups among the Brazilian grapevine cultivars. Although both methods identified a similar number of clusters, differences were observed in the allocation of certain cultivars, reflecting the distinct analytical principles underlying each approach. From a biological perspective, these differences appear to be associated with the relative importance assigned to fruit morphology and productive traits during the clustering process.
The UPGMA method tended to group cultivars according to overall similarity in quantitative traits, resulting in clusters that included cultivars with intermediate genotypic values for several variables. In contrast, the SOM approach emphasized more specific patterns of trait association, particularly those related to fruit size and productive capacity. This difference became evident when analyzing the distribution of standardized genotypic values (Figs. 6 and 7), in which the SOM groups showed clearer contrasts between cultivars with large berries and bunches and those characterized primarily by higher reproductive efficiency.
From a biological standpoint, the SOM network separated cultivars with larger berries and heavier bunches into clusters dominated by table grape cultivars, whereas cultivars with greater bud fertility and a higher number of bunches per plant were predominantly associated with groups composed of processing grapes. These patterns are consistent with the breeding objectives of these grape types. Table grapes are typically selected for attributes related to fruit size and appearance, while processing grapes are commonly selected for yield components such as bunch number and fertility (Santos et al. 2013, Oliveira et al. 2024).
Furthermore, the presence of neurons containing mainly interspecific hybrids developed by the breeding programs of Embrapa and IAC indicates that the SOM algorithm was able to capture similarities related to genetic origin and breeding history. These hybrids frequently share common parents such as ‘Concord,’ ‘Bordô,’ and ‘Niágara Branca’ (Brasil 2024), which may explain the proximity observed among them in the neural network structure.
Thus, while UPGMA provides a hierarchical representation of genetic dissimilarity among cultivars, the SOM method offers an alternative perspective by highlighting nonlinear relationships among morphoagronomic traits and enabling a more detailed visualization of genotypic patterns. The complementary nature of these two approaches contributes to a more comprehensive interpretation of genetic diversity among Brazilian grapevine cultivars.
Groups 1 and 4 were predominantly composed of table grape cultivars characterized by larger bunches and berries, traits that are essential for commercial acceptance in the fresh fruit market. In these cultivars, fruit appearance, berry size, and bunch architecture represent key selection criteria because they directly influence consumer preference and market value (Khoje 2018). In contrast, Groups 2, 3, and 5 included mainly processing grape cultivars, in which yield components such as bud fertility and number of bunches per plant were more pronounced. These traits are strongly associated with productivity and are therefore of greater importance in cultivars intended for juice and wine production (Oliveira et al. 2024). This biological differentiation among groups reinforces the consistency of the clustering results and supports the usefulness of the evaluated morphoagronomic traits for discriminating grapevine cultivars according to their breeding purpose.
Vegetative vigor, represented by the fresh biomass of shoots and leaves, also contributed to the differentiation among groups. Higher standardized values for this trait were observed in Groups 2 to 4, indicating cultivars with greater vegetative development and potential capacity for photoassimilate production and carbohydrate storage (Thiesen et al. 2021). In contrast, Groups 1 and 5 showed lower vigor, which may be associated with genetic background or with environmental factors affecting plant growth, including possible disease incidence during the dormancy period (Oliveira et al. 2024).
The genetic similarity observed among grapevine cultivars developed by the two breeding programs in Brazil can be explained by the analysis of their genealogies. Although several cultivars, such as ‘BRS Cora,’ ‘BRS Linda,’ ‘BRS Magna,’ ‘BRS Melodia,’ and ‘BRS Vitória,’ share common parents, including ‘Bordô,’ ‘Concord,’ ‘Saturn,’ ‘Niágara Branca,’ ‘Vênus,’ and ‘BRS Linda’ (Brasil 2024), the results of this study demonstrated the presence of a wide genetic base among the evaluated cultivars, underscoring their relevance and potential use in future grapevine breeding programs.
This suggests opportunities to exploit heterosis through targeted crosses. For example, among table grapes, cultivars grouped in different clusters, such as ‘BRS Ísis’ and ‘Itália Muscat’ (Group 1) in contrast with ‘BRS Clara’ and ‘BRS Linda’ (Group 4), exhibit genetic divergence that can be explored in crosses aimed at achieving a better balance between berry size and vegetative vigor. In the case of processing grapes, combinations between cultivars such as ‘BRS Magna’ (Group 2) and ‘BRS Violeta’ (Group 5) could favor the development of genotypes with potential for higher yield combined with enological quality.
From a breeding perspective, the identification of genetically divergent groups represents an important step toward the development of superior cultivars. Crosses between parents belonging to distinct clusters tend to increase the probability of obtaining segregating populations with broader genetic variability and potential heterotic effects (Bernardo 2020). In practical terms, combining cultivars that exhibit complementary agronomic traits, such as high yield potential, large berry size, and favorable cluster architecture, may contribute to the development of genotypes better adapted to semi-arid conditions (Bernardo 2020). The genotypic values estimated in this study can also serve as a preliminary basis for the construction of selection indices or for guiding the evaluation of progeny populations derived from the proposed crosses (Bernardo 2020).
Finally, studies of this nature are crucial for understanding and broadening the genetic base of grapevine cultivars developed in Brazil. Furthermore, the combined use of REML/BLUP and SOM not only enabled a more precise evaluation of genetic divergence but also represents a valuable strategy to optimize resources and support the selection of parental genotypes for guiding future crosses in grapevine breeding programs.
CONCLUSION
The repeatability coefficients estimated for all traits indicated strong genetic control and high stability of the evaluated characteristics across crop seasons. The REML/BLUP approach provided more precise estimates of genetic divergence among Brazilian grapevine cultivars based on morphoagronomic traits.
Both clustering approaches identified consistent patterns of genetic diversity among the evaluated cultivars. However, the SOM analysis allowed a clearer separation of cultivars according to biologically meaningful traits, particularly those associated with fruit morphology and productive performance. This result highlights the potential of ANNs as a complementary tool to conventional multivariate methods for exploring complex datasets in perennial crops.
High genetic variability in relation to morphoagronomic traits was observed among the cultivars evaluated, providing valuable information to guide parent selection in controlled crosses for grapevine breeding, with potential heterotic gains in combinations such as ‘BRS Ísis’ × ‘BRS Clara’ (table grapes) and ‘BRS Magna’ × ‘BRS Violeta’ (processing grapes).
Future studies integrating multi-environment evaluations and larger datasets may further enhance the application of computational intelligence techniques for supporting data-driven decision-making in grapevine breeding programs.
ACKNOWLEDGMENTS
We are thankful for the support of the Graduate Studies Program in Plant Production (Programa de Pós-Graduação em Produção Vegetal - PPGA-PV) of the Universidade Federal do Vale do São Francisco (UNIVASF) and Brazilian Agricultural Research Corporation (EMBRAPA Semiárido).
-
How to cite:
Cunha, M. A. C., Ishikawa, F. H., Costa, C. S. R. and Leão, P. C. S. (2026). Computational intelligence applied to the study of genetic diversity of Brazilian grape cultivars under semi-arid tropical conditions. Bragantia, 85, e20250229 https://doi.org/10.1590/1678-4499.20250229
-
FUNDING
Coordenação de Aperfeiçoamento de Pessoal de Nível SuperiorGrant No.: 88887.003645/2024Finance code 0001Brazilian Agricultural Research CorporationUniversidade Federal do Vale do São Francisco (Edital 13/2026 PRPPGI/UNIVASF)
-
DECLARATION OF USE OF ARTIFICIAL INTELLIGENCE TOOLS
Artificial intelligence technologies or supported applications and programs were used exclusively as support for the literature review.
-
1
Miljković, D. (2017). Brief review of self-organizing maps. In: Convention on Information and Communication Technology, Electronics and Microelectronics. p. 1061-1066. https://doi.org/10.23919/MIPRO.2017.7973581
DATA AVAILABILITY STATEMENT
The entire dataset supporting the results of this study is available upon request from the corresponding author.
REFERENCES
-
Abiri, K., Rezaei, M., Tahanian, H., Heidari, P. and Khadivi, A. (2020). Morphological and pomological variability of a grape (Vitis vinifera L.) germplasm collection. Scientia Horticulturae, 266, 109285. https://doi.org/10.1016/j.scienta.2020.109285
» https://doi.org/10.1016/j.scienta.2020.109285 -
Aguilera, P., Silva-Flores, P., Gaínza-Cortés, F., Pastenes, C., Castillo, C., Borie, F., Jorquera-Fontena, E., Inostroza-Blancheteau, C., Retamal, J. and Marín, C. (2024). Drivers of arbuscular mycorrhizal fungal diversity across 1,000 km of Chilean vineyards. Journal of Soil Science and Plant Nutrition, 24, 3675-3686. https://doi.org/10.1007/s42729-024-01787-w
» https://doi.org/10.1007/s42729-024-01787-w -
Barbosa, C. D., Viana, A. P., Quintal, S. S. R. and Pereira, M. G. (2011). Artificial neural network analysis of genetic diversity in Carica papaya L. Crop Breeding and Applied Biotechnology, 11, 224-231. https://doi.org/10.1590/S1984-70332011000300004
» https://doi.org/10.1590/S1984-70332011000300004 -
Beling, R. R. (ed.) (2022). Anuário Brasileiro de Horti e Fruti. Santa Cruz do Sul: Gazeta. Available at: https://www.editoragazeta.com.br/produto/anuario-brasileiro-de-horti-fruti-2022/ Accessed on: Nov 30, 2023.
» https://www.editoragazeta.com.br/produto/anuario-brasileiro-de-horti-fruti-2022/ - Bernardo, R. (2020). Breeding for quantitative traits in plants. 3rd ed. Woodbury: Stemma Press.
-
Bernardo, S., Tran, J., Marguerit, E. and Gambetta, G. A. (2026). Disentangling within season sources of variation for field-level phenotyping of grapevine. Tree Physiology, 46, tpag010. https://doi.org/10.1093/treephys/tpag010
» https://doi.org/10.1093/treephys/tpag010 -
Brasil (2024). Registro Nacional de Cultivares (RNC). Brazil: Ministério da Agricultura, Pecuária e Abastecimento. Available at: http://www.agricultura.gov.br/vegetal/registros-autorizacoes/registro/registro-nacionalcultivares Accessed on: Jan. 15, 2024.
» http://www.agricultura.gov.br/vegetal/registros-autorizacoes/registro/registro-nacionalcultivares -
Campos, B., Viana, A. P., Quintal, S. S. R., Barbosa, C. D. and Daher, R. F. (2016). Heterotic group formation in Psidium guajava L. by artificial neural network and discriminant analysis. Revista Brasileira de Fruticultura, 38, 151-157. https://doi.org/10.1590/0100-2945-258/14
» https://doi.org/10.1590/0100-2945-258/14 -
Cardoso, D. B. O., Medeiros, L. A., Carvalho, G. O., Pimentel, I. M., Rojas, G. X., Sousa, L. A., Souza, G. M. and Sousa, L. B. (2021). Use of computational intelligence in the genetic divergence of colored cotton plants. Bioscience Journal, 37, e37007. https://doi.org/10.14393/BJ-v37n0a2021-53634
» https://doi.org/10.14393/BJ-v37n0a2021-53634 -
Carvalho, J. N., Pio, R., Carvalho, P. A., Barbosa, M. A. G. and Leão, P. C. (2023). Estimates of genetic parameters and the selection of table grape hybrids in semiarid regions of Brazil. Euphytica, 219, 35. https://doi.org/10.1007/s10681-023-03163-8
» https://doi.org/10.1007/s10681-023-03163-8 -
Carvalho, M. S., Ferreira, M. F. D. S., Oliveira, W. B. D. S., Marçal, T. D. S., Guilhen, J. H. S., Mengarda, L. H. G. and Ferreira, A. (2020). Genetic diversity and population structure of Euterpe edulis by REML/BLUP analysis of fruit morphology and microsatellite markers. Crop Breeding and Applied Biotechnology, 20, e31662048. https://doi.org/10.1590/1984-70332020v20n4a61
» https://doi.org/10.1590/1984-70332020v20n4a61 -
Costa, C. D. S. R., Lima, M. A. C., Lima Neto, F. P., Costa, A. E., Vilvert, J. C., Martins, L. S. S. and Musser, R. (2023). Genetic parameters and selection of mango genotypes using the FAI-BLUP multitrait index. Scientia Horticulturae, 317, 112049. https://doi.org/10.1016/j.scienta.2023.112049
» https://doi.org/10.1016/j.scienta.2023.112049 -
Cruz, C. D. (2016). Genes Software - extended and integrated with the R, Matlab and Selegen. Acta Scientiarum. Agronomy, 38, 547-552. https://doi.org/10.4025/actasciagron.v38i4.32629
» https://doi.org/10.4025/actasciagron.v38i4.32629 -
Cunha, M. A. C., Ishikawa, F. H., Costa, C. S. R., Lima, M. A. C. and Leão, P. C. S. (2025). Genetic diversity among Brazilian grape cultivars based on the quality and bioactive compounds of the fruit using self-organizing maps. Genetic Resources and Crop Evolution, 72, 10093-10109. https://doi.org/10.1007/s10722-025-02564-z
» https://doi.org/10.1007/s10722-025-02564-z - Cunha, T. J. F., Silva, F. H. B. B., Silva, M. S. L., Petrere, V. G., Sá, I. B., Oliveira Neto, M. B. and Cavalcanti, A. C. (2008). Solos do submédio do vale do São Francisco: potencialidades e limitações para uso agrícola. Petrolina: Embrapa Semiárido. v. 211.
-
[FAO] Food and Agriculture Organization (2023). Food and Agriculture Organization Corporate Statistical Database. FAO. Available at: http://faostat.fao.org/faostat Accessed on: Jan. 12, 2024.
» http://faostat.fao.org/faostat -
Kavzoglu, T. and Mather, P. M. (2003). The use of backpropagating artificial neural networks in land cover classification. International Journal of Remote Sensing, 24, 4907-4938. https://doi.org/10.1080/0143116031000114851
» https://doi.org/10.1080/0143116031000114851 -
Khoje, S. (2018). Appearance and characterization of fruit image textures for quality sorting using wavelet transform and genetic algorithms. Journal of Texture Studies, 49, 65-83. https://doi.org/10.1111/jtxs.12284
» https://doi.org/10.1111/jtxs.12284 - Kohonen, T. (2001). Self-organizing maps. 3rd ed. Berlin: Springer.
-
Mojena, R. (1977). Hierarchical grouping methods and stopping rules: an evaluation. The Computer Journal, 20, 359-363. https://doi.org/10.1093/comjnl/20.4.359
» https://doi.org/10.1093/comjnl/20.4.359 -
Oliveira, C. R. S., Silva, F. B., Felinto Filho, E. F., Mendonça Junior, A. F., Ulisses, C. and Leão, P. C. S. (2023). The influence of rootstock on vigor and bud fertility of ‘BRS Tainá’ grape in the São Francisco Valley. Revista Brasileira de Fruticultura, 45, e-103. https://doi.org/10.1590/0100-29452023103
» https://doi.org/10.1590/0100-29452023103 -
Oliveira, C. R. S., Silva, F. B., Pontes, G. M. A., Mendonça Júnior, A. F. and Leão, P. C. S. (2024). Agronomic performance of ‘BRS Melodia’ seedless table grape grafted onto different rootstocks. Bragantia, 83, e20230245. https://doi.org/10.1590/1678-4499.20230245
» https://doi.org/10.1590/1678-4499.20230245 -
Özüpak, Y. (2025). Real-time detection of photovoltaic module faults using a hybrid machine learning model. Solar Energy, 302, 114014. https://doi.org/10.1016/j.solener.2025.114014
» https://doi.org/10.1016/j.solener.2025.114014 -
Özüpak, Y. and Mansurov, S. (2025a). A hybrid deep learning approach for multi-output short-term electricity demand forecasting. Concurrency and Computation: Practice and Experience, 37, e70356. https://doi.org/10.1002/cpe.70356
» https://doi.org/10.1002/cpe.70356 -
Özüpak, Y. and Mansurov, S. (2025b). Optimizing electricity demand forecasting with a novel RNN-LSTM hybrid model. Energy Sources, Part B: Economics, Planning, and Policy, 20, 2531448. https://doi.org/10.1080/15567249.2025.2531448
» https://doi.org/10.1080/15567249.2025.2531448 -
Piepho, H. P., Möhring, J., Melchinger, A. E. and Büchse, A. (2008). BLUP for phenotypic selection in plant breeding and variety testing. Euphytica, 161, 209-228. https://doi.org/10.1007/s10681-007-9449-8
» https://doi.org/10.1007/s10681-007-9449-8 -
R Core Team (2020). R – A Language and Environment for Statistical Computing. Version 4.0.3. Vienna: R Foundation for Statistical Computing. Available at: https://www.r-project.org/ Accessed on: June 10, 2026.
» https://www.r-project.org/ - Resende, M. D. V. (2002). Genética biométrica e estatística no melhoramento de plantas perenes. Brasília: Embrapa.
- Resende, M. D. V. (2007). Software SELEGEN-REML/BLUP: sistema estatístico e seleção genética computadorizada via modelos lineares mistos. Colombo: Embrapa Florestas.
-
Resende, M. D. V. (2016). Software Selegen-REML/BLUP: a useful tool for plant breeding. Crop Breeding and Applied Biotechnology, 16, 330-339. https://doi.org/10.1590/1984-70332016v16n4a49
» https://doi.org/10.1590/1984-70332016v16n4a49 -
Said, B., Bouguenna, F. I., Ayyoub, Z., Abdullah, M., Özüpak, Y., Bouddou, R., Soleimani, A., Pinnarelli, A., Aslan, E. and Zaitsev, I. (2025). Hybrid MPC–Third-order sliding mode control with MRAS for fault-tolerant speed regulation of PMSMs under sensor failures. International Transactions on Electrical Energy Systems, 5984024. https://doi.org/10.1155/etep/5984024
» https://doi.org/10.1155/etep/5984024 -
Sales, W. S., Ishikawa, F. H., Souza, E. M. C., Nascimento, J. H. B., Souza, E. R. and Leão, P. C. S. (2019). Estimates of repeatability for selection of genotypes of seedless table grapes for Brazilian semiarid regions. Scientia Horticulturae, 245, 131-136. https://doi.org/10.1016/j.scienta.2018.10.018
» https://doi.org/10.1016/j.scienta.2018.10.018 -
Santos, A. E. O., Silva, E. D. O., Oster, A. H., Mistura, C. and Santos, M. O. (2013). Phenological behaviour and thermal requirements of seedless grapes grown in the Submiddle São Francisco River. Revista Brasileira de Ciências Agrárias, 8, 364-369. https://doi.org/10.5039/agraria.v8i3a2313
» https://doi.org/10.5039/agraria.v8i3a2313 -
Thiesen, L. A., Pinheiro, M. V. M., Caron, B. O., Holz, E., Altissimo, B. S., Holz, E. and Schmidt, D. (2021). Water availability and seasonality affect phytomass production and photosynthetic pigments of Aloysia citrodora Paláu. Ciência e Natura, 43, e93. https://doi.org/10.5902/2179460X64581
» https://doi.org/10.5902/2179460X64581 -
Uzel, H., Özüpak, Y., Alpsalaz, F., Aslan, E. and Zaitsev, I. (2025). Acoustic-based fault diagnosis of electric motors using Mel spectrograms and convolutional neural networks. Scientific Reports, 16, 3379. https://doi.org/10.1038/s41598-025-33269-z
» https://doi.org/10.1038/s41598-025-33269-z
Edited by
-
Section Editor:
Renan Uhdre https://orcid.org/0000-0003-2060-0241


 *The central numbers refer to the number of neurons. The color gradient refers to the distance between the nearest red neurons and the most distant yellow ones; **the names in each neuron refer to the evaluated cultivars. The color gradient refers to the number of cultivars allocated within the same neuron.
 V1: bud fertility index; V2: fresh weight of branches and leaves; V3: yield per plant; V4: number of bunches per plant; V5: weight of the bunch; V6: length of the bunch; V7: width of the bunch; V8: weight of the berry; V9: length of the berry; V10: diameter of the berry; Group 1: red neurons; Group 2: light green neurons; Group 3: dark green neurons; Group 4: blue neurons; Group 5: purple neurons.
 BF: bud fertility index; WL: fresh matter weight of branches and leaves; Y: yield per plant (kg•plant-1); NB: number of bunches per plant; WB: weight of the bunches (g); LB: length of the bunches (cm); WhB: width of the bunches (cm); WBe: weight of the berries (g); LBe: length of the berries (mm); DBe: diameter of the berries (mm).
 BF: bud fertility index; WL: fresh matter weight of branches and leaves; Y: yield per plant (kg•plant-1); NB: number of bunches per plant; WB: weight of the bunches (g); LB: length of the bunches (cm); WhB: width of the bunches (cm); WBe: weight of the berries (g); LBe: length of the berries (mm); DBe: diameter of the berries (mm).