ABSTRACT
In the context of plant breeding programs, it is necessary to evaluate the efficiency of genotype selection over successive years. However, evaluating the genotype selection efficiency is not an easy task, since there is not just a single way to precede it. Besides that, the programs need to be dynamic; that is, they should be able to track the introduction and discard of genotypes each year. As a result, the available data is quite unbalanced, leading to difficulties in certain analyses. Thus, the present study aims to propose some approaches to verify the genetic progress in the preliminary trial of the Federal University of Lavras (UFLA) upland rice breeding program. We utilized mixed models for grain yield and plant height. Trials were performed with a total of 120 genotypes in seven environments, defined by the interaction between locations and years. Due to the imbalance in the available data, the mixed model approach, i.e., Restricted Maximum Likelihood/Best Linear Unbiased Prediction (REML/BLUP), was adopted for the joint analysis. Besides the genetic and phenotypic parameters, the expected gains were also obtained with the selection, genetic progress, renewal rate (RR%), and dynamism of preliminary trials. The efficiency of the selection of superior genotypes per year was verified, with genetic progress favorable for reducing the medium-sized plants associated with high yield.
Index terms:
Oryza sativa L; variance components; mixed models.
RESUMO
Dentro dos programas de melhoramento torna-se necessária a avaliação da eficiência de seleção dos genótipos ao longo dos anos. Entretanto, avaliar essa eficiência nem sempre é uma tarefa fácil. Uma vez que não existe uma abordagem única, além disto, os programas de melhoramento necessitam ser dinâmicos com a adição e descarte de genótipos ano a ano. Como resultado tem-se ao final dados muito desbalanceados, o que pode trazer dificuldades para a análise dos dados. Assim, objetivou-se propor abordagens para verificar o progresso genético do experimento Preliminar do Programa de Melhoramento de Arroz de Terras Altas da Universidade Federal de Lavras (UFLA), para produtividade de grãos e altura de plantas. Os experimentos foram conduzidos em sete ambientes, ao longo de quatro safras com um total de 120 genótipos. Para a análise conjunta, em função do desbalanceamento dos dados, foi adotada a abordagem por meio de modelos mistos pelo procedimento de máxima verossimilhança restrita/melhor predição linear não viciada (REML/BLUP). Além de parâmetros genéticos e fenotípicos, foram obtidos também ganhos com a seleção, taxa de renovação (RR%), progresso genético e o dinamismo dos experimentos Preliminares. Foi verificada a eficiência na seleção de genótipos superiores para todos os anos, com ganhos genéticos favoráveis para a redução da altura média de plantas associada com altas produtividades.
Termos para indexação:
Oryza sativa L; componentes de variância; modelos mistos.
INTRODUCTION
In Brazil, one of the greatest challenges faced during upland rice cultivation is crop consolidation and sustainability in different grain production systems, especially no-till farming. The requirement for obtaining and using high-yielding cultivars and high-quality grains for upland rice makes it more arduous than lowland rice. For rice, the average production in the upland system is well below the lowland system. This is mainly due to factors such as weather instability, drought, biotic stresses, the occurrence of diseases, especially the rice blast fungus (Magnaporthe grisea) throughout the rice-growing phase along with different technological inputs in upland rice management (Yang, 2019YANG, X. Adaptive differentiation in upland rice: Bi-directional selection. Molecular Plant, 12(2):143-144, 2019.; Heinemann et al., 2015HEINEMANN, A. B. et al. Variation and impact of drought-stress patterns across upland rice target population of environments in Brazil. Journal of Experimental Botany, 66(12):3625-3638, 2015.; Heinemann; Sentelhas, 2011HEINEMANN, A. B.; SENTELHAS, P. C. Environmental group identification for upland rice production in central Brazil. Scientia Agricola, 68(5):540-547, 2011. ; Villegas et al., 2018VILLEGAS, J. R. et al. Breeding implications of drought stress under future climate for upland rice in Brazil. Global Change Biology, 24(5):2035-2050, 2018.).
In order to evaluate the efficiency of a breeding program, it is necessary to work for several years so as to quantify the genetic gain. This process of selecting the superior performing lines with desired traits and discarding lines with a low performance each year results in substantially unbalanced data.
The mixed model method serves as a critical tool for estimating variance components and predicting the genetic values of individuals accurately. It is conceptualized as the presence of fixed and random effects in the same model (Resende, 2002RESENDE, M. D. V. Genética biométrica e estatística no melhoramento de plantas perenes. Viçosa: Embrapa Informação Tecnológica, 2002. 975p.). In order to use the equations of the mixed models and the BLUP, it is necessary to know the variance and covariance components. Therefore, restricted maximum likelihood (REML) (Patterson; Thompson, 1971PATTERSON, H.; THOMPSON, R. Recovery of inter-block information when block sizes are unequal. Biometrika, 58(3):545-554, 1971.) stands out as a method to be used for unbalanced data since it provides non-negative estimates.
Mixed models have been applied successfully to animal and plant breeding programs. In the latter case, they are used widely for breeding of perennial plants such as selection of cupuassu clones (Maia et al., 2011MAIA, M. C. C. et al. Seleção de clones experimentais de cupuaçu para características agroindustriais via modelos mistos. Revista Agro@mbiente On-line , 5(1):35-43, 2011.), papaya progenies (Pinto et al., 2013PINTO, F. O. et al. Metodologia dos modelos mistos para seleção combinada em progênies segregantes de mamoeiro. Revista Brasileira de Ciências Agrárias, 8(2):211-217, 2013.), sugarcane (Barreto et al., 2019BARRETO, F. Z. et al. A genome-wide association study identified loci for yield component traits in sugarcane (Saccharum spp.). PLoS One, 14(7):e0219843, 2019. ), and evaluation of genotype-environment interactions in sugarcane (Péné; Béhou, 2020PÉNÉ, C. B.; BÉHOU, Y. M. Genotype x environment interactions in sugarcane under irrigation for agronomic traits at advanced screening stage in Ferké, northern Ivory coast. Journal of Experimental Agriculture International, 42(2):97-115, 2020.), maize (Dias et al., 2018DIAS, K. O. D. G. et al. Estimating genotype × environment interaction for and genetic correlations among drought tolerance traits in maize via factor analytic multiplicative mixed models. Crop Science , 58(1):72-83, 2018.), among several studies found in the literature. This method is adapted for annual crop breeding only recently, one of the reasons being the experimentation type involved. As it is worked typically with balanced data, the use of BLUP and traditional analysis through the least-squares method yield the same results. However, in situations of data unbalance, BLUP has a greater advantage over the least-squares method (Entringer et al., 2016ENTRINGER, G. C. et al. Genetic gain estimates and selection of S1 progenies based on selection indices and REML/BLUP in super sweet corn. Australian Journal of Crop Science , 10(3):411-417, 2016.).
The use of mixed models in rice breeding is recent, with only a few studies on this method. Borges et al. (2010BORGES, V. et al. Desempenho genotípico de linhagens de arroz de terras altas utilizando metodologia de modelos mistos. Bragantia, 69(4):833-841, 2010.) evaluated the performance of upland rice genotypes, DoVale, DeLima and Fritsche-Neto (2012DOVALE J. C.; DELIMA, R. O.; FRITSCHE-NETO, R. Breeding for nitrogen use efficiency. In: FRITSCHE-NETO, R.; BORÉM A. (eds). Plant breeding for abiotic stress tolerance. Springer, Berlin, Heidelberg, p.53-65, 2012.) estimated genetic gain in irrigated rice, Colombari Filho et al. (2013COLOMBARI FILHO, J. M. et al. Upland rice breeding in Brazil: A simultaneous genotypic evaluation of stability, adaptability and grain yield. Euphytica, 192:117-129, 2013.) evaluated genotypic stability and adaptability in upland rice, and Streck et al. (2019STRECK, E. A. et al. Genotypic performance, adaptability and stability in special types of irrigated rice using mixed models. Revista Ciência Agronômica, 50(1):66-75, 2019.) evaluated genotypic performance, adaptability, and stability in special rice types.
Resende (2007RESENDE, M. D. V. Matemática e estatística na análise de experimentos e no melhoramento genético. Viçosa: Embrapa Florestas, 2007. 561p.) described several advantages of using mixed models compared to the traditional method of variance analysis. It is useful in cases of data unbalance, allows fitting different models, studying complex data (different years, locations, and trial design types), correcting for environmental effects, estimating components of variance, and predicting genetic values, among others. Moreover, Resende (2007RESENDE, M. D. V. Matemática e estatística na análise de experimentos e no melhoramento genético. Viçosa: Embrapa Florestas, 2007. 561p.) elucidated that the mixed model should not be tested via the F test, as done during the traditional analysis of variance. Instead, the maximum likelihood test, also known as the likelihood-ratio test performed through deviance analysis, is appropriate in such cases. As explained by Borges et al. (2010BORGES, V. et al. Desempenho genotípico de linhagens de arroz de terras altas utilizando metodologia de modelos mistos. Bragantia, 69(4):833-841, 2010.), deviance is derived from the ratio of the likelihood of the complete model to the model without the desired effect.
Therefore, the present study proposes an approach to verify the genetic progress of the upland rice breeding program by utilizing mixed models for grain yield and plant height.
MATERIAL AND METHODS
Field trials description
The genotypes of the preliminary trials were evaluated from seven different environments defined by the interaction between locations and years (Table 1). The trials were carried out at the following locations: Lavras, MG, Brazil, latitude 21°14’S, longitude 44°59’W, altitude 919 m and climate Cwa, at the Center for scientific and technological development in agriculture of the Federal University of Lavras (UFLA); and in Lambari, MG, Brazil, latitude 21°58’S, longitude 45°21’W, altitude 887 m and climate Cwa, at the Empresa de Pesquisa Agropecuária de Minas Gerais (EPAMIG) experimental farm.
Two cultivar checks (BRSMG Caravera and BRS Esmeralda) and thirty-four lines from UFLA’s upland rice breeding program in partnership with Embrapa Arroz e Feijão and EPAMIG were evaluated in each crop year. However, for the seven environments, the dataset was composed of a total of 120 lines as some lines participated as entries of the preliminary trials for more than one crop year.
Throughout the conduction of trials, the following traits were evaluated: a) Grain yield (kg ha-1) - Extrapolation of grain weight from the whole plot plant after harvesting and drying to 13% moisture, converted to kg ha-1; b) Plant height (cm) - Average of the height of five plot plants, measured from the ground to the highest end of the panicle.
The randomized complete block design with three replicates and plots consisting of four rows of 5 m in length and spaced 35 cm apart was used.
Statistical analysis
The individual analyzes for both traits in each environment were performed using the statistical model: : Character value for the i-th genotype in the j-th block, m: Constant associated with all observations, g i: Effect of the i-th genotype where i = 1,2…36, b j: Effect of the j-th block where j = 1, 2...3 and e ij: Random error .
For joint analysis, the mixed model approach was adopted because the dataset was unbalanced. The proposed summarized statistical model was: ; where β, g, c, d and e correspond to vectors of the environment (fixed effect), the effect of genotypes (random), the effect of genotype x environment interaction (random), the effect of replicate within the environment (random), and errors (random), respectively, and X, Z, W and V correspond to the incidence matrices for the referred effects.
Statistical analysis was performed using the R software (R CORE TEAM, 2014R CORE TEAM. R: A language and environment for statistical computing. Vienna, Austria: R Foundation for Statistical Computing. 2014. Available in: <Available in: http://www.R-project.org/ >. Access in: September, 28, 2020.
http://www.R-project.org/...
) through the REML/BLUP procedure. In this procedure, the variance components and genetic parameters were estimated by REML, and the average predictions were fitted by BLUP.
For the individual analysis based on the expected mean square, the estimates of genetic variance () among lines, confidence interval of genetic variance at 5% probability, broad-sense heritability () for selection in the average of lines, error associated with the estimation of , confidence interval, expected gain with selection (GS) for different evaluated parameters, and errors associated to the gain with selection were obtained. Moreover, the experimental coefficient of variation (CVe) and selective accuracy (rgg’) were obtained as precision measurements.
Considering the joint analysis based on the estimated values of the variance components, the broad-sense heritability, the experimental coefficient of variation (CVe), and renewal rate or genotype substitution rate (RR%) given by ; where is the number of genotypes introduced in the year i and is the number of total genotypes evaluated in the year i, were calculated.
RESULTS AND DISCUSSION
Genetic variance and Heritability
To get the expected response to selection, the estimation of genetic variance is essential. Based on these estimates of genotype variance, the variability among the evaluated genotypes for both traits was observed in all environments (Table 2), whose confidence intervals were different from zero. Once the variance is determined, it is possible to obtain the estimates of heritability.
The heritability indicates the phenotypic variance ratio due to the genetic variance. It aids the breeder at the time of selection since it illustrates the confidence of the phenotypic value indicated by the genotypic value. Broad-sense heritability estimates for all environments, along with their respective errors associated with confidence intervals, were calculated (Table 2).
A variation in the magnitude of values was observed between different environments, supporting the discussion proposed by Vencovsky and Barriga (1992VENCOVSKY, R.; BARRIGA, P. Genética biométrica no fitomelhoramento. Riberão Preto: Sociedade Brasileira de Genética, 1992. 486 p.). They stated that an estimate is not constant and is dependent not only on the trait but also on the population and all the environmental conditions related to that trial. Ramalho et al. (2012RAMALHO, M. A. P. et al. Aplicações da genética quantitativa no melhoramento de plantas autógamas. Lavras: Editora UFLA. 2012. 522p.) emphasized that the estimates for each trait show amplitude of values, making the use of highly accurate trials, several environments, and caution in the evaluation of these heritabilities important. Grain yield and plant height showed low to medium heritability estimates on average. In four cases, the value was found to be zero, as expected, since both of these traits are controlled by a large number of genes and are strongly influenced by environmental conditions (DoVale; DeLima; Fritsche-Neto, 2012DOVALE J. C.; DELIMA, R. O.; FRITSCHE-NETO, R. Breeding for nitrogen use efficiency. In: FRITSCHE-NETO, R.; BORÉM A. (eds). Plant breeding for abiotic stress tolerance. Springer, Berlin, Heidelberg, p.53-65, 2012.).
Expected genetic gain and approaches of breeding program’s efficiency evaluation
Another important estimate for breeding programs is the expected gain with selection since it serves as a tool that allows the breeder predict the response to selection even before its accomplishment. Breseghello et al (2011BRESEGHELLO, F. et al. Results of 25 years of upland rice breeding in Brazil. Crop Science, 51: 914-923, 2011.) pointed that genetic gain estimates are very helpful indicators of a method’s efficiency, given that a breeding program is a long-term investment wherein all the decisions made now are seen only years later. The preliminary trials from the UFLA’s upland rice breeding program were composed of lines, and it precedes the value for cultivation and use trial (VCU). The VCU is a mandatory evaluated trial for legal purposes of recommendation and registration of a new cultivar, i.e., it is the last selection step in the program. Therefore, for each environment, the expected selection gain of genotypes selected in the preliminary trial that would compose the VCU for the next crop year was calculated. It makes it possible to verify the success of the UFLA’s breeding program indirectly (Table 3).
Estimates of the expected gains with selection (GS) with the respective estimates of associated errors of the individual analysis by the environment for the traits grain yield (GY, in kg ha-1) and plant height (PH, in cm).
For GY, a positive gain was observed in all environments, ranging from 55.7 to 1056 kg ha-1, with the highest gains in environments 6 and 7. For PH, a size reduction was observed in most of the evaluated environments, and the gains for PH ranged from 1.22 cm to -1.16 cm. The reduction in the rice size is especially desirable for fertilization and management to be performed adequately, without the risk of plant lodging. Besides that, the use of selection indexes and independent selection levels consider not only the grain yield performance of the genotypes but also a response coupled with several traits. Therefore, it can be noted that the gain in magnitude for both traits has been decreased since then.
Another feasible option to evaluate the efficiency of a breeding program is through its dynamism. Silva Junior et al. (2019)SILVA JUNIOR, A. C. et al. Genetic progress over twenty-three years of irrigated rice breeding in southeastern Brazil. Acta Scientiarum. Agronomy, 43(1):e45767, 2020. consider dynamism, i.e., observing the inclusion, exclusion, and renewal of genotypes rate, as the most efficient performance evaluation parameter of a breeding program. The renewal rate (RR%) or genotypic substitution (Table 4) refers to the cycling rate of genotypes over the years and is given by the ratio of the number of genotypes introduced in the trail to the total number of genotypes. The obtained RR% indicates good dynamism, and the crop is considered superior in relation to the rice crop reported by Soares, Ramalho, and Sousa (1994SOARES, A. A.; RAMALHO, M. A. P.; SOUSA, A. F. de. Estimativa do progresso genético obtido pelo programa de melhoramento de arroz irrigado da década de oitenta. Pesquisa Agropecuária Brasileira , 29(1):97-104, 1994.) and DoVale, DeLima and Fritsche-Neto (2012)DOVALE J. C.; DELIMA, R. O.; FRITSCHE-NETO, R. Breeding for nitrogen use efficiency. In: FRITSCHE-NETO, R.; BORÉM A. (eds). Plant breeding for abiotic stress tolerance. Springer, Berlin, Heidelberg, p.53-65, 2012., with rates of 61% and 60%, respectively.
Each crop year is unique and is unlikely to be replicated next year since quantitative traits such as grain yield and plant height are highly sensitive to environmental changes.
Therefore, it is important to have measures to elucidate the effect of the environment on such traits in a particular crop year. For this purpose, the environmental effect (EE) showing the average of two cultivar checks for each trait was calculated per year (Table 4). These cultivars are released lines with homozygosity at all their loci. Thereby, any change in their average in a year is attributed to environmental factors. The crop years II and IV were unfavorable for grain yield selection since they showed an environment effect (EE) lower than the rest years. The same stands true for plant height, as a significant reduction is observed in the cultivar check’s height.
Joint analysis via REML/BLUP
Due to the environmental effect (EE), the analysis cannot be extrapolated to draw conclusions among different crop years. Therefore, a joint analysis using mixed models was performed to have a more concrete view of the genetic progress within the preliminary assay by fitting the averages to the BLUP predicted values. The estimates of variance components obtained through the REML/BLUP, selective accuracy, coefficient of experimental variation, and broad-sense heritability coefficient are presented in Table 5.
The genetic variance and the GxE interaction variance values were significant. The heritability value was observed to be 0.27 for grain yield and 0.16 for plant height, considered to be a low estimate as well the accuracy estimates.
The heritability estimate values (Table 5) are within the range found in the literature (Colombari Filho et al., 2013COLOMBARI FILHO, J. M. et al. Upland rice breeding in Brazil: A simultaneous genotypic evaluation of stability, adaptability and grain yield. Euphytica, 192:117-129, 2013.; Cordeiro; Rangel, 2011CORDEIRO, A. C. C.; RANGEL, P. H. N. Avaliação de populações de arroz irrigado conduzidas por seleção recorrente em várzea de Roraima. Revista Agro@mbiente On-line, 5(3):182-187, 2011.; DoVale; DeLima; Fritsche-Neto, 2012DOVALE J. C.; DELIMA, R. O.; FRITSCHE-NETO, R. Breeding for nitrogen use efficiency. In: FRITSCHE-NETO, R.; BORÉM A. (eds). Plant breeding for abiotic stress tolerance. Springer, Berlin, Heidelberg, p.53-65, 2012.). However, it is important to note that a part of the genetic variance estimated in a single environment is composed of genotype-environment interaction (GxE) and is isolated only in joint analysis, making it more precise and exact (Aragão; Nunes; Queiróz, 2015ARAGÃO, F. A. S. de; NUNES, G. H. S.; QUEIRÓZ, M. A. B. de. Genotype x environment interaction of melon families based on fruit quality traits. Crop Breeding and Applied Biotechnology, 15(2):79-86, 2015.). Therefore, as the heritability estimative in a joint analysis does not consider the interaction component, it is found to be lower than the heritabilities in the individual analysis by environment (Table 2), possibly overestimated by the GxE interaction component.
To evaluate the quality of the experimental data, calculating its accuracy is essential. Accuracy is the correlation between predicted genetic values and the actual genetic values of the individuals. The greater the accuracy, the greater the confidence in the evaluation and in the predicted genetic value (Pimentel et al., 2014PIMENTEL, A. J. B. et al. Estimação de parâmetros genéticos e predição de valor genético aditivo de trigo utilizando modelos mistos. Pesquisa Agropecuária Brasileira, 49(11):882-890, 2014.). In this case, selective accuracy is directly related to heritability; the greater the heritability, the greater the accuracy. A low to medium accuracy was observed, indicating a great influence of environmental factors on the phenotypic variation. A low accuracy does not necessarily correspond to a low experimental conduction quality. Rather, it might be due to a greater influence of environmental factors on the phenotypic variation component or the low genetic variability of the population.
Evaluating the efficiency based on BLUP adjusted means
The average of genotypes maintained from the previous year (year-1), the average of cultivar checks, and the general average of the genotypes of the year are plotted in Figures 1 and 2 for grain yield and plant height, respectively.
For grain yield (Figure 1), the genetic gain based on regression has decreased over the years. This decrease was expected as the breeding program intensified its selection for grain quality traits, as well as for other traits of interest, e.g., early flowering and drought tolerance during the last years. Xu, Chen, and Xu (2015XU, Q.; CHEN, W.; XU, Z. Relationship between grain yield and quality in rice germplasms grown across different growing areas. Breeding Science, 65(3):226-232, 2015.) showed that grain yield has a negative correlation with grain quality, especially chalkiness rate and area in rice, which is in line with what we observed in the genetic progress.
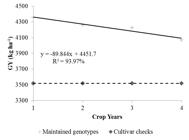
Grain yield (kg ha-1) of the maintained genotypes in relation to the total genotypes and the cultivar checks during crop years. P-value student t: 0.00001.
Cultivar checks, in this case, are upland rice cultivars thrown into the recommended region. Thus, superior yield performance itself elucidates the efficiency of the upland rice UFLA program in conducting and selecting populations with higher yields.
For plant height (Figure 2), a reduction of 1.16 centimeters in the size of maintained genotypes is observed per year. It was noted that the average of the maintained genotypes in year 4 was even lower than the average size of cultivar checks. This proves the efficiency of the UFLA breeding program. The introduction of smaller genotypes every year that are more productive than the cultivar checks does indicate not only the efficiency of preliminary trials but also the genotype selection of previous trails.
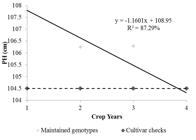
Plant height (cm) of the maintained genotypes in relation to the total genotypes and the cultivar checks during the crop years. P-value student t: 0.0657.
CONCLUSIONS
The efficiency of the selection of superior genotypes in the upland rice program was verified with genetic progress favorable for the reduction of medium-sized plants associated with high yield.
AUTHOR CONTRIBUTION
Conceptual Idea: Moura, A.M.; Botelho, F.B.S.; Methodology design: Moura, A.M.; Botelho, F.B.S; Data collection: Moura, A.M.; Tomé, L.M.; Rodrigues, C.S.; Silva, C.S.C.; Data analysis and interpretation: Moura, A.M.; Botelho, F.B.S. Writing and editing: Moura, A.M.; Botelho, F.B.S.; Silva, M.P.
ACKNOWLEDGMENTS
To the National Council for Scientific and Technological and Development (CNPq) and to the Coordination for the Improvement of Higher Education Personnel (CAPES) for the grants awarded, financial support and scholarships.
REFERENCES
- ARAGÃO, F. A. S. de; NUNES, G. H. S.; QUEIRÓZ, M. A. B. de. Genotype x environment interaction of melon families based on fruit quality traits. Crop Breeding and Applied Biotechnology, 15(2):79-86, 2015.
- BARRETO, F. Z. et al. A genome-wide association study identified loci for yield component traits in sugarcane (Saccharum spp.). PLoS One, 14(7):e0219843, 2019.
- BRESEGHELLO, F. et al. Results of 25 years of upland rice breeding in Brazil. Crop Science, 51: 914-923, 2011.
- BORGES, V. et al. Desempenho genotípico de linhagens de arroz de terras altas utilizando metodologia de modelos mistos. Bragantia, 69(4):833-841, 2010.
- COLOMBARI FILHO, J. M. et al. Upland rice breeding in Brazil: A simultaneous genotypic evaluation of stability, adaptability and grain yield. Euphytica, 192:117-129, 2013.
- CORDEIRO, A. C. C.; RANGEL, P. H. N. Avaliação de populações de arroz irrigado conduzidas por seleção recorrente em várzea de Roraima. Revista Agro@mbiente On-line, 5(3):182-187, 2011.
- DIAS, K. O. D. G. et al. Estimating genotype × environment interaction for and genetic correlations among drought tolerance traits in maize via factor analytic multiplicative mixed models. Crop Science , 58(1):72-83, 2018.
- DOVALE J. C.; DELIMA, R. O.; FRITSCHE-NETO, R. Breeding for nitrogen use efficiency. In: FRITSCHE-NETO, R.; BORÉM A. (eds). Plant breeding for abiotic stress tolerance. Springer, Berlin, Heidelberg, p.53-65, 2012.
- ENTRINGER, G. C. et al. Genetic gain estimates and selection of S1 progenies based on selection indices and REML/BLUP in super sweet corn. Australian Journal of Crop Science , 10(3):411-417, 2016.
- HEINEMANN, A. B. et al. Variation and impact of drought-stress patterns across upland rice target population of environments in Brazil. Journal of Experimental Botany, 66(12):3625-3638, 2015.
- HEINEMANN, A. B.; SENTELHAS, P. C. Environmental group identification for upland rice production in central Brazil. Scientia Agricola, 68(5):540-547, 2011.
- MAIA, M. C. C. et al. Seleção de clones experimentais de cupuaçu para características agroindustriais via modelos mistos. Revista Agro@mbiente On-line , 5(1):35-43, 2011.
- PATTERSON, H.; THOMPSON, R. Recovery of inter-block information when block sizes are unequal. Biometrika, 58(3):545-554, 1971.
- PÉNÉ, C. B.; BÉHOU, Y. M. Genotype x environment interactions in sugarcane under irrigation for agronomic traits at advanced screening stage in Ferké, northern Ivory coast. Journal of Experimental Agriculture International, 42(2):97-115, 2020.
- PIMENTEL, A. J. B. et al. Estimação de parâmetros genéticos e predição de valor genético aditivo de trigo utilizando modelos mistos. Pesquisa Agropecuária Brasileira, 49(11):882-890, 2014.
- PINTO, F. O. et al. Metodologia dos modelos mistos para seleção combinada em progênies segregantes de mamoeiro. Revista Brasileira de Ciências Agrárias, 8(2):211-217, 2013.
- R CORE TEAM. R: A language and environment for statistical computing. Vienna, Austria: R Foundation for Statistical Computing. 2014. Available in: <Available in: http://www.R-project.org/ >. Access in: September, 28, 2020.
» http://www.R-project.org/ - RAMALHO, M. A. P. et al. Aplicações da genética quantitativa no melhoramento de plantas autógamas. Lavras: Editora UFLA. 2012. 522p.
- RESENDE, M. D. V. Genética biométrica e estatística no melhoramento de plantas perenes. Viçosa: Embrapa Informação Tecnológica, 2002. 975p.
- RESENDE, M. D. V. Matemática e estatística na análise de experimentos e no melhoramento genético. Viçosa: Embrapa Florestas, 2007. 561p.
- SILVA JUNIOR, A. C. et al. Genetic progress over twenty-three years of irrigated rice breeding in southeastern Brazil. Acta Scientiarum. Agronomy, 43(1):e45767, 2020.
- SOARES, A. A.; RAMALHO, M. A. P.; SOUSA, A. F. de. Estimativa do progresso genético obtido pelo programa de melhoramento de arroz irrigado da década de oitenta. Pesquisa Agropecuária Brasileira , 29(1):97-104, 1994.
- STRECK, E. A. et al. Genotypic performance, adaptability and stability in special types of irrigated rice using mixed models. Revista Ciência Agronômica, 50(1):66-75, 2019.
- VENCOVSKY, R.; BARRIGA, P. Genética biométrica no fitomelhoramento. Riberão Preto: Sociedade Brasileira de Genética, 1992. 486 p.
- VILLEGAS, J. R. et al. Breeding implications of drought stress under future climate for upland rice in Brazil. Global Change Biology, 24(5):2035-2050, 2018.
- XU, Q.; CHEN, W.; XU, Z. Relationship between grain yield and quality in rice germplasms grown across different growing areas. Breeding Science, 65(3):226-232, 2015.
- YANG, X. Adaptive differentiation in upland rice: Bi-directional selection. Molecular Plant, 12(2):143-144, 2019.
Publication Dates
-
Publication in this collection
24 Nov 2021 -
Date of issue
2021
History
-
Received
23 May 2021 -
Accepted
17 Sept 2021


