 Distinct chemical signatures and quality markers for the discrimination of civet coffee: A metabolomic analysis
ABSTRACT
Civet coffee is a high-value product distinguished by biochemical modifications occurring during passage through the civet gastrointestinal tract. This study aimed to characterize the metabolomic differences between green civet coffee and unprocessed Coffea arabica beans from Vietnam using an untargeted GC-MS-based metabolomics approach for the identification of potential metabolite markers associated with civet coffee authentication. Multivariate analyses, including PCA, PLS-DA, and OPLS-DA, demonstrated a clear separation between the two sample groups, confirming distinct metabolomic profiles. Notably, most detected metabolites, particularly sugars, organic acids, amino acids, and fatty acids, were downregulated in civet coffee, whereas mannitol was consistently upregulated. In total, 23 metabolites were identified as potential discriminative markers contributing to sample classification. Correlation network and pathway enrichment analyses further revealed coordinated alterations in carbon metabolism and amino acid biosynthesis, suggesting that digestive fermentation may induce a system-wide metabolic shift. Overall, these findings provide preliminary evidence supporting the use of metabolite-based approaches for civet coffee authentication and quality control.
Index terms:
Untargeted profiling; food authentication; GC-MS; Coffea arabica
RESUMO
O café civeta é um produto de alto valor agregado, caracterizado por modificações bioquímicas que ocorrem durante a passagem dos grãos pelo trato gastrointestinal da civeta. Este estudo teve como objetivo caracterizar as diferenças metabolômicas entre grãos verdes de café civeta e grãos não processados de Coffea arabica provenientes do Vietnã, utilizando uma abordagem metabolômica não direcionada baseada em GC-MS para identificar de potenciais marcadores metabólicos associados à autenticação do café civeta. As análises multivariadas, incluindo PCA, PLS-DA e OPLS-DA, demonstraram uma clara separação entre os dois grupos de amostras, confirmando perfis metabolômicos distintos. Notavelmente, a maioria dos metabólitos detectados, especialmente açúcares, ácidos orgânicos, aminoácidos e ácidos graxos, apresentou regulação negativa no café civeta, enquanto o manitol foi consistentemente regulado positivamente. Ao todo, 23 metabólitos foram identificados como potenciais marcadores discriminativos que contribuíram para a classificação das amostras. As análises de rede de correlação e enriquecimento de vias metabólicas revelaram ainda alterações coordenadas no metabolismo do carbono e na biossíntese de aminoácidos, sugerindo que a fermentação digestiva pode induzir uma mudança metabólica sistêmica. De modo geral, esses resultados fornecem evidências preliminares que sustentam o uso de abordagens baseadas em metabólitos para a autenticação e o controle de qualidade do café civeta.
Termos para Indexação:
Perfilamento não direcionado; autenticação de alimentos; GC-MS; Coffea arabica
Introduction
Coffee quality is strongly influenced by the chemical composition of coffee beans. Among specialty products, civet coffee is one of the most distinctive and expensive types, produced after coffee cherries pass through the gastrointestinal tract of the Asian palm civet (Paradoxurus hermaphroditus). During this process, exposure to digestive enzymes and microbial activity alters the chemical composition of the beans, contributing to their distinctive sensory properties (Haile & Kang, 2019; Marcone, 2004).
Digestive fermentation may induce metabolic changes affecting proteins, carbohydrates, organic acids, and secondary metabolites in coffee beans (Muzaifa et al., 2020). As a result, civet coffee exhibits a metabolite profile distinct from conventional coffee, with reported differences in organic acids, amino acids, lipids, and alkaloids (Chan & Garcia, 2011; Farah et al., 2005; Ginz & Engelhardt, 2001). For example, NMR-based metabolomic studies reported elevated levels of compounds such as alanine, citrate, lactate, malate, and trigonelline in civet coffee (Farag et al., 2023; Gigl et al., 2021; Jumhawan et al., 2013).
Metabolomics provides a comprehensive approach for profiling food composition using platforms such as NMR, gas chromatography-mass spectrometry (GC-MS), and liquid chromatography-mass spectrometry (LC-MS) combined with multivariate analysis (Erban et al., 2019; Selamat, Rozani & Murugesu, 2021; Zhong et al., 2022). Previous studies have applied these techniques to differentiate civet and conventional coffee, identifying markers such as citric acid, malic acid, and the inositol/pyroglutamic acid ratio (Farag et al., 2023; Zayed et al., 2022). In addition, distinct metabolite signatures in civet coffee have been revealed across analytical platforms such as NMR (Farag et al., 2023; Gigl et al., 2021; Jumhawan et al., 2013), LC-MS (Farag et al., 2023; Gigl et al., 2021), and GC-MS (Garrett et al., 2014). However, most studies have focused on roasted coffee, where thermal processes such as Maillard reactions, caramelization, and lipid oxidation can obscure fermentation-induced differences (Ollennu-Chuasam et al., 2025; Pilipczuk et al., 2015; Şen & Gökmen, 2022). In contrast, analysis of green beans allows more direct assessment of biochemical changes arising from digestive fermentation, particularly in primary and secondary metabolites (Ifmalinda et al., 2019; Mitra et al., 2025).
Metabolomic profiling using GC-MS offers a suitable analytical approach for this purpose (Frolova et al., 2026) due to its high sensitivity, reproducibility, and effectiveness in detecting low-molecular-weight metabolites, including organic acids, amino acids, sugars, and fatty acid derivatives that are often associated with fermentation pathways (Diez-Simon, Mumm & Hall, 2019; Halket et al., 2005; Pereira et al., 2025). GC-MS also benefits from well-established spectral libraries and robust compound identification, enabling reliable comparison of metabolite profiles between sample groups (Frolova et al., 2026).
In this study, we performed a comparative metabolomic analysis of unfermented coffee beans and green bean civet coffee produced in Vietnam. By characterizing the metabolite profiles of these two types of coffee, we aim to identify metabolic differences associated with the digestive fermentation process and to explore potential metabolite markers that may contribute to the discrimination and authentication of civet coffee.
Material and Methods
Sample collection
Ten green civet coffee and nine normal coffee samples of C. arabica were collected in April 2024 from Me Linh Coffee farm, Da Lat City, Lam Dong Province, Vietnam. Civets were housed individually in separate cages within the farm and maintained under routine daily cleaning. During the coffee harvest season, the animals were fed bananas and rice mixed with meat and vegetables during the daytime and fresh coffee cherries at night. Civet coffee beans were collected the following morning after feeding. Because civet coffee samples were pooled across animals, each sample represented a single-day collection batch; the same sampling approach was applied to normal coffee. As no experimental procedures were performed on animals and the farm is officially registered for coffee production under Me Linh Coffee Limited Company, ethical approval for animal experimentation was not required.
Chemical preparation
Methanol (MeOH, ³ 99.9%), camphor-10-sulfonic acid (b) (CSA, 98%), methoxyamine hydrochloride (98%), pyridine (³ 99.9%), and N-methyl-N-trimethylsilyl trifluoroacetamide (MSTFA, ³ 98.5%) were purchased from Merck (Darmstadt, Germany).
A stock solution of CSA was prepared by dissolving 40 mg of CSA in 50 mL of 80% MeOH to obtain a stock concentration of approximately 3.5 mM. Then, working solutions were prepared by dilution the stock solution with 80% MeOH to obtain the concentration of 210 nM.
Derivatization for GC-MS analysis
Each coffee sample was ground finely and filtered through an 0.22 µm filter. Approximately 50 mg of coffee powder was extracted using 1 mL of 80% MeOH containing 210 nM of CSA as an internal standard and sonicated for 15 min at 37 °C. The solution was incubated at 65 oC in 45 min. Afterward, 300 mL of the extracted sample was evaporated at 70 °C for 1 hr using the SpeedVac Vacuum Concentrator. To maintain the carbonyl moieties, the sample residues were methoxymated using 50 mL of methoxyamine hydrochloride solution (20 mg/mL in pyridine) and incubated for 2 hr at 37 oC with constant agitation at 300 rpm. The samples were then trimethylsilylated by adding 70 μl of MSTFA and incubated with the same settings for another 30 min.
GC-MS analysis
GC/MS analysis was performed using a Trace1310 coupled to an ISQ7000 mass spectrometer (Thermo Scientific, Singapore) equipped with a TriPlus 100 LS autosampler. Separation was achieved using a DB-WAX capillary column (30 m × 0.25 mm × 0.25 µm; Agilent Technologies, California, USA). Samples were injected in split mode (40:1) with the injector temperature maintained at 250 °C. Helium was used as the carrier gas at a constant flow rate of 1.2 mL/min. The oven temperature program was as follows: 80 °C for 2 min, increased to 180 °C at 10 °C/min and held for 2 min, then ramped to 290 °C at 5 °C/min and held for 10 min. The total run time was approximately 46 min. The maximum oven temperature was set to 350 °C with an equilibration time of 0.5 min before each run. Data were acquired in full-scan mode over an m/z range of 85-500.
MS-DIAL processing
Raw GC-MS data (cdf) were converted into abf format using Reifycs Analysis Base File Converter (https://www.reifycs.com/abfconverter/) and processed in MS-DIAL version 5.5.251021 for peak detection, spectrum deconvolution and identification (Takeda et al., 2024). Peaks with intensity greater than 1000 were retained. Signal smoothing was performed using a linear weighted moving average method (level 3; peak width 20 scans), with a sigma window value of 0.6, and an EI spectra threshold of 1. Metabolites annotation was based on retention index and mass spectral matching using tolerances of 15 for retention index, 0.5 min for retention time, and 0.5 Da for m/z. Minimum weighted dot product, dot product, reverse dot product, and identification scores were set to 600, 600, 800 and 700, respectively. Feature alignment was conducted based on retention index matching, and only metabolites detected in at least 50% of samples within each group were retained for subsequent analysis.
Multivariate analysis
Multivariate analysis was performed in R using FactoMineR version 2.12 for principal component analysis (PCA) and ropls version 3.22 for partial least squares-discrimination analysis (PLS-DA) and orthogonal partial least squares-discrimination analysis (OPLS-DA) (Thévenot et al., 2015). Model performance was evaluated by 500 permutation tests with 7-fold cross-validation. Variable importance in projection (VIP) scores were used to estimate variable contribution, with VIP > 1.0 considered significant. Differential metabolite was identified using volcano plot analysis based on false discovery rate (FDR) and log2 fold change (log2FC). Metabolites with FDR < 0.05 and log2FC ³ 1.0 were considered upregulated, whereas those with FDR < 0.05 and log2FC £ -1.0 were considered downregulated. Hierarchical clustering analysis was subsequently performed using Euclidean distance and the single linkage method.
Correlation analysis and pathway enrichment
Pairwise metabolite correlations were calculated using Spearman’s rank correlation. Only correlations with coefficients > 0.70 and Benjamini-Hochberg adjusted p-value < 0.05 were considered significant. Pathway enrichment analysis was performed using the KEGGREST package in R based on the Kyoto Encyclopedia of Genes and Genomes (KEGG) database.
Statistical analysis
Data distribution was assessed using the Kolmogorov-Smirnov test, and between-group differences were evaluated using two-sided Student’s t-test with p-value < 0.05 considered statistically significant. All statistical analyses were implemented in R version 4.4.1 (R Core Team, 2021).
Results and discussion
Untargeted metabolomic analysis of normal and civet coffee bean samples
GC-MS analysis identified a total of 46 metabolites, and detailed peak areas are provided in Table 1. Differential analysis using Student’s t-test combined with fold-change criteria identified 26 metabolites that differed significantly between civet and unprocessed green coffee beans (Table 2). Among these, mannitol was the only metabolite upregulated in civet coffee, whereas all remaining metabolites were downregulated.
Multivariate analysis of metabolite data
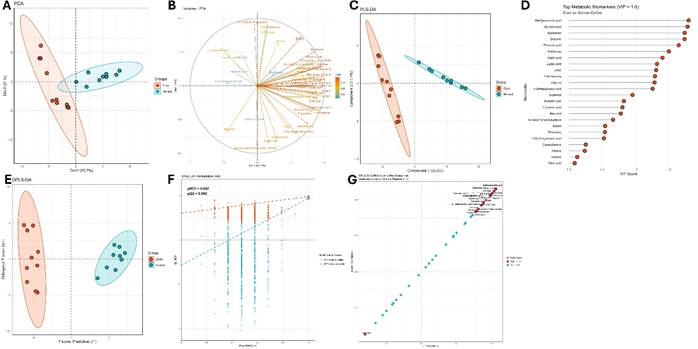
To evaluate metabolomic discrimination between the two groups, multivariate analyses were performed using the identified metabolite dataset (Figure 1). Principal component analysis (PCA) showed that PC1 and PC2 explained 53.7% and 21.0% of the total variance, respectively, and clearly separated civet and unprocessed coffee samples without obvious outliers. Civet coffee samples also exhibited greater dispersion, indicating higher variability in metabolite composition. Several metabolites, including ribitol, 2-hydroxybutyric acid, arabinose, glucose, and threonic acid, contributed strongly to sample separation.
The PCA results were further supported by partial least squares discriminant analysis (PLS-DA), in which the first two components explained 53.2% and 17.4% of the variance, respectively (Figure 1C). Variable importance in projection (VIP) analysis identified 24 metabolites with VIP values greater than 1.0, including methylsuccinic acid, glyceric acid, galactose, and glucose (Figure 1D). Orthogonal PLS-DA (OPLS-DA) further improved group discrimination, yielding high explanatory and predictive performance (R2Y = 0.976; Q2 = 0.934) (Figure 1E). Model robustness was confirmed by permutation testing (p < 0.01) (Figure 1F). Combining the statistically significant metabolites with OPLS-DA markers identified 23 overlapping metabolites as potential quality markers, including methylsuccinic acid, galactose, glyceric acid, glucose, arabinose, threonic acid, 3-methylglutaric acid, malic acid, lactic acid, glycine, erythritol, linolenic acid, palmitic acid, citric acid, and mannitol.
Quality markers and pathway analysis
The volcano plot illustrates the distribution of significantly upregulated and downregulated metabolites in civet coffee relative to unprocessed green coffee samples (Figure 2). Hierarchical clustering and box-and-whisker plots of the potential quality markers further revealed both intra- and inter-group variation in metabolite abundance, while clearly separating the two groups (Figure 2B and Figure 3). Among those 23 identified quality markers, only mannitol was upregulated in civet coffee, whereas all other metabolites were downregulated. Notably, several metabolites, including galactose, glucose, and glyceric acid, were nearly absent in civet samples. On the contrary, mannitol was negligible in unprocessed green coffee but remarkably elevated in civet coffee.

Multivariate analysis of civet and unprocessed green coffee samples. (A) PCA plot of the first two principal components; (B) PCA variable correlation plot, arrow colors are scaled according to the cos2 values of the corresponding metabolites; (C) PLS-DA score plot; (D) Variable importance in projection (VIP) scores of discriminant metabolites; (E) OPLS-DA score plot; (F) Permutation test results for OPLS-DA model validation; (G) S-plot derived from the OPLS-DA model.

Volcano plot and hierarchical clustering of metabolites in civet and unprocessed green coffee samples. (A) Volcano plot of all identified metabolites; (B) Heatmap of differential metabolites. Metabolites were clustered using hierarchical clustering analysis and annotated according to their subclass in the KEGG databases.

Box-and-whisker plots of potential quality markers. The red boxes represent the civet coffee group, while the blue boxed represents the unprocessed green coffee group. The median peak intensity is indicated by the central line within each box, and the 5th and 95th percentiles are shown at the lower and upper bounds, respectively. Individual data points corresponding to each sample are overlaid on the plots. Statistical comparisons between the two groups were performed using a two-sided Student’s t-test, and significance levels are indicated above each plot (*: p<0.05, **: p<0.01, ***: p<0.001, ****: p<0.0001).

Correlation network and KEGG enrichment analysis. (A) Correlation network of all identified metabolites. Nodes represent metabolites clustered into four modules by Louvain algorithm and are colored accordingly. Edges indicate the direction of correlation between metabolite pair: positive (red) and negative (blue). Potential quality markers identified from OPLS-DA are highlighted with triangular shape. (B) Pathway enrichment analysis of potential quality markers based on the KEGG database. Point color corresponds to the adjusted p-value, while point size reflects the number of metabolites enriched in each pathway. (C) Two KEGG pathways with the most extensively characterized metabolic reactions in C. arabica. Green arrows indicate reactions that have been reported in C. arabica. Red circular nodes represent enriched metabolites, whereas white nodes and black arrows denote compounds and reactions from the global KEGG metabolic maps.
To further elucidate the relationships among identified metabolites, a metabolite correlation network was constructed, followed by pathway enrichment analysis of the 23 quality markers using the KEGG database (Figure 4; Table 3). Most metabolites exhibited strong positive correlations, whereas only a few pairs showed negative correlations, notably oxalic acid with 3,6-anhydro-D-galactose, and threonic acid with mannitol. In addition, network analysis revealed that the largest cluster (module 1) contained a substantial proportion of quality markers, while the remaining markers were primarily grouped within a second major cluster (module 2). These modules were strongly interconnected (Figure 4), which suggests a coordinated and global metabolic shift in coffee beans associated with exposure to the civet gastrointestinal tract.
Subsequent pathway enrichment analysis indicated that the identified markers were involved in multiple KEGG pathways. However, the metabolic network of C. arabica remains incompletely characterized, with limited experimentally validation of enzymes and reactions. Although some pathways such as ABC transporters included several annotated metabolites, their biochemical roles in C. arabica remain unclear. In contrast, carbon metabolism and biosynthesis of amino acids are better characterized. Within carbon metabolism, four markers (glycine, glyceric acid, malic acid, and citric acid) were involved. Noticeably, malic acid and citric acid are biochemically linked through reaction sequences involving oxaloacetic acid as a key intermediate and aspartic acid associated with transamination reactions. The biosynthesis of amino acid pathway also included glycine, proline, citric acid and threonine, with particular emphasis on the reversible conversion between glycine and threonine. These findings highlight coordinated alterations in central carbon and amino acid metabolism that may underlie the metabolic differentiation between civet and unprocessed coffee beans.
Overall, the results of untargeted GC-MS-based metabolomic analysis were consistent with previous studies reporting differences in volatile compounds, such as caffeine, trigonelline, amino acids and sugars and phenolic constituents, between civet and normal coffee (Farag et al., 2023; Hájíček et al., 2025). The key discriminative metabolites identified here were primarily associated with sugars, organic acids, amino acids, and fatty acids, indicating substantial perturbations in central carbon and amino acid metabolism. Furthermore, correlation network and pathway enrichment analyses suggested a coordinated and system-wide metabolic shift, rather than isolated changes in individual compounds. Collectively, these findings highlight the profound impact of civet gastrointestinal processing on the chemical composition of coffee beans and provide a foundation for identifying metabolite-based quality markers for civet coffee authentication.
Two fatty acids, palmitic and linolenic acid, were identified among the twenty-three potential quality markers. In the present study, both compounds were downregulated in civet coffee. However, a previous study comparing Robusta civet coffee with normal coffee using GC-MS analysis of fatty acid methyl esters reported no significant differences in the levels of these two fatty acids between groups. This discrepancy may reflect species-specific metabolomic responses, suggesting that metabolite profiles are not conserved across coffee varieties and that metabolic pathway modifications in Robusta civet coffee may differ from those in Arabica. In addition, the limited sample size in the previous study (n = 5 per group) may have reduced its representativeness (Mitra et al., 2025).
Glyceric acid, malic acid, arabinose, and citric acid were also highlighted as noticeable markers for the civet coffee group, all exhibiting a decreasing trend. These compounds have previously been reported in GC-MS-based metabolomic analysis between civet and non-civet coffee (Jumhawan et al., 2015). In that study, the discriminative power of malic acid and citric acid was further supported by a subsequent qualitative validation. However, their peak intensities were reported to be upregulated in civet coffee, in contrast to the present findings. This inconsistency may be attributed to the small validation dataset (n = 3 per group), which limits the robustness and generalizability of the results.
It is suggested that the gastrointestinal fluid with numerous digestive enzymes and microbiome induces the metabolic shift of coffee beans. Iswanto et al. (2019) identified Methylobacterium populi, Klebsiella quasipneumoniae, Raoultella ornithinolytica and Stenotrophomonas chelatiphaga in Luwak feces eating green coffee bean. In addition, Watanabe et al. (2020) reported that Gluconobacter species, such as G. frateurii and G. japonicus, may dominate the microbiome and influence the tricarboxylic acid (TCA) cycle of coffee beans. Notably, Gluconobacter spp. lack succinate dehydrogenase, resulting in an incomplete TCA cycle, which has been proposed to promote the accumulation of malic and citric acids in civet coffee (Watanabe et al., 2020). However, the opposite trend observed in the present study may reflect geographical variation in civet gut microbiome composition. Furthermore, as malic acid and citric acid are involved in multiple KEGG pathways, their downregulation cannot be attributed to a single metabolic mechanism.
Differences in civet diet between Indonesian and Vietnamese production systems may partly explain the inconsistent organic acid profiles reported across studies. Diet strongly influences gut microbiota composition and microbial fermentation activity (Zhang, 2022). In Indonesian kopi luwak production, civets are commonly fed mainly coffee cherries and fruits, whereas the civets in the present Vietnamese farm received mixed diets including rice, vegetables, meat, and coffee cherries. Such dietary variation may alter microbial communities and substrate availability in the gastrointestinal tract, thereby influencing tricarboxylic acid-related metabolism and contributing to the observed downregulation of malic and citric acids in our civet coffee samples compared with previous reports (Jia et al., 2025; Li et al., 2025).
This study provides preliminary insights into the metabolomic profile of civet coffee and proposes candidate markers for authentication. However, several limitations should be acknowledged. First, the untargeted GC-MS approach provides only relative quantification, and further targeted validation using larger and more diverse sample sets is required. Although the sample size used here is acceptable for exploratory metabolomic studies, broader sampling across geographic regions and civet populations would improve the robustness and generalizability of the findings. Second, volatile compounds, which contribute substantially to coffee aroma, were not comprehensively characterized. Third, despite derivatization, GC-MS has limited metabolome coverage, and the integration of high-resolution LC-HRMS would improve the detection and structural elucidation of polar and semi-polar metabolites, including alkaloids, peptides, and polyphenols. Finally, civet gut microbiota likely plays a central role in shaping metabolomic variation, but microbiome composition was not directly characterized in this study. Future studies integrating metabolomics, microbiome profiling, and sensory analysis may therefore provide a more comprehensive framework for civet coffee authentication and quality assessment.
Conclusion
In this study, GC-MS-based metabolomics was used to profile civet and unprocessed green coffee beans and identify quality markers. Multivariate analysis showed clear group separation, indicating a distinct civet-associated metabolomic signature. Twenty-three metabolites were proposed as markers, with mannitol consistently upregulated, while most sugars, organic acids, and amino acid-related compounds were downregulated. These changes suggest a coordinated metabolic shift driven by digestive processes, though further validation with targeted and high-resolution methods is required due to limited metabolome coverage.
Author Contribution
Conceptual idea: Hoa, Q. N.; Oanh, T. K. N.; Methodology design: Nhung, P. N.; Oanh, T. K. N.; Data collection: Hai, D. L.; Nguyen, T. L.; Giang, N. T.; Tam, T. T. T.; Data analysis and interpretation: Nhung, P. N.; Quang, H. V. P.; and Writing and editing: Nhung, P. N.; Hoa, Q. N.; Oanh, T. K. N.
Acknowledgments
This work was supported by the University of Science and Technology of Hanoi (USTH) under grant number USTH.GED.01/24-25 .
Data Availability Statement
Data available upon request to authors.
References
- Chan, S., & Garcia, E. (2011). Comparative physicochemical analyses of regular and civet coffee. The Manila Journal of Science, 7(1):19-23.
- Diez-Simon, C., Mumm, R., & Hall, R. D. (2019). Mass spectrometry-based metabolomics of volatiles as a new tool for understanding aroma and flavour chemistry in processed food products. Metabolomics, 15:41.
- Erban, A. et al. (2019). Discovery of food identity markers by metabolomics and machine learning technology. Scientific Reports, 9:9697.
- Farag, M. A. et al. (2023). Metabolite profiling of premium civet luwak bio-transformed coffee compared with conventional coffee types, as analyzed using chemometric tools. Metabolites, 13(2):173.
- Farah, A. et al. (2005). Effect of roasting on the formation of chlorogenic acid lactones in coffee. Journal of agricultural and food chemistry, 53(5):1505-1513.
- Frolova, N. et al. (2026). Gas chromatography-mass spectrometry (GC-MS) in the plant metabolomics toolbox: GC-MS in multi-platform metabolomics and integrated multi-omics research. International Journal of Molecular Sciences, 27(3):1343.
- Garret, R. et al. (2014). Ambient mass spectrometry employed for direct analysis of intact arabica coffee beans. Journal of the Brazilian Chemical Society, 25(7):1172-1177.
- Gigl, M. et al. (2021). Identification and quantitation of reaction products from quinic acid, quinic acid lactone, and chlorogenic acid with strecker aldehydes in roasted coffee. Journal of agricultural and food chemistry , 69(3):1027-1038.
- Ginz, M., & Engelhardt, U. H. (2001). Identification of new diketopiperazines in roasted coffee. European Food Research and Technology, 213:8-11.
- Haile, M., & Kang, W. H. (2019). The role of microbes in coffee fermentation and their impact on coffee quality. Journal of Food Quality, 2019:4836709.
- Hájíček, J. et al. (2025). Comparative analysis of chemical composition and antioxidant activity in conventional, civet, and elephant coffees: Is there a definitive authentication marker of elephant coffee? Beverages, 11(3):79.
- Halket, J. M. et al. (2005). Chemical derivatization and mass spectral libraries in metabolic profiling by GC/MS and LC/MS/MS. Journal of Experimental Botany, 56(410):219-243.
- Ifmalinda, I. et al. (2019). Chemical characteristics comparison of palm civet coffee (kopi luwak) and arabica coffee beans. Journal of Applied Agricultural Science and Technology, 3(2):280-288.
- Iswanto, T. et al. (2019). Isolation and identification of caffeine-degrading bacteria from soil, coffee pulp waste and excreted coffee bean in Luwak feces. Biodiversitas Journal of Biological Diversity, 20(6):1580-1587.
- Jia, Y. et al. (2025). From diet to microbiota: How fruits and vegetables influence gut microbiota. International Journal of Food Science and Technology, 60(1):vvae008, 2025.
- Jumhawan, U. et al. (2015). Application of gas chromatography/flame ionization detector-based metabolite fingerprinting for authentication of Asian palm civet coffee (Kopi Luwak). Journal of Bioscience and Bioengineering, 120(5):555-561.
- Jumhawan, U. et al. (2013). Selection of discriminant markers for authentication of Asian palm civet coffee (Kopi Luwak): A metabolomics approach. Journal of agricultural and food chemistry , 61(33):7994-8001.
- Li, Y. et al. (2025). Formation mechanism and nutritional effects of organic acids in fermented foods: A review. Journal of Food Science, 90(12):e70745.
- Marcone, M. F. (2004). Composition and properties of Indonesian palm civet coffee (Kopi Luwak) and Ethiopian civet coffee. Food Research International, 37(9):901-912.
- Mitra, R. et al. (2025). Civet Robusta and natural Robusta coffee are different on key fatty acid methyl esters and total fat. Scientific Reports , 15:36281.
- Muzaifa, M. et al. (2020). Chemical composition of green and roasted coffee bean of Gayo arabica civet coffee (kopi luwak). Paper presented at the IOP Conference Series: Earth and Environmental Science, 425:012001.
- Ollennu-Chuasam, P. et al. (2025). Effect of the roast level on lipophilic and hydrophilic compounds in pot and filter coffee beverages. ACS Food Science & Technology, 5(6):2187-2202.
- Pereira, G. V. M. et al. (2025). Integrated microbial-metabolomic analysis reveals how fermentation contributes to the unique flavor of African Arabica coffee. Food Chemistry: Molecular Sciences, 12:100344.
- Pilipczuk, T. et al. (2015). The influence of roasting and additional processing on the content of bioactive components in special purpose coffees. Journal of Food Science and Technology, 52:5736-5744.
- Selamat, J., Rozani, N. A. A., & Murugesu, S. (2021). Application of the metabolomics approach in food authentication. Molecules, 26(24):7565.
- Şen, D., & Gökmen, V. (2022). Kinetic modeling of Maillard and caramelization reactions in sucrose-rich and low moisture foods applied for roasted nuts and seeds. Food Chemistry, 395:133583.
- R Core Team. (2021). R: A language and environment for statistical computing.
- Takeda, H. et al. (2024). MS-DIAL 5 multimodal mass spectrometry data mining unveils lipidome complexities. Nature Communications, 15:9903.
- Thévenot, E. A. et al. (2015). Analysis of the human adult urinary metabolome variations with age, body mass index, and gender by implementing a comprehensive workflow for univariate and OPLS statistical analyses. Journal of Proteome Research, 14(8):3322-3335.
- Watanabe, H. et al. (2020). Gluconobacter dominates the gut microbiome of the Asian palm civet Paradoxurus hermaphroditus that produces kopi luwak. PeerJ, 8:e9579.
- Zayed, A. et al. (2022). Dissecting coffee seeds metabolome in context of genotype, roasting degree, and blending in the Middle East using NMR and GC/MS techniques. Food Chemistry , 373:131452.
- Zhang, P. (2022). Influence of foods and nutrition on the gut microbiome and implications for intestinal health. International Journal of Molecular Sciences, 23(17):9588.
- Zhong, P. et al. (2022). Untargeted metabolomics by liquid chromatography-mass spectrometry for food authentication: A review. Comprehensive Reviews in Food Science and Food Safety, 21(3):2455-2488.
-
Editor de seção:
Renato Paivahttp://orcid.org/0000-0001-5107-0285