Determination of full maturity in soybean using machine-learning models and UAV imagery
Abstract
This study proposes a machine-learning approach to predict soybean maturity using climatic variables and unmanned aerial vehicle (UAV) data, focusing on Brazilian high-altitude tropical conditions. The objective was to evaluate and compare different models for predicting days to full maturity, first using climatic variables exclusively and then incorporating the Green Leaf Index (GLI). Eight algorithms were initially tested, and the three best-performing models were re-evaluated with inclusion of the GLI. Model performance was assessed using R², mean absolute error (MAE), and root mean square error (RMSE). Random forest (RF), support vector machine (SVM), and k-nearest neighbors (KNN) showed the highest accuracy, with RF outperforming the others. The inclusion of the GLI improved predictions by capturing the decline in canopy greenness. These findings demonstrate that combining machine learning, climatic data, and vegetation indices is an efficient, low-cost approach for predicting soybean maturity, supporting high-throughput phenotyping in breeding programs.
Keywords:
Remote sensing; phenotyping; climatic variables; vegetation indices
INTRODUCTION
Soybean (Glycine max (L.) Merr.) is one of the most extensively studied and economically significant crops worldwide. In Brazil, it is the main commodity crop, with a cultivated area of approximately 47.4 million hectares and production volume of around 169 million tons (USDA 2025). Soybean yield performance is largely influenced by climatic factors, particularly solar radiation and water availability. Solar radiation is essential for photosynthesis and related developmental processes, such as stem elongation, branching, and grain filling. Water deficits at any stage can reduce yield; however, the germination-emergence and flowering-grain filling phases are particularly sensitive. During these phases, water demand reaches 7-8 mm.day⁻¹, and water deficits can lead to leaf senescence, flower and pod abscission, and incomplete grain filling (Cohen et al. 2021, Santos et al. 2021).
Temperature is a key regulator of crop growth and development, influencing morphological, anatomical, metabolic, and enzymatic processes. Together with photoperiod, temperature controls developmental transitions in soybean, with plant responses varying across growth stages (Staniak et al. 2023). Soybean is a photoperiod-sensitive crop. Consequently, cultivars are released considering their limited adaptability to differences in latitude, and crop regions reflect these differences. This sensitivity is quantified using relative maturity groups (RMGs), which indicate the number of days from emergence to pod maturity (Zdziarski et al. 2018, Silva et al. 2020). However, soybean maturity is strongly influenced by environmental conditions. Consequently, the RMGs rarely show a uniform effect from these environmental factors across different fields (Carvalho et al. 2017, Zdziarski et al. 2018).
Cultivating a variety outside the appropriate RMG can result in undesired lengthening or shortening of the crop cycle, insufficient or excessive vegetative growth, susceptibility to seasonal pests and diseases, and low yield (Miladinović and Đorđević 2011). Therefore, rapid and precise monitoring of soybean lines is necessary to facilitate decision making in breeding and agricultural management (Moeinizade et al. 2022). Determining the number of days to full maturity is essential in plant breeding programs (Volpato et al. 2021). The conventional method relies on visual assessment, typically conducted when approximately 95% of the pods in a plot exhibit their mature color (yellow, brown, or black) (Fehr and Caviness 1977). However, visual assessments are labor-intensive and must be performed frequently across large-scale trials (Zhou et al. 2019). Moreover, human error and subjectivity reduce the reliability of recorded maturity dates (Volpato et al. 2021).
To enhance accuracy and efficiency, optical sensors have been explored as an alternative for estimating soybean maturity (Lindsey et al. 2020). In recent years, unmanned aerial vehicles (UAVs) have become more accessible and versatile, enabling the acquisition of high-resolution spatial and temporal aerial imagery (Zhu et al. 2024). These systems support the assessment of several traits in breeding programs, including determination of full maturity.
The success of image-based approaches in breeding programs depends on the appropriate selection of analytical algorithms and statistical models (Van Eeuwijk et al. 2019). Advances in remote sensing systems and machine-learning techniques offer efficient and cost-effective tools for supporting decision making in crop breeding (Liakos et al. 2018).
For instance, Yu et al. (2016) successfully used multispectral UAV imagery combined with a random forest statistical model to classify maturity stages in over 90% of experimental plots. Similarly, Moeinizade et al. (2022) developed a hybrid model combining convolutional neural networks (CNN) and long short-term memory (LSTM) networks to estimate soybean maturity using UAV imagery, showing superior performance compared to local regression (LOESS). Zhou et al. (2019) also demonstrated the potential of using multispectral UAV imagery along with partial least squares regression (PLSR) to estimate maturity dates across different soybean lines.
Considering the increasing adoption of algorithmic solutions in agriculture, machine learning (ML) has emerged as a powerful tool capable of supporting all stages of crop production. These technologies help solve field challenges, support decision making, and improve resource allocation (Sharma et al. 2020). However, the accuracy of ML techniques depends on the selection of input variables, the number of crop seasons, the training datasets, the implementation strategies, and the complexity of the research problems (Kumar et al. 2023). Evaluating the performance through comparisons of multiple ML models is a criterion for finding the appropriate ML model to accurately predict the target variable of interest (Gauriau et al. 2024).
In this context, the application of ML-based approaches using climate variables as predictors emerges as a promising alternative for soybean maturity prediction. Although previous studies have explored this topic, the application of these methodologies under Brazilian field conditions, particularly in high-altitude tropical climates, remains limited. Therefore, the main objective of this study was to evaluate and compare the performance of different machine-learning models in predicting the days to soybean maturity, initially using climate variables as input data and, in a second step, re-evaluating the best-performing models by incorporating the GLI obtained using UAVs.
MATERIAL AND METHODS
Sites
The experiments were carried out at two locations:
a) An experimental area at the Center for Scientific and Technological Development in Agriculture (CDCT) of the Federal University of Lavras (UFLA, at lat 21° 12′ 11″ S, long 44° 58′ 47″ W and 954 m asl), in the municipality of Lavras, Minas Gerais, Brazil.
b) An experimental area at the Center for Scientific Development and Technological Transfer in Agriculture (CDTT) of the Federal University of Lavras (UFLA, at lat 21° 09′ 24″ S, long 44° 55′ 34″ W and 920 m asl), in the municipality of Ijaci, Minas Gerais, Brazil.
Experimental procedures
Climate-based models were evaluated using an initial set of 30 cultivars. However, for the final integrated analysis incorporating both climatic variables and vegetation indices, the dataset was narrowed to 20 common varieties that were consistently tested across all locations and growing seasons. These cultivars were developed by the following entities: Monsoy, DuPont Pioneer, Syngenta, Nidera, CCGL-Tec, Brasmax, INT Sementes, Agroeste, Tropical Melhoramento Genético (TMG), DonMario, and Embrapa.
The experiments were conducted in Lavras during the 2018/19 and 2021/22 crop seasons and in Ijaci during the 2019/20 and 2021/22 crop seasons. A randomized complete block design (RCBD) was used, with two replicates and plots of four 5-meter rows. Crop management practices were carried out according to crop needs, following the procedures described by Soares et al. (2020), with modifications.
The number of days to full maturity (DFM) was recorded when 95% of the plants in each plot had reached the R8 stage, that is, when 95% of the pods exhibited mature coloration (yellow, brown, or gray) (Fehr and Caviness 1977).
Image acquisition
The experiment was conducted at the CDCT of UFLA by collecting data from the 2021/2022 crop season to estimate maturity through high-throughput phenotyping. Aerial images were acquired using a DJI Phantom 4 Pro Advanced drone (DJI Technology Co., Ltd.), equipped with a red-green-blue (RGB) digital camera. All flight missions were carried out between 10:00 a.m. and 1:00 p.m. at an altitude of 30 meters with a cruising speed of approximately 5 m s-1. The images had a ground sampling distance (GSD) of approximately 0.80 to 0.85 cm, with 80% forward overlap and 70% lateral overlap. Waypoints and flight paths were automatically generated using the flight planning software Pix4Dcapture (v4.8.0; Pix4D SA, Prilly, Switzerland).
Four permanent ground control points (GCPs) were established at the vertices of the experimental field area to ensure accurate georeferencing of the images. Georeferencing was carried out using a real-time kinematic Global Navigation Satellite System (GNSS RTK) instrument.
The images were processed using Agisoft Photoscan 1.4 software (Agisoft LLC, St. Petersburg, Russia). Spatial references were initially corrected according to the specifications for SIRGAS 2000 UTM 23S. The images were then aligned (triangulation and automatic detection of tie points and matching via automatic image correlation), a dense point cloud was created, the image texture was built, a digital elevation model (DEM) was generated, the images were orthorectified, and the final orthomosaic was produced.
The points obtained through the topographic survey (GNSS RTK) were interpolated using ArcGIS 10.1 software (Esri 2012) to obtain a study surface designated as control. For vegetation analysis, the soil background and other features were removed from the orthomosaic using color thresholds. After the background was removed, the soybean plots were segmented from the orthomosaic, creating a grid framework for vegetation index calculations.
Crop maturity was evaluated using the Green Leaf Index (GLI) (Gobron et al. 2000). This vegetation index uses algebraic operations of values obtained from different visible spectral bands. The selection of a vegetation index from among the various indices available in the literature was based on the spectral bands utilized in the drone camera and on the purpose for which the index was developed, as well as on reports of the efficiency of the index for determining maturity (Volpato et al. 2021).
Climatic data acquisition
The present study considered soybean development and progression toward physiological maturity as influenced by the following climatic variables: photosynthetically active radiation (PAR), minimum temperature (Tmin), maximum temperature (Tmax), and precipitation (PREC).
These climatic data were obtained by inputting the geographic coordinates of each soybean field trial into the Prediction of Worldwide Energy Resource (POWER) program within a platform obtained through the National Aeronautics and Space Administration (NASA) - NASA POWER. The sowing and physiological maturity dates were specified for each trial, ensuring the extraction of all climate information corresponding to the crop cycle. The resulting datasets were exported in CSV format and integrated into the machine-learning models for analysis and prediction of days to full maturity.
The climatic data were retrieved in a grid format. Solar radiation and PAR were derived from satellite-based products, while temperature and other meteorological data were obtained at a grid spatial resolution of 0.5° latitude by 0.625° longitude (Stackhouse et al. 2021).
For solar radiation estimation, the NASA POWER system integrates data from the Global Energy and Water Exchanges (GEWEX) program and the Clouds and the Earth’s Radiant Energy System (CERES), along with data from additional satellite sensors that capture atmospheric composition, vapor content, and cloud properties. Temperature and precipitation data originate from the Global Modeling and Assimilation Office (GMAO) models, specifically the Modern-Era Retrospective Analysis for Research and Applications, Version 2 (MERRA-2) and the Goddard Earth Observing System, Version 5.12.4 (GEOS 5.12.4) (Stackhouse et al. 2021).
Machine-learning models
Training/testing splits of 70/30, 80/20, and 60/40 were evaluated to assess model accuracy. However, considering the dataset, the 70/30 and 80/20 partitions resulted in test sets that were too limited to provide reliable model evaluation. Among the splits tested, 60/40 offered the best balance between training size and testing reliability and also delivered the highest overall performance. Therefore, the 60/40 combination was adopted in the study.
The dataset was randomly split into 60% for training and 40% for the cross-validation data. The cross-validation was adjusted with ten iterations of resampling (i.e., folds; numbers = 10) and ten repeated k-fold cross-validations (repetitions = 10). The repeated k-fold cross-validation was then applied to each model. The test dataset for each model was conducted using 500 bootstrap iterations. The results from each model, predicted from the test dataset, were compared using the coefficient of determination (R²), root mean square error (RMSE), and mean absolute error (MAE).
Random forest (RF)
Random forest (RF) is an ensemble learning method that combines the predictions of multiple decision trees, each trained on different data subsets. RF trains many decision trees on various parts of the training data and then calculates the average of their predictions to obtain a more robust and accurate model. Key parameters in RF models are the number of decision trees and the number of features used for splitting (Schonlau and Zou 2020). In this study, the RF model was trained using 500 trees or estimators (). For the node splitting process, the value of the hyperparameter controlling the number of sampled variables at each split () was optimized and set at three.
K-nearest neighbors (KNN)
The k-nearest neighbors (KNN) algorithm is a simple, non-parametric machine-learning method that can be applied to both classification and regression tasks. It operates by identifying the K nearest training examples in the feature space to predict the target variable. The number of neighbors (K) and the distance metric are the most important parameters in KNN. Commonly used distance metrics include Euclidean distance, Manhattan distance, and cosine similarity (Guo et al. 2003). In this study, the hyperparameter optimization process based on minimization of the RMSE determined that the optimal number of neighbors (hyperparameter K) is K=1.
Support vector machine (SVM)
The support vector machine (SVM) uses a concept known as the kernel trick to transform input data into a higher-dimensional space, where it can be separated by a hyperplane. The main advantage of SVM is its ability to handle non-linear decision boundaries. The regularization parameter (C) in SVM helps prevent overfitting. The SVM algorithm is sensitive to the choice of the kernel function and the value of the regularization parameter (Ray et al. 2017). The model was implemented using a radial base function (RBF) kernel. The optimal hyperparameters, determined by the tuning process, were regularization parameter and kernel width parameter .
Linear regression (LM)
The linear regression (LM) model provides the simplest type of fit for a dataset. It involves assigning a coefficient to each independent variable and a vertical axis intercept value that defines the best-fit line for the data (Maulud and Abdulazeez 2020).
Ridge regression (RG)
Ridge regression (RG) aims to address the issue of multicollinearity among explanatory variables by adding a penalty to the regression coefficient estimator derived from the least squares method. The Ridge estimator has a parameter λ, the value of which can be selected through cross-validation. More details on Ridge regression can be found in Marquardt and Snee (1975).
LASSO regression (LASSO)
The Least Absolute Shrinkage and Selection Operator (LASSO) is a regression method used to reduce the effects of attributes that do not contribute to identifying the response variable (Tibshirani 1996). The LASSO estimator has a parameter λ, where each value of λ leads to a different set of estimated coefficients.
The main differences between Ridge and LASSO regressions are the penalty used to estimate the regression coefficients and the fact that LASSO regression forces some coefficient estimates to be equal to zero, resulting in a smaller number of covariates (Hoerl and Kennard 1970).
Elastic net regression (EN)
The Elastic Net (EN) regression method aims to obtain the advantages of both Ridge and LASSO regression methods while providing new properties that these methods lack. The method minimizes the sum of squared residuals subject to a linear combination of the constraints from the Ridge and LASSO methods (Zou and Hastie 2005).
Model performance
To evaluate the predictive performance of the machine-learning models, three statistical metrics were employed: R², MAE, and RMSE. These metrics provide complementary information regarding the accuracy, precision, and explanatory capacity of the models, allowing a robust assessment of their performance under the studied conditions.
The R² represents the proportion of variance in the data explained by the model. A higher R² value indicates a greater explanatory power of the model, showing a closer fit between model’s prediction and the observed data (Kutner et al. 2005).
The MAE quantifies the average difference between the actual and predicted values. However, because there are both positive and negative values, the absolute value of the difference is taken. Furthermore, this metric is not affected by outliers (Chai and Draxler 2014).
The RMSE metric calculates the average difference between the predicted and observed values, similar to the MAE metric. However, instead of taking the absolute value of the difference between y and ŷ, the RMSE squares the difference. Consequently, it penalizes large differences between the predicted and observed values. Therefore, the higher the RMSE value, the worse the model performs in relation to the predictions. However, to address the issue of unit differences, the square root is applied (Chai and Draxler 2014).
RESULTS AND DISCUSSION
The predictive capabilities and stability of the tested models differed significantly. Model performance was evaluated using the RMSE, MAE, and R². The results highlight the differences among the models and show that the Ridge model had the poorest predictive performance, resulting in the highest values for RMSE and MAE and the lowest R², along with the lowest prediction accuracy. In contrast, the SVM model demonstrated the best performance for estimation using climatic variables, with an R² of 0.99, RMSE of 0.99, and MAE of 0.81 (Figure 1a-c).
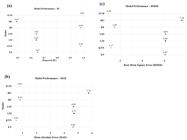
Predictive performance metrics for the machine-learning models for estimating days to full maturity (DFM): (a) Coefficient of determination (R²), indicating the proportion of variability explained by each predictive algorithm. (b) Room-mean-square error (RMSE, in days), illustrating differences in prediction error magnitude across algorithms and providing insight into their relative accuracy in estimating DFM. (c) Mean absolute error (MAE, in days), illustrating differences in absolute prediction error magnitude and aiding in the assessment of each algorithm’s reliability in estimating DFM.
The predictive abilities of the models were compared to identify the optimal configuration for maturity prediction. The results show that the RF, KNN, and SVM models demonstrated better predictive abilities, with R² values of 0.98, 0.98, and 0.99, respectively, in the validation set. As shown in Figure 1a-c, the RF, KNN, and SVM models demonstrate the best overall performance, indicating that these models best predict soybean maturity when associated with climatic variables.
Full maturity is an important trait in breeding programs, as it allows for classification of the cultivar cycle (early and late) and helps determine the most suitable latitude range for cultivars. Early maturity is one of the key traits currently required by Brazilian soybean producers. Early maturity allows farmers in major soybean production regions in the “Cerrado” biome to cultivate maize or cotton in a second crop season, from February to July, thereby increasing the profitability of the agricultural system (Teodoro et al. 2021, Volpato et al. 2021, Gastl Filho et al. 2022).
The performance metrics R², RMSE, and MAE indicate the superiority of the RF, KNN, and SVM machine-learning models for maturity prediction. These models are able to resolve complex and multi-dimensional relationships. They can flexibly map intricate patterns, are less sensitive to outliers, are effective in modeling interactions between variables, and capture non-linear and non-parametric patterns (Sharma et al. 2020).
Figure 2c shows the importance of the climatic variables. The PREC and Tmax variables were the most important factors for the random forest model, accounting for 52.44% and 44.26% of the total variation, respectively.
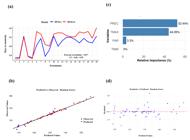
Performance evaluation, variable importance, and error diagnostics of the Random Forest (RF) model: (a) Line chart comparing observed (DFM.o, blue line) and RF-predicted (DFM.rf, red line) average days to full maturity across 20 soybean cultivars; (b) Scatter plot of observed versus predicted values, where each point represents an individual cultivar across the maturity range; (c) Relative contribution of climatic variables - precipitation (PREC), maximum temperature (Tmax), photosynthetically active radiation (PAR), and minimum temperature (Tmin) - to predictive performance; and (d) Residual diagnostic plot displaying the relationship between predicted values and residuals to assess model bias, homoscedasticity, and error distribution patterns.
The trained models were subsequently applied to a dataset comprising 20 cultivars across distinct maturity groups. In this second step, the Green Leaf Index (GLI) was added to the climatic variable dataset for each model. Introduction of this index aimed to improve model prediction of days to full maturity by capturing the decline in canopy greenness. The mean values of observed days to full maturity (DFM.o) and predicted days to full maturity (DFM.p) for each selected model with the addition of the GLI vegetation index are shown in Table 1.
Breeders typically evaluate physiological maturity (R8) visually, which is a time-consuming, labor-intensive, and subjective task. Integrating machine-learning tools with remote sensing can assist in optimizing data collection, reducing costs, and minimizing error. Moreover, as breeding programs require evaluation of a large number of lines across different environments, the use of high-throughput phenotyping tools facilitates rapid and, above all, accurate evaluation of hundreds of thousands of plots (Yu et al. 2016, Zhou et al. 2019, Jangra et al. 2021, Song et al. 2021, Kahrıman et al. 2023).
The cultivars showed a variation of 9.5 days for the observed mean values of physiological maturity. The early-maturity cultivars reached maturity in 123 days, whereas the late-maturity cultivars completed their cycle in 133 days. The RF, KNN, and SVM prediction models showed variations of 14.2, 26, and 0.9 days, respectively, for the predicted mean values for early and late maturity cultivars.
Performance metrics revealed that the RF model most accurately predicted days to full maturity. The RF model showed lower RMSE and MAE values (3.10 and 2.36) and higher r and R² values (0.87 and 0.76). In contrast, the KNN model exhibited the poorest performance, with higher RMSE and MAE values (12.78 and 9.23) and lower r and R² values (-0.53 and 0.28). The high magnitude of the Pearson correlation (r) at 0.87 indicates the good fit of the RF model.
An analysis of the prediction errors (Δ) presented in Table 1 shows that the KNN model exhibited the largest divergences, with values ranging from -5 to +26 days. KNN overestimated cycle length for cultivars such as BRS5601RR, BRS5804RR, DM5.8i, and INT7100IPRO, whereas cycle length was underestimated for cultivars such as AS3680IPRO, BRS6203RR, and 96Y90. The RF model displayed small, stable errors (-1 to + 6 days). The SVM showed intermediate performance (-1.4 to + 8 days). No clear pattern in prediction errors could be associated with maturity group (M.G.) - both early and late-maturity cultivars exhibited high and low errors across different models. Thus, deviations appear to be primarily related to the sensitivity of each algorithm, particularly the vulnerability of KNN to GLI-driven noise, rather than to the maturity cycle of the cultivars. Overall, RF demonstrated greater accuracy and consistency across all evaluated maturity groups.
The integration of high-throughput phenotyping with machine-learning models shows that the use of vegetation indices for determining soybean maturity is an efficient strategy. Specifically, the RF model outperformed the other models, resulting in lower average MAE and RMSE, and higher average r. The superiority of RF over shallow learning algorithms is due to its ability to manage multiple model parameters, reduce estimation bias, and overcome overfitting issues (Teodoro et al. 2021).
Figure 2a shows the behavior of the RF model through comparison of the phenotypic averages obtained in the field trial and the predicted values for days to full maturity in soybeans. The RF model showed better performance in predicting the average days to full maturity, due to better performance metrics. The high magnitude Pearson correlation (r) at 0.87 highlights the good fit of the RF model.
Figure 2b shows high correlation between observed and predicted values. This pattern indicates high accuracy and robust ability of the model to predict DFM across the full range of values. The absence of curvature or significant spread suggests no systematic overestimation or underestimation. Figure 2d reinforces this result, as the residuals are symmetrically distributed around zero, without sloped bands or structured patterns. This random dispersion indicates that the errors are essentially unsystematic and that the model does not exhibit bias associated with the predicted values. Furthermore, no clear increase in residual variance is observed, suggesting homoscedasticity (Hickey et al. 2019). The main objective of the present study was to integrate breeding tools, machine learning, and remote sensing to estimate days to full maturity in soybean. Training diverse machine-learning models with environmental variables represents an effective strategy, as breeding programs conduct multi-environment trials (METs) in which a set of genotypes is tested across different environments (locations, years, or combinations of them). The recommendation of genotypes for specific environments or the design of mega-environments are key objectives in plant breeding programs (Olivoto et al. 2019).
The implementation of remote sensing phenotyping (RSP) facilitates the prediction of agronomic variables, such as days to full maturity, although this implementation remains a challenge, especially when considering indirect methods. However, the ability to quickly and more thoroughly assess various agronomic characteristics is an incentive to refine these techniques (Teodoro et al. 2021).
The use of vegetation indices is one such refinement. For instance, combining the normalized difference vegetation index (NDVI) with piecewise regression techniques has successfully estimated relative maturities, yielding strong correlations ranging from 0.76 to 0.98 when comparing them with manual measurements. These methodologies are highly promising and can be useful in breeding programs to more efficiently and precisely phenotype maturity in lines (Narayanan et al. 2019).
An RF model was previously developed based on remote sensing images captured with a multispectral camera. The model adopted a classification approach (mature and non-mature) at individual time points, and it proved to be accurate. However, the challenge with this binary classification approach lies in non-uniform maturation among plots, which may limit precision depending on the frequency of flights performed (Yu et al. 2016, Volpato et al. 2021).
One of the main advantages of the RF model is its ability to manage high-dimensional datasets and make accurate predictions even when the data are highly correlated. The RF model is also capable of handling missing values and outliers (Rodriguez-Galiano et al. 2012).
Selection of the best models and application to a dataset integrated with the GLI vegetation index confirmed that the RF model outperformed the other models, exhibiting the lowest average RMSE and MAE (3.10 and 2.36) and the highest average R² and r values (0.76 and 0.87). The reduction in R² after inclusion of the GLI can be explained by the greater inherent variability of this index. As it is obtained from UAV imagery at a single time point, it is influenced by factors such as illumination and canopy heterogeneity. This additional variability tends to introduce noise into the continuous and more stable climatic dataset. However, the use of imagery and remote sensing proves to be a valuable strategy for breeders aiming to estimate absolute maturity. Previous studies used this same vegetation index to estimate the maturity date in soybean lines combined with LOESS regression, and they reported high correlations between maturity observed in the field and estimates from remote sensing, ranging from r = 0.84 to 0.97 (Volpato et al. 2021, Santos et al. 2021, Bazrafkan et al. 2023).
The use of UAV imagery has emerged as a fast, cost-effective, and reliable technique to assess traits of interest in crops, and such techniques are critical for high-throughput phenotyping in agriculture. In the literature, numerous studies have reported on prediction of important agronomic traits (e.g., plant height, biomass, and grain yield) using remote sensing techniques. However, studies aimed at predictive modeling of crop maturity are still recent, especially in soybean. Furthermore, research integrating environmental variables with different machine-learning techniques is limited in the literature (Yu et al. 2016, Xie and Yang 2020, Teodoro et al. 2021).
Our findings demonstrate that combining machine learning techniques with climatic data and remote sensing enables prediction of days to full maturity. This represents a rapid, cost-effective, and efficient approach to support decision-making processes in breeding programs. Overall, the RF model outperformed the other models when all climatic variables and the GLI were used as inputs. This led to greater accuracy in predicting days to full maturity, making it a promising and advantageous approach for implementing and analyzing spectral data.
Limitations of this study include a restricted number of evaluated cultivars, the exclusive use of RGB sensors, and the relatively small dataset available for model training. Nevertheless, large, highly-detailed datasets and access to more advanced multispectral and hyperspectral sensors are still frequently limited to research institutions and large corporations. This disparity poses a practical challenge for adoption at the farm level, where the availability of data and technology may be reduced. RGB approaches remain relevant for practical application. Even so, future research should focus on incorporating multispectral or hyperspectral sensors, expanding the dataset, and validating the approach across different soybean-producing regions in Brazil. In addition, exploring deep learning models could further enhance predictive performance and generalization capacity.
CONCLUSIONS
The random forest, support vector machine, and k-nearest neighbors models exhibited the strongest predictive performance, characterized by lower RMSE and MAE values and higher R². Among these models, the RF showed superior predictive accuracy and the highest Pearson correlation coefficient. Overall, the random forest model in integration with the GLI serves as a practical and effective tool for predicting soybean maturity.
ACKNOWLEDGMENTS
The authors thank the National Council for Scientific and Technological Development (Conselho Nacional de Desenvolvimento Científico e Tecnológico - CNPq) and the Minas Gerais State Research and Development Foundation (Fundação de Amparo à Pesquisa do Estado de Minas Gerais - FAPEMIG) for their support. This study also received financial support from the Brazilian Federal Agency for Support and Evaluation of Higher Education (Coordenação de Aperfeiçoamento de Pessoal de Nível Superior - CAPES), through the concession of scholarships, and from the CNPq through a research productivity scholarship.
Data Availability Statement
The datasets generated and/or analyzed during the current research are available from the corresponding author upon reasonable request.
REFERENCES
- Bazrafkan A, Navasca H, Kim JH, Morales M, Johnson JP, Delavarpour N, Fareed N, Bandillo N, Flores P2023 Predicting dry pea maturity using machine learning and advanced sensor fusion with unmanned aerial systems (UASs)Remote Sensing 15:2758
- Carvalho JP, Bruzi AT, Silva KB, Soares IO, Bianchi MC, Vilela NJD2020 Classifying soybean cultivars using an univariate and multivariate approachJournal of Agricultural Science 12:190-199
- Chai T, Draxler RR2014 Root mean square error (RMSE) or mean absolute error (MAE) Arguments against avoiding RMSE in the literatureGeoscientific Model Development 7:1247-1250
- Cohen I, Zandalinas SI, Fritschi FB, Sengupta S, Fichman Y, Azad RK, Mittler R2021 The impact of water deficit and heat stress combination on the molecular response, physiology, and seed production of soybeanPhysiologia Plantarum 172:41-52
- Esri2012 ArcGIS 10.1. Environmental Systems Research Institute, Redlands, 300p.
- Fehr WR, Caviness CE1977 Stages of soybean development. Iowa State University, Ames, 80p.
- Gastl Filho J, Silva JS, Machado JC, Bento DA, Peluzio JM, Silva FL, Mauro AO2022 Genetic parameters and selection strategies for soybean progenies aiming at precocity and grain productivityCiência e Agrotecnologia 46:e004322
- Gauriau O, Galárraga L, Brun F, Termier A, Davadan L, Joudelat F2024 Comparing machine-learning models of different levels of complexity for crop protection: A look into the complexity-accuracy tradeoffSmart Agricultural Technology 7:100380
- Gobron N, Pinty B, Verstraete MM, Govaerts Y2000 Advanced vegetation indices optimized for up-coming sensors: design, performance, and applicationsIEEE Transactions on Geoscience and Remote Sensing 38:2489-2505
- Guo G, Wang H, Bell D, Bi Y, Greer K2003 KNN model-based approach in classification. In Meersman R and Tari Z (eds) On the move to meaningful internet systems 2003: CoopIS, DOA, and ODBASE. Springer, Berlin, p. 986-996
- Hickey GL, Dunn KM, Smallman DP, Brienza M, Novelli D2019 Statistical primer: checking model assumptions with regression diagnosticsInteractive Cardiovascular and Thoracic Surgery 28:1-8
- Hoerl AE, Kennard RW1970 Ridge regression: biased estimation for nonorthogonal problemsTechnometrics 12:55-67
- JARNgra S, Chaudhary V, Yadav RC, Yadav NR2021 High-throughput phenotyping: a platform to accelerate crop improvementPhenomics 1:31-53
- Kahriman F, Güz AM, Pehlivan İ2023 Use of machine learning models-based image analysis for classification of haploid and diploid maizeCrop Breeding and Applied Biotechnology 23:e45322349
- Kumar C, Mubvumba P, Huang Y, Dhillon J, Reddy KN2023 Multi-stage corn yield prediction using high-resolution UAV multispectral data and machine learning modelsAgronomy 13:1277
- Kutner MH, Nachtsheim CJ, Neter J, Li W2005 Applied linear statistical models. McGraw-Hill, New York, 1396p.
- Liakos KG, Busato P, Moshou D, Pearson S, Bochtis D2018 Machine learning in agriculture: A reviewSensors 18:2674
- Lindsey AJ, Craft JC, Barker DJ2020 Modeling canopy senescence to calculate soybean maturity date using NDVICrop Science 60:172-180
- Marquardt DW, Snee RD1975 Ridge regression in practiceThe American Statistician 29:3-20
- Maulud D, Abdulazeez AM2020 A review on linear regression comprehensive in machine learningJournal of Applied Science and Technology Trends 1:140-147
- Miladinović J, Đorđević V2011 Soybean morphology and stages of developmentSoybean 1:45-68
- Moeinizade S, Pham H, Han Y, Dobbels A, Hu G2022 An applied deep learning approach for estimating soybean relative maturity from UAV imagery to aid plant breeding decisionsMachine Learning with Applications 7:100233
- Narayanan B, Floyd B, Tu K, Ries L, Hausmann N2019 Improving soybean breeding using UAS measurements of physiological maturity. In Thomasson JA, McKee M and Moorhead RJ (eds) Autonomous air and ground sensing systems for agricultural optimization and phenotyping ivProceedings of SPIE 11008:110080
- Olivoto T, Lúcio AD, Silva JAG, Marchioro VS, Souza VQ, Jost E2019 Mean performance and stability in multi‐environment trials I: combining features of AMMI and BLUP techniquesAgronomy Journal 111:2949-2960
- Ray S, Bansal S, Gupta A, Gupta D, Shaikh F2017 Understanding support vector machine algorithm from examples (along with code)Analytics Vidhya 13:19
- Rodriguez-Galiano VF, Ghimire B, Rogan J, Chica-Olmo M, Rigol-Sanchez JP2012 An assessment of the effectiveness of a random forest classifier for land-cover classificationISPRS Journal of Photogrammetry and Remote Sensing 67:93-104
- Santos TG, Farias JRB, Silva JT, Zullo Junior J, Souza Júnior CL, Fernandes Júnior DP2021 Assessment of agricultural efficiency and yield gap for soybean in the Brazilian Central Cerrado biomeBragantia 80:e1821
- Schonlau M, Zou RY2020 The random forest algorithm for statistical learningThe Stata Journal 20:3-29
- Sharma A, Wani SH, Bhat JA, Dar ZA, Pandit A, Bhat MA, Sabir I2020 Applications of machine learning in agriculture: a comprehensive reviewIEEE Access 8:4843-4873
- Silva EE, Baio FHR, Teodoro LPR, Silva Junior CA, Borges RS, Teodoro PE2020 UAV-multispectral and vegetation indices in soybean grain yield prediction based on in situ observationRemote Sensing Applications: Society and Environment 18:100318
- Soares IO, Bianchi MC, Bruzi AT, Gesteira GDS, Silva KB, Guilherme SR, Cianzio SR2020 Genetic and phenotypic parameters associated with soybean progenies in a recurrent selection programCrop Breeding and Applied Biotechnology 20:e28092046
- Song P, Liu S, Zhang Y, Xu Y, Guo H, Wang Y, Li X2021 High-throughput phenotyping: Breaking through the bottleneck in future crop breedingThe Crop Journal 9:633-645
- Stackhouse PW, Macpherson B, Broddle M, McNeil C, Barnett AJ, Mikovitz C, Zhang T2021 Introduction to the prediction of worldwide energy resources (POWER) Project (NASA Technical Report; Document ID 20210023937). National Aeronautics and Space Administration, Langley Research Center, Hampton. Available at https://ntrs.nasa.gov/citations/20210023937. Accessed on JARNuary 15, 2024.
- Staniak M, Szpunar-Krok E, Kocira A2023 Responses of soybean to selected abiotic stresses -Photoperiod, temperature and waterAgriculture 13:146
- Teodoro PE, Teodoro LPR, Baio FHR, Silva Junior CA, Silva EE, Borges RS2021 Predicting days to maturity, plant height, and grain yield in soybean: A machine and deep learning approach using multispectral dataRemote Sensing 13:4632
- Tibshirani R1996 Regression shrinkage and selection via the lassoJournal of the Royal Statistical Society Series B: Statistical Methodology 58:267-288
-
USDA - United States Department of Agriculture2025 Soybean production in Brazil. Available at <Available at https://ipad.fas.usda.gov/countrysummary/Default.aspx?id=BR&crop=Soybean >. Accessed on May 29, 2025.
» https://ipad.fas.usda.gov/countrysummary/Default.aspx?id=BR&crop=Soybean - Van Eeuwijk FA, Bustos-Korts D, Millet EJ, Boer MP, Kruijer W, Thompson A, Malosetti M, Iwata H, Quiroz R, Kuppe C, Muller O, Blazakis KN, Yu K, Tardieu F, Chapman SC2019 Modelling strategies for assessing and increasing the effectiveness of new phenotyping techniques in plant breedingPlant Science 282:23-39
- Volpato L, Baldoni Ab, Albrecht Ajp, Hoffmann L, Ziech Mf, Martins D, Negrão Lo2021 Optimization of temporal UAS‐based imagery analysis to estimate plant maturity date for soybean breedingThe Plant Phenome Journal 4:e20018
- Xie C, Yang C2020 A review on plant high-throughput phenotyping traits using UAV-based sensorsComputers and Electronics in Agriculture 178:105731
- Yu J, Li Y, Zhang C, Zhang J, Zhang Y, Zhang D, Zhang Y, Xu Z, Zhang W, He X2016 Development of methods to improve soybean yield estimation and predict plant maturity with UAV-based imageryRemote Sensing of Environment 187:89-100
- Zdziarski AD, Sattler MC, Pereira MG, Amaral Júnior AT, Alexandre LAF2018 Key soybean maturity groups to increase grain yield in BrazilCrop Science 58:1155-1165
- Zhou J, Zhang Y, Chen Y, Zhang Y, Xu Z, Zhang W, He X2019 Estimation of the maturity date of soybean breeding lines using UAV-based multispectral imageryRemote Sensing 11:2075
- Zhu H, Lin C, Liu G, Wang D, Qin S, Li A, Xu J-l, He Y2024 Intelligent agriculture: deep learning in UAV-based remote sensing imagery for crop diseases and pests detectionFrontiers in Plant Science 15:1435016
- Zou H, Hastie T2005 Regularization and variable selection via the elastic netJournal of the Royal Statistical Society Series B: Statistical Methodology 67:301-320