
Abstract
The abundantly available mica flakes were added in raw materials to manufacture pottery in Central Peninsular India during the early Iron Age (700-300 BCE) for storage and glittering. The micaceous potsherds from the excavated megalithic site of Nagpur were studied for their composition, manufacturing techniques, microstructural features, microbial colonization, and estimation of firing temperature. The analytical techniques used were micro-XRF, FTIR, XRD, FEG-SEM, mercury porosimetry (MIP), and thermal analysis. The XRF and SEM-EDX data revealed that the potteries were coated with aqueous iron oxide on either surface for red hue and subsequently fired at an estimated temperature of 700-750 °C in a reducing atmosphere as determined by vibrational and mineralogical analysis. The X-ray microscopy and FEG-SEM images showed a grey color sandwich layer representing the original clay composition between iron oxide-coated red surface layers. MIP showed that the fine ware had a high porosity of 21-26% with a void ratio (e) of 0.28-0.36. The loosely adhered mica flakes influenced the strength and stability of the pottery. The 16S rRNA gene sequencing identified the presence of Bacillus velezensis within the round and elongated pits within the potsherds drawing nutrients from minerals.
Keywords:
micaceous potsherds; firing temperature; microbial colonization; megalithic site; stratigraphy; porosity
INTRODUCTION
Micaceous clay has traditionally been used for the manufacture of pottery specifically for cooking purposes 11 D. Anderson, All that glitters: the emergence of Native American micaceous art pottery in northern New Mexico, School Am. Res. Press, USA (1999).. While cooking, micaceous clays are evenly heated and stay warm for a longer duration making the food preparation easier. The mica present in the clay makes the pot rough, strong, and durable. Since the potters prefer bright red micaceous clay, they were often fired in a controlled oxidizing atmosphere. Black smudges sometimes noticed on the surface of micaceous pots are on account of firing in insufficient oxygen. However, in Peninsular Central India, the micaceous pots were not manufactured by sourcing mica-rich clays in the historical period but by utilizing locally available clays and adding mica flakes into the raw materials. It is significant to note that the Nagpur region of Peninsular India is a good source of mica and its abundance in the region is surely responsible for its large-scale usages in the pottery by the megalithic community for rituals and glittering purposes. The region called Vidarbha showed a cult of death with a strong belief that there is life after death. In the micaceous ceramics, the clay is found mixed with mica flakes imparting a shining finish to the pot-surfaces 22 S.B. Deo, A.P. Jamkhedkar (Eds.), “Excavations at Naikund 1978-80”, Govt. Maharashtra, India (1982).), (33 H.S. Sharma (Ed.), “Perspectives in geomorphology”, 1, Concept Publ., New Delhi (1982).. The megalithic micaceous potsherds have black patches due to the atmosphere of firing. Occasionally, the potsherds of this ware are either ill-fired or sometimes the flakes of mica are so big that its loss led to pot breakage 44 S.B. Deo, in “Radiocarbon and Indian archaeology”, D.P. Agrawal, A. Ghosh (Eds.), Tata Inst. Fund. Res., Mumbai (1973) 131.. The common use of this ware includes large size storage vessels, pots with globular body, basins, and dishes on the stand. The mica slip redware which has a medium of thick mica coating has also been reported from many other excavation sites in Vidarbha 55 S.B. Deo , “Mahurjhari excavation, 1970-1972”, Nagpur Un., India (1973).. Based on physical appearance, it has been reported that micaceous potsherds are mostly well fired and importantly their core does not contain any traces of mica flakes 66 G.B. Deglurkar, Megalithic Raipur, 1985-1990, Deccan Coll. Post-grad. Res. Inst., India (1992)), (77 G. Shete, Man Environ. 34 (2009) 66..
Potteries and bricks play a key role in exploring the past through investigations of the clay material for archaeologists, scientists, and historians 88 I. Miloglav, in “Tracing pottery making recipes in the Balkans, 6th-4th millennium BC”, Serbian Acad. Sci. Arts, Belgrade (2014) 19.), (99 N. Rao, in “Hinduism and tribal religions, encyclopedia of Indian religions”, P. Jain, R. Sherma, M. Khanna (Eds.) Springer, Dordrecht (2019).. Potsherds are the most abundant tracer in all archaeological excavations that provide a sequence of human history in the archaeological period. The uses of pottery from functional to decorative purposes by ancient civilization make it answerable to cultural heritage, technological advancement, and methodologies practiced by an artisan in those periods 1010 G. Eramo, R. Laviano, I.M. Muntoni, G. Volpe, J. Cult. Herit. 5 (2004) 157.. A comprehensive scientific study of potsherds specifically determines its relative chronological sequence, details of civilization, technological development, and trade link. The constituents present in the potsherds are mainly dependent on the initial composition of the sourced clay, additives used, the firing temperature, firing atmosphere, and duration of heat treatment. The estimation of firing temperature has always been of great interest in clay science for researchers. A direct relationship between the firing temperature and changes in mineralogical and microstructure characteristics of pottery exists and the properties most affected are porosity, clay matrix, gradual sintering, and vitrification 1111 K.L. Rasmussen, A. Guillermo, A. De La Fuente, A.D. Bond, K.K. Mathiesen, S.D. Vera, J. Archaeol. Sci. 39 (2012) 1705.. On firing, the clay minerals of the pottery undergo characteristic reactions like dehydration, decomposition, and transformations 1212 A. Moropoulou, A. Bakolas, K. Bisbikou, Thermochim. Acta 269 (1995) 779.. The wide range of clay composition makes an accurate determination of firing temperature very complicated 1111 K.L. Rasmussen, A. Guillermo, A. De La Fuente, A.D. Bond, K.K. Mathiesen, S.D. Vera, J. Archaeol. Sci. 39 (2012) 1705.. Moreover, the past potteries were fired either in kilns or in open pits 1313 N.I. Zagorodny, V. Cristina, M. Morosi, B. Balesta, in “Vessels explored: applying archaeometry to South American ceramics and their production”, E.M. Stovel, G.A. De La Fuente (Eds.), BAR Publ., Oxford (2016) 67.. In both the techniques of firing, the temperature reached is identical but the kiln can maintain heat more efficiently and subsequent cooling creates a characteristic difference in the microstructure of potsherds. Previous research has indicated the formation of different minerals depending on the composition of raw materials and kiln operating conditions 1414 M. Maggetti, in “Scientific studies in ancient ceramic”, M.J. Hughes (Ed.), Brit. Museum Occas. Paper 19 (1981) 33.. Investigations indicate the formation of hematite if pottery is fired in oxidizing conditions 1515 R.B. Heimann, M. Maggetti, in “Scientific studies in ancient ceramic”, M.J. Hughes (Ed.), Brit. Museum Occas. Paper 19 (1981) 163.. In potteries, the quartz or sand used as a raw material does not react over a wide range of temperatures. The secondary minerals are also produced during the firing of the ware or the use, or in the prolonged burial of the potsherds due to the transformation of metastable firing minerals or infiltration of any solution causing isomorphic substitution 1414 M. Maggetti, in “Scientific studies in ancient ceramic”, M.J. Hughes (Ed.), Brit. Museum Occas. Paper 19 (1981) 33.)- (1616 A. Ciancio, A. Dell’Anna, R. Laviano, in “Roman ceramics and archaeometry: the state of studies”, All’Insegna del Giglio, Florence (1994) 261..
A systematic multi-analytical analysis is, therefore, essential to gain knowledge about these very complex archaeological artifacts. The chemical, mineralogical, morphological, porosimetry, and thermal analysis of potsherds can unlock evidences relating to the raw materials used for production, firing temperature, and technological development related to its manufacture 1717 M. Klein, F. Jesse, H.U. Kasper, A. Gölden, Archaeometry 46 (2004) 339.)- (1919 J. Kores, R. Ravisankar, G.R. Annamalai, G. Senthilkumar, BAOJ Phys. 3, 4 (2017) 1.. Researchers have used many analytical techniques for estimating the firing temperature of the potsherds. Firing temperature has been estimated through thermal expansion and dilation of ceramics 2020 M.S. Tite, Archaeometry 11 (1969) 131., measurement of the coercive field and saturation magnetization 2121 J. Van Klinken, Archaeometry 43 (2001) 49.), (2222 M.A.R. Torres, V. Costanzo-Álvarez, M. Aldana, N. Suárez, C. Campos, M.M. Mackowiak-Antczak, M.C. Brandtet, Stud. Geophys. Geod. 55 (2011) 717., interlayer spacing in illite mineral by X-ray diffraction 2323 J. Srodon, Clays Clay Miner. 32 (1984) 337., Mossbauer spectroscopy, and thermal analysis 2424 R. Ravisankar , A. Naseerutheen, A. Rajalakshmi, G.R. Annamalai , A. Chandrasekaran, Spectrochim. Acta A Mol. Biomol. Spectrosc. 129 (2014) 201.. Besides, the parameters like heating rate, duration of firing, atmospheric condition, cooling rate, and refiring events have often been used in ceramic investigations 2525 C. Heberling, R.P. Lowell, L. Liu, M.R. Fisk, Geochem. Geophy. Geosy. 11 (2010) 1.. Different analytical techniques like water absorption, nitrogen adsorption, and mercury intrusion porosimetry (MIP) are used to determine the porosity of the potsherds. Unlike the MIP method, the water absorption method mainly determines the pore volume and not the pore size distribution of potsherds. A further advantage of MIP is that, in the presence of clay minerals, the mercury does not expand as might occur with water, which then provides an erroneous result. In case nitrogen is used to determine porosity, it only determines micro to mesopores but not macropores. Therefore MIP and thin section techniques have preferentially been used to determine the porosity and pore size distribution, and the specific gravity (G) has been determined by a pycnometer. The presence of microbes is not limited to the surface soil but they are also found in deep underground up to >5 km 2525 C. Heberling, R.P. Lowell, L. Liu, M.R. Fisk, Geochem. Geophy. Geosy. 11 (2010) 1.. Investigations on mineral-microbe interaction are still at experimental stages as very few microbial species and minerals have so far been focused. The micaceous potsherds were excavated from megalithic burial and found placed close to a now fossilized human skeleton in a very damp black cotton soil. The condition within the burial was most suited for microbial activity. Therefore, the bacterial microbes were isolated and 16S rRNA was carried to identify the microbes housed in the potsherds during the burial. To monitor material transitions as a function of temperature, the potsherds were also analyzed for thermal stability from ambient to 800 °C with the aid of a thermogravimetric (TGA) analyzer.
Based on respective material culture specifically ceramic assemblage of many megalithic excavation sites as well C14 date, the archaeologists believed that the early Iron Age of South India began from 700 to 300 BCE 2626 P.G. Johansen, J. Field Archaeol. 39 (2014) 256.. Although archaeologists have largely studied the physical features, a detailed scientific analysis of potsherds from Central India belonging to early iron age culture is still lacking. Fourier transform infrared spectroscopy (FTIR) has been used to identify the mineral composition. Generally, near-infrared spectroscopy and mid-FTIR range are mostly employed for the determination of minerals 2727 J.D. Jordá, M.M. Jordán, R. Ibanco-Cañete, M.A. Montero, J.A. Reyes-Labarta, A. Sánchez, M. Cerdán, Appl. Clay Sci. 115 (2015) 1.. IR spectroscopy always allowed the identification of both crystalline and amorphous phases of minerals. It also helps in identifying any thermal transformation that has happened in the potteries during the firing process, thereby also helping in estimating the firing temperature of the pottery pieces 2828 S. Shoval, P. Beck, J. Therm. Anal. Calorim. 82 (2005) 609.. X-ray diffraction (XRD) is helpful in the identification of crystalline phases of minerals and their phase purity 2929 Merkevičius, P. Bezdicka, R. Juskenas, J. Kiuberis, J. Senvaitiesne, I. Pakutinaskiene, A. Kareiva, Chemija 18 (2007) 36.. The identification of quartz is convenient with only XRD and not with FTIR examination 2727 J.D. Jordá, M.M. Jordán, R. Ibanco-Cañete, M.A. Montero, J.A. Reyes-Labarta, A. Sánchez, M. Cerdán, Appl. Clay Sci. 115 (2015) 1.), (2929 Merkevičius, P. Bezdicka, R. Juskenas, J. Kiuberis, J. Senvaitiesne, I. Pakutinaskiene, A. Kareiva, Chemija 18 (2007) 36.. Scanning electron microscopy coupled with energy-dispersive X-ray spectroscopy (SEM-EDX) is the most effective technique in the investigation of potsherds. The main aim of the present research is to study the composition, microstructure, and stratigraphy of potsherds of the megalithic excavation site of Nagpur, India, and to estimate their firing temperature range. The spectroscopic techniques of FTIR and XRD in addition to microscopic techniques of SEM-EDX and X-ray microscopy were used in the present investigation.
About megalithic excavation site, Nagpur: the Forest Development Corporation of Maharashtra (FDCM) under the technical collaboration of Deccan College Post-Graduate and Research Institute, Pune undertook excavation and in situ conservation and protection of megalithic burial site in Peninsular Central India. The site is situated in the Gorewada Reserve Forest on the outskirt of India’s Nagpur city. The location of the excavated site is shown in Fig. 1. The excavation unearthed many artifacts, iron implements, human skeleton, and potsherds attached to burials (Fig. 1). The main ceramics unearthed in Deccan megalithic burials are black and redware, micaceous redware, coarse redware, and black burnished redware. The black and redware are quite common in the majority of historical excavations in India from the protohistoric period in urban Harappan civilization and well-studied 3030 K.V. Soundara Rajan, in “Seminar papers on the problem of megaliths in India”, Banaras Hindu Un., Varanasi (1969) 69.. The study of black and red wares revealed its association throughout the cultural period mainly due to its production technique. It has been reported that the color combination of these wares is mainly due to a process called inverted firing 3131 G.G. Mujumdar, in “Seminar papers on the problem of megaliths in India”, Banaras Hindu Un., Varanasi (1969) 90.. The firing of pots upside down in close contact with the fuel created a reducing atmosphere in the inner part resulting in black color and outer surface turned red due to oxidizing conditions. However, there are many exceptions as the color also depends on the firing temperature. Besides black and redware, the micaceous redware forms a dominant pottery type in the megalithic sites of Vidharbha and is the subject of interest for this research. The micaceous potsherds have gained a special regional significance due to their huge occurrence in all the excavated burials and habitation sites of the Vidharbha region.

MATERIAL AND METHODS
A preliminary investigation of potsherds under a digital microscope was carried out at the site and shreds appeared to be of similar quality. Therefore four samples of micaceous potsherds (S1 to S4) were collected from the megalithic excavation site. The samples were buried at a depth of about 2-3 m under damp black cotton soil (Fig. 2). The superficial depositions of dust and soiling materials from the surface of the samples were removed with the help of ethanol. Subsequently, the samples were heated at around 100-120 °C for 2 h to eliminate the moisture trapped within the potsherds. The samples were photographed before scientific analysis. The potsherds were ground into a fine powder and used for XRD and FTIR analysis. For SEM-EDX and micro-XRF, bulk samples were used.

General view of the micaceous potsherds samples (S1-S4) from the excavated site in Nagpur.
FTIR analysis: FTIR spectroscopy is an effective method for potsherds to investigate the structure, bonding, mineral composition, and chemical properties of the clay minerals 3232 T. Broekmans, A. Adriaens, E. Pantos, Nucl. Instrum. Methods Phys. Res. B 226 (2004) 92.. The FTIR is used to identify the minerals which involve the vibration of molecules. The FTIR spectra of all micaceous potsherds representing black, red, and mica embedded portions were recorded using an infrared spectrometer (Alpha T, Bruker). The pressed KBr pellet technique was used to record the spectrum. The powdered sample was mixed with KBr in the ratio of 1:20 using a mortar and pestle and pressed at 5 ton for 1 min for preparing the disc. The spectra were obtained at 4 cm-1 resolution and the number of the scan was 32 within the wavenumber region of 400-4000 cm-1. The precision of the instrument was ±5 cm-1. X-ray diffraction analysis: for XRD analysis, 0.2 g of the sample was ground manually using an agate mortar. The powdered X-ray diffraction of the sample was carried using an X-ray diffractometer (Xpert, Philips Panalytical) using a CuKα radiation source in a 2θ range of 5-90° at a scan rate of 2 °/min. Micro-XRF analysis: the chemical composition of potsherds samples was obtained through micro-XRF (Artax 200, Bruker). The instrument was operated at a voltage of 50 kV and 700 mA current, and the data collection (live) time was 300 s. At least 4 measurements were performed on either side of each sample and the data averaged. There is no standard method used for analyzing ED-XRF. The automated software was used, and the instrument was calibrated using one or two standard samples to confirm the peak position of the elements. Scanning electron microscopy - EDX analysis: all potsherd samples were examined under a field emission gun scanning electron microscope (FEG-SEM, JSM 7600F, Jeol). The FEG-SEM had an electron column with semi-in-lens detectors and an in-lens Schottky field emission gun. The instrument was operated at an accelerating voltage of 0.1 to 30 kV and the probe current ranged from 1 pA to ≥200 mA. The resolution of the instrument was 1 nm at 1 kV in GB mode for the secondary electron detector and an Oxford detector was used for energy-dispersive X-ray spectroscopy (EDX). The SEM micrographs were taken at both low (10k) and high magnification (75k) for the analysis of potsherds.
Thermogravimetric analysis (TGA): the potsherd samples were analyzed for their thermal stability from room temperature to 800 °C at a heating rate of 10 °C/min using a TGA analyzer (SDT 2960 DSC/TGA, Perkin). The TGA technique monitored the material transitions occurring within the samples, in terms of the weight loss/gain as a function of temperature/time. This was carried out in a controlled temperature program as well as in a controlled atmosphere. The sample environment was controlled through a constant purge of nitrogen gas at a rate of 20 mL/min. Specific gravity, porosity, and pore size distribution: the pore size distribution of the potsherds was studied from the cumulative volume of the mercury (Vm) intruded at any pressure. The external pressure required to get the geometry of the pores is directly related to the contact angle of the mercury with the specimen and surface tension of the mercury, and inversely related to the diameter of the pores 3333 E.W. Washburn, Phys. Rev. 17 (1921) 273. as expressed by:
where is the applied pressure, r is the radius of the pores that are filled with mercury. The various parameters related to the pore size distribution were obtained from the guidelines of ASTM D4404-84 standard and the final void ratio (e) and porosity (n) were calculated for the studied potsherds. To estimate the pore size distribution (PSD), which gives insight into the process of fabrication of potsherds in the historical period, mercury intrusion porosimetry (MIP) technique (Pore Master 60, Quantachrome Instr.) was used. All the samples were first dried and a few milligrams were taken in the penetrometer cell of known cell constant. The penetrometer with the sample inside (sealed on another end with vacuum grease) was inserted in the low-pressure port in PM 60. After filling the mercury in the penetrometer, a vacuum pressure of nearly 10 mTorr was applied. After completion of the low-pressure analysis, the sample was loaded to a high-pressure port wherein the mercury was pressurized up to 60000 psi. The specific gravity (G) of the samples was precisely determined with the help of a pycnometer (Ultrapyc 1200e, Quantachrome Instr.) using helium gas for determining the density of the sample. For obtaining the G value of the sample, a known weight of the oven-dried sample was taken and the test method described in the ASTM D5550 standard was followed. 16S rRNA of microbes in potsherds: the identification of bacterial culture using a 16S rDNA based molecular technique was carried out. The DNA was isolated from the culture on 1.2% agarose and a single band of high molecular weight DNA was observed. The isolated DNA was amplified with 16S rRNA-specific primer (8F and 1492R) using a thermal cycler (Veriti 9902, Applied Biosystems). The PCR amplicon was enzymatically purified and further subjected to Sanger sequencing 3434 S. Kumar, G. Stecher, M. Li, C. Knyaz, K. Tamura, Mol. Biol. Evol. 35 (2018) 1547.. Bi-directional DNA sequencing reaction of PCR amplicon was carried out with M13F and M13R primers using a cycle sequencing kit (BigDye Terminator v3.1, Applied Biosystems) in a genetic analyzer (ABI3730xl, Applied Biosystems). A consensus sequence of 1422 bp 16S rDNA was generated from forward and reverse sequence data using aligner software. The 16S rDNA sequence was used to carry out BLAST alignment.
RESULTS AND DISCUSSION
FTIR analysis: the micaceous potsherds having black, red, and mix color spots were analyzed and FTIR spectra obtained are shown in Fig. 3. The absence of the inner hydroxyl band at 3700 cm-1 (broadband) and the Si-O-Al band at 915 cm-1 (Fig. 3) indicated that all the samples were fired above 450 °C. As the firing temperature increases, the frequency shift takes place from a higher frequency of 3700 cm-1 towards a lower frequency, resulting in the changes of atom’s structure and its location due to disturbance in the electric field around the OH group 3535 J.G. Miller, J. Phys. Chem. 65 (1961) 800.)- (3737 R. Prost, A. Dameme, E. Huard, J. Driard, J.P. Leydecker, Clays Clay Miner. 37 (1989) 464.. The absorption bands at around 3445 and 1645 cm-1 in all samples indicated the presence of adsorbed water due to the long burial of the potsherds 3838 Y. Maniatis, M. Tite, Trans. J. Br. Ceram. Soc. 74 (1975) 229.)- (4040 M.S. Jayswal, D.K. Kanchan, P. Sharma, N. Gondaliya, J. Mater. Sci. 21 (1986) 2418.. From the spectra of the samples (Table I), a very weak to weak absorption band present at 2984 and 2899 cm-1 may be assigned to the asymmetric C-H group indicating the presence of organic carbon in the sample 4141 G.R. Annamalai , R. Ravisankar , A. Naseerutheen , A. Chandrasekaran , K. Rajan, Optik 125 (2014) 6375.. In the region 1100-400 cm-1, the vibration bands corresponding to Si-O, Si-O-Si, and Al-Si-O were detected in all the samples which may be assigned to feldspar and quartz. Quartz is the major mineral in potsherds as observed from Table I. The broad symmetrical band centered around 1030 cm-1 in all the samples indicated that the destruction of the octahedral sheet structure of clay took place around 650 °C. The infrared absorption bands at 1030, 795, 775, and 695 cm-1 suggested the presence of quartz. Out of four peaks of quartz, the band at 775 cm-1 was assigned to symmetrical stretching mode and the band at 695 cm-1 to symmetrical bending mode. These are widely used as diagnostic peaks for quartz. The band centered at 695 cm-1 is more useful to find whether the sample is amorphous or crystalline. In the amorphous state, the peak at 695 cm-1 will be missing 4242 A. Chandrasekaran , A. Rajalakshmi , R. Ravisankar , S. Kalarasai, Egypt J. Basic Appl. Sci. 2 (2015) 55.. As the band around 693-695 cm-1 exists in all the spectra, it can be said that the quartz is in the crystalline state in all the potsherds. Further, the presence of a sharp band at around 693 cm-1 also indicated a thin particle 3636 F. Elsass, D. Olivier, Clay Miner. 13 (1978) 299.. In the present study, all the potsherds indicated the use of quartz of fine particle size, and the data correlated with MIP analysis.
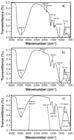
FTIR spectra of the micaceous potsherds of the red portion (a), the black portion (b), and joint color (c).
Vibrational assignments of FTIR absorption frequencies (cm-1) of micaceous potsherds Nagpur.
Calcite is often present as impurities in local clays sourced for making potsherds. A very weak calcite band around 1883 cm-1 was present in all the samples 4343 D. Seetha, G. Velraj, Spectrochim. Acta A Mol. Biomol. Spectrosc. 149 (2015) 59.. The observation of weak calcite bands gave a good indication of the firing temperature. The presence of calcite in the potsherds indicated a firing temperature lower than 850 °C. Any firing temperature above 850 °C leads to the formation of high-temperature calcium silicate and calcium-aluminosilicate 4444 V.V. Morariu, M. Bogdan, I. Ardelean, Archaeometry 19 (1977) 187.. Sanidine is formed if the original clay composition contains a low amount of calcium oxide 1515 R.B. Heimann, M. Maggetti, in “Scientific studies in ancient ceramic”, M.J. Hughes (Ed.), Brit. Museum Occas. Paper 19 (1981) 163.. The decomposition temperature of calcite is 720-900 °C. This indicated that the temperature did not reach this range for the potsherds. The maximum of the Si-O band changes systematically with the firing temperature of the clay. The main Si-O stretching bands were located at around 1010-1032 cm-1 in all samples. According to Shoval 4545 S. Shoval, in “The Oxford handbook of archaeological ceramic analysis”, A. Hunt (Ed.), Oxford Un. Press (2017)., a single peak with a maximum at 1042 cm-1 is found at a firing temperature of 700 °C. At 800 °C, the band split and two maxima at 1050 and 1078 cm-1 appear 4646 R. Palanivel, U.R. Kumar, Rom. J. Phys. 56 (2011) 195.. Again at 900 °C, a single band is observed at 1082 cm-1. The bands around 1010-1032 cm-1 for all the potsherds suggested that the firing temperature was around 700-750 °C. The FTIR spectra showed an absorption band around 472 cm-1 due to the Si-O-Si bending of silicates. The band around 527-540 cm-1 was due to Fe-O bending of magnetite. The higher amount of magnetite represents a reducing atmosphere and a higher amount of hematite, an oxidizing atmosphere 4343 D. Seetha, G. Velraj, Spectrochim. Acta A Mol. Biomol. Spectrosc. 149 (2015) 59.. The concentration ratio of iron oxides Fe3O4/Fe2O3 determines the prevailed firing temperature during the production of pottery and is determined by the I/IO method 4646 R. Palanivel, U.R. Kumar, Rom. J. Phys. 56 (2011) 195.. If the intensity ratio is less than 1, the sample contains a high amount of hematite otherwise it contains a high amount of magnetite. This indicated that the micaceous potsherds were probably fired in closed kilns (reducing atmosphere) since the sample showed the presence of magnetite. The presence of magnetite also indicated that the samples were fired at around 700-750 °C 4646 R. Palanivel, U.R. Kumar, Rom. J. Phys. 56 (2011) 195.. From the FTIR spectra of the potsherds, it can be elucidated that artisans of a megalithic period of the Nagpur region were well aware of firing techniques of potsherds in reducing atmosphere.
X-ray diffraction: the diffractogram obtained was analyzed using Expert Highscore software for mineralogical composition and the results are reported in Fig. 4. From the results, quartz was the major component in all the analyzed samples and its content in the potsherds may be due to its use as temper in the raw soil or on account of the formation of various silicates during firing. The other important mineral identified was muscovite contributed from the mica flakes utilized by the potters to give a glittering surface. The presence of quartz in all the samples indicated a firing temperature of at least 700-750 °C. It is well known that quartz persists on firing up to 1000 °C 4747 K. Kihara, Eur. J. Mineral. 2 (1990) 63.. Quartz may be an indigenous mineral in natural clay or maybe an intentionally added temper 4848 R. Ravisankar , S. Kiruba, A. Chandrasekaran , G. Senthilkumar , C. Maheswaran, Indian J. Sci. Technol. 3 (2010) 858.. This gives a clear indication that all the samples were fired at around 700 °C. Mica minerals have excellent thermal stability and are stable at a high temperature of 900 °C. The presence of muscovite and quartz in the XRD patterns of the potsherds indicated a low firing temperature of 700-750 °C. The mineralogical analysis of the samples revealed that the raw material sourced was mostly non-calcareous, also supported by the ED-XRF and EDX analysis of the potsherds. However, the pottery contained traces of calcite, as recorded through FTIR analysis of the samples. As calcite decomposes to CaO and CO2 at around 720-840 °C and there was the absence of any secondary calcium silicate, the non-calcareous raw material was probably fired at around 720-750 °C. No high-temperature minerals like microcline and mullite were observed in any of the samples. Calcite was not identified in the XRD patterns probably owing to its very low concentration. The identification of minerals by FTIR was supported by the XRD results of the potsherds.

ED-XRF analysis: the results were reported in the form of oxides present in each sample (Table II). Micro-XRF was also used to observe the stratigraphy of the layers in the potsherds (Fig. 5). The potsherds were buried to a depth of about 2-3 m under damp black cotton soil very rich in iron content. It was cleaned with alcohol and dried at 120 °C before analysis. Subsequently, the potsherds were analyzed for chemical composition by the ED-XRF point method (Table II). The potsherd samples S1and S2 were also observed under an X-ray microscope for the stratigraphy of different layers (Figs. 5a and 5b). From the stratigraphy of the layers, it was observed that the samples had deep reddish-brown color on either surface (layers 1 and 3) and there was a dark grey sandwiched layer (layer 2) present in the potsherds. The sandwich layer (samples S1 and S2) was also analyzed for chemical composition along with the reddish-brown obverse and reverse surfaces by ED-XRF and data are shown in Table II, with all the major, minor, and trace elements/oxides detected in the potsherds. The chemical composition, as well as the relationship among the elements, was used to gain knowledge about the mineralogical assemblage of the raw materials. In all the potsherds, CaO was present at trace level (0.83-1.42%), which can be regarded as an impurity from the raw material. Titanium oxide was present in a minor amount in all samples (3.06-3.94%). CuO and ZnO were also present in all the samples as traces. Potsherd samples showed a very high percentage of iron oxide in all the samples, which can be explained by its content in the original clay material as well as the application of iron oxide on either surface of the potsherds for red coloration before firing. The chemical compositions showed the presence of aluminum oxide in the range of 20-25% in the potsherds (Table II). Aluminum is an important constituent of all clay compositions. The sandwich layers showed iron oxide contents around 24%, which is about 10% lower than the contents of iron oxide on either surface. This may be due to the application of red oxide on the surface layer for the desired hue. The silica content of the potsherd varied from 28% to 34%.

Stratigraphy of potsherd samples from Nagpur. Layers 1 and 3: red-colored surface layer; layer 2: grey sandwich layer.
SEM-EDX analysis of potsherds: the EDX microanalysis was used to obtain the elemental composition of the samples (Table III). The SEM-EDX was also used for the elemental mapping of the constituent elements present in the potsherds (Figs. 6 and 7). The micaceous potsherd samples S1 and S2 were observed under an X-ray microscope for the stratigraphy of different layers (Figs. 5a and 5b). From the microscopic images, it was observed that samples had reddish-brown color on either surface and there was a dark grey sandwich layer present in the center. For sample S1, areas of 10 µm2 of the sandwich layer (layer 2), as well as the red-brown outer layer (layer 1) were observed in a scanning electron microscope and elemental mapping for the elements Mg, O, Al, Ca, Si, Fe, Na, and K were obtained. Fig. 6 shows the results of elemental mapping for some of these elements for the outer and sandwich layers. From the elemental mapping, it was observed that there was a higher content of Fe, Mg, and K in the outer layer (layer 1) than in the sandwich layer (layer 2). The sandwich layer and red-brown outer layer were also analyzed in duplicate for their elemental composition and the EDX data is listed in Table III. Similarly, an 8 µm2 area of the outer layer (layer 1) and 1 µm2 area of the sandwich layer (layer 2) of potsherd sample S2 were observed by SEM. The elemental mapping of the outer and sandwich layers was taken and the images are shown in Fig. 7. It was observed that similar to sample S1 the outer layer of the potsherds (layer 1) showed high contents of Fe, Mg, and K in comparison to the sandwich layer (layer 2). To understand the composition of both layers (layers 1 and 2), they were analyzed under SEM-EDX, and data are shown in Table III. From the EDX data (Table III), it was observed that the outer red-brown layer (layer 1) in both samples contained a high content of iron in comparison to the sandwich layer (layer 2). The sandwich layer in both samples S1 and S2 probably represented the original clay composition of the pottery after firing to an estimated temperature of 700-750 °C based on FTIR and XRD analyzes of potsherds. It appeared that before firing both surfaces of the pottery received a red earth coating for the desired color that seeped into the body due to its high porosity (~26%). However, the iron oxide could not seep up to the core of the pottery at many points and there remained a grey color layer (layer 2) representing the original composition of sourced raw soil. The pots made from locally available black cotton clayey soils are generally grey to grey-black after firing. The pots were applied with red earth coating before firing by the peninsular megaliths of central India.
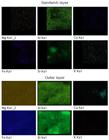
Elemental mapping images (SEM-EDX) of sandwich and outer layers of potsherds sample S1 showing higher contents of Fe, Mg, and K in the outer layer than in the sandwich layer (scan area=10 μm2).
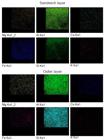
Elemental mapping images (SEM-EDX) of sandwich (scan area=1 μm2) and outer (scan area=8 μm2) layers of potsherds sample S2 showing higher contents of Fe, Mg, and K in the outer layer than in the sandwich layer.
SEM micrographs of samples S1 and S2 taken at low and high magnifications are shown in Figs. 8 and 9, respectively. The inclusions of mica flakes in the potsherds were clearly visible, loosely adhering to the matrix in both samples. Round and elongated pits produced by the microbes were observed at higher magnification in the SEM images. The mica surface showed large colonization of bacteria with mineral debris derived from mica weathering. At higher magnification, rod-shaped gram-positive endospore-forming bacteria widely distributed in the potsherds was observed. In the microbial weathering of mica, potassium is the first cation released with the transformation of mica into vermiculite and smectite 4949 W.W. Barker, S.A. Welch, J.F. Banfield, in “Geomicrobiology: interaction between microbes and minerals”, J.F. Banfield , K.M. Nealson (Eds.), Miner. Soc. Am., Washington D.C., 35 (1997) 391.), (5050 S. Bonneville, D.J. Morgan, A. Schmalenberger, A. Bray, A. Brown, S.A. Banwart, L.G. Benning, Geochim. Cosmochim. Acta 75 (2011) 6988..

SEM micrographs of the micaceous potsherd sample S1 from Nagpur at various magnifications.

SEM micrographs of the micaceous potsherd sample S2 from Nagpur at various magnifications.
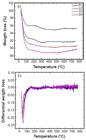
Thermogravimetric analysis: the pyro-technological abilities of ancient artisans are judged from the estimation of the firing temperature of potsherds, which also helps to understand the manufacturing technology and functional relationship between the component materials. Clay minerals, the main source of ceramics and potsherds, undergo characteristic reactions of dehydration, dehydroxylation, and decomposition in the course of firing. The heating rate and the length of exposure time applied to heat the potsherds are the most suitable parameters in firing technology. In the thermal analysis of potsherds, during the secondary heating, the exothermic reactions occur at a temperature that is higher than the temperature of the first heating. This consideration is exclusively exploited in the thermal characterization of potsherds through DTA-TGA techniques 5151 R. Ravisankar , G.R. Annamalai , A. Naseerutheen , A. Chandrasekaran , M.V.R. Prasad, K.K. Satpathy, C. Maheswaran, Spectrochim. Acta A Mol. Biomol. Spectrosc. 115 (2013) 845.)- (5454 G. Raja Annamalai, R. Ravisankar , A. Chandrasekaran, Cerâmica 66, 379 (2020) 347.. Moreover, mostly low-temperature fired ancient potsherds may undergo several solid-state chemical reactions when they are in contact with soils, minerals, moisture, and gases during their longtime burial. The TGA curves of potsherd samples S1 to S4 are shown in Fig. 10a. The curves of the first derivative of the TGA curve, i.e. differential thermogravimetry (DTG) are also plotted, to understand the highest rate of weight change in the sample with temperature (Fig. 10b). It was clear from the TGA analysis that the weight loss mainly occurred in the initial portion of the curve in the temperature range of 30-100 °C, which corresponded to dehydration of the samples. The weight loss in the temperature range of 300-400 °C due to organic material as well as the weight loss due to the dehydroxylation of kaolinite in the range of 550-650 °C was absent for the studied samples. The absence of a dehydroxylation loss in the samples indicated that the potsherds were fired above 650 °C 5555 K.J.D. MacKenzie, C.M. Cardile, J. Mater. Sci. 25 (1990) 2937.. All the potsherd samples showed no decomposition of calcite between 700-800 °C indicating that calcite was either absent or the potsherds were fired below the decomposition temperature of calcite. The thermal analysis complemented the firing estimation of potsherds performed by FTIR and XRD techniques.
The cumulative volume of intruded mercury vs. pore diameter of all the samples was studied and the data are presented in Fig. 11. Moon et al. 5656 H.Y. Moon, H.S. Kim, D.S. Choi, Constr. Build. Mater. 20 (2006) 725. categorized porous media into three subgroups based on their pore size range as a macro (d>0.05 µm), meso (0.01<d<0.05 µm), and micro (d<0.01 µm) pores. According to this classification, the micaceous pottery mainly consisted of a greater proportion of macropores with the most dominant pore diameter falling in the range of 0.01-1 µm (Fig. 11).
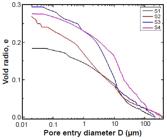
For specific gravity (G), each sample was analyzed in triplicate and the average value of G obtained is presented in Table IV along with the specific surface area of the grains. It can be inferred that the specific gravity of the material fell in the range of 2.5-2.8, which was close to Harappan potsherds (2.62-2.74) studied with a similar technique. The porosity of the potsherd samples S1-S4 varied from 21.87% to 26.37% (Table IV). This indicated that the inclusion for these potsherds was fine and relatively less coarse. But the porosity of Harappan potsherds 1 and 2 was 9.38% and 8.94%, respectively, which clearly indicated the coarseness of the inclusion for the potsherds. Generally, if the porosity of the pottery is above 30%, it can be considered fine-ware 5757 S. Kramar, J. Lux, Slovenia. Mater. Technol. 49 (2015) 503.. The micaceous potsherd samples S1 to S4 were relatively fine-ware and both Harappan potsherd pieces were very coarse. The mean pore diameters of all the samples were low and the mean pore diameter of Harappan potsherds was very low. Since the coarse sample exhibits bimodal pore size distribution and the mean pore diameter of the samples was low, they possibly exhibited monomodal pore size distribution. The megalithic potsherds also showed a higher void ratio (e=0.28-0.36) than the earlier Harappan potsherds (e=~0.10, Table IV). Red iron oxide seems to have been applied on either surface of the pottery for the desired hue. As the red oxide was not removed even after repeated washing with water, it may have been applied before firing the pottery. The high surface porosity helped the earth’s color to seep into the clay matrix.
Microbial analysis: the culture showed similarity with Bacillus velezensis strain CBMB 205 (accession n° NR116240) based on nucleotide homology on phylogenetic analysis. The cell attachment of the bacteria is towards acquiring nutrients from the minerals present in the potsherds. The microbes identified the rich and leachable mineral nutrients and concentrated on them. The metal nutrients needed by the microorganism were also sourced from minerals, decaying organic matters, colloids, etc.
CONCLUSIONS
Due to the non-availability of micaceous clay, the ancient potters of Central Peninsular India added mica flakes into the raw materials to manufacture pottery for storage and glittering. The fired pots manufactured by utilizing locally available black cotton soil were grey to grey-black in color, and the artisans applied aqueous red oxide on either surface before firing for the desired hue. The high porosity of the potsherds followed by firing in kiln allowed penetration of red oxide deep within the clay matrix. The red oxide bonded to the clay body and was no longer washable with water. Microscopic images showed the presence of a sandwich layer of original clay composition with different elemental composition to that of either surface. The vibrational and mineralogical analysis estimated a firing temperature of 700-750 °C in reducing atmosphere. Mercury intrusion porosimetry (MIP) revealed a low mean pore diameter for the micaceous fine ware with high porosity of 21-26% due to the presence of a large number of pores. In contrast, the Harappan potsherds were coarse ware with low porosity. The absence of a dehydroxylation peak in the thermal analysis indicated firing above 650 °C. The high content of iron determined by energy-dispersive X-ray spectroscopy (EDX) was due to the coating with iron oxide for red coloration before firing. The 16S rRNA gene sequencing indicated bacterial colonization of Bacillus velezensis in the round and elongated pits within the potsherds drawing nutrients from minerals. The mica was purposefully added to the raw material and the bacterial presence impacted the stability of potsherds. Microbial presence was mainly observed within the mica flakes.
ACKNOWLEDGMENTS
The authors are thankful to the Sophisticated Analytical Instrument Facility, IIT, Bombay. We would also like to thank Ms. Deeksha Gupta (NRLC) for the help extended in microbial analysis. The authors are thankful to the excavation team, and forest authority of Nagpur, India.
REFERENCES
-
1D. Anderson, All that glitters: the emergence of Native American micaceous art pottery in northern New Mexico, School Am. Res. Press, USA (1999).
-
2S.B. Deo, A.P. Jamkhedkar (Eds.), “Excavations at Naikund 1978-80”, Govt. Maharashtra, India (1982).
-
3H.S. Sharma (Ed.), “Perspectives in geomorphology”, 1, Concept Publ., New Delhi (1982).
-
4S.B. Deo, in “Radiocarbon and Indian archaeology”, D.P. Agrawal, A. Ghosh (Eds.), Tata Inst. Fund. Res., Mumbai (1973) 131.
-
5S.B. Deo , “Mahurjhari excavation, 1970-1972”, Nagpur Un., India (1973).
-
6G.B. Deglurkar, Megalithic Raipur, 1985-1990, Deccan Coll. Post-grad. Res. Inst., India (1992)
-
7G. Shete, Man Environ. 34 (2009) 66.
-
8I. Miloglav, in “Tracing pottery making recipes in the Balkans, 6th-4th millennium BC”, Serbian Acad. Sci. Arts, Belgrade (2014) 19.
-
9N. Rao, in “Hinduism and tribal religions, encyclopedia of Indian religions”, P. Jain, R. Sherma, M. Khanna (Eds.) Springer, Dordrecht (2019).
-
10G. Eramo, R. Laviano, I.M. Muntoni, G. Volpe, J. Cult. Herit. 5 (2004) 157.
-
11K.L. Rasmussen, A. Guillermo, A. De La Fuente, A.D. Bond, K.K. Mathiesen, S.D. Vera, J. Archaeol. Sci. 39 (2012) 1705.
-
12A. Moropoulou, A. Bakolas, K. Bisbikou, Thermochim. Acta 269 (1995) 779.
-
13N.I. Zagorodny, V. Cristina, M. Morosi, B. Balesta, in “Vessels explored: applying archaeometry to South American ceramics and their production”, E.M. Stovel, G.A. De La Fuente (Eds.), BAR Publ., Oxford (2016) 67.
-
14M. Maggetti, in “Scientific studies in ancient ceramic”, M.J. Hughes (Ed.), Brit. Museum Occas. Paper 19 (1981) 33.
-
15R.B. Heimann, M. Maggetti, in “Scientific studies in ancient ceramic”, M.J. Hughes (Ed.), Brit. Museum Occas. Paper 19 (1981) 163.
-
16A. Ciancio, A. Dell’Anna, R. Laviano, in “Roman ceramics and archaeometry: the state of studies”, All’Insegna del Giglio, Florence (1994) 261.
-
17M. Klein, F. Jesse, H.U. Kasper, A. Gölden, Archaeometry 46 (2004) 339.
-
18P.M. Rice, Pottery analysis: a sourcebook, 2nd ed., Un. Chicago Press, Chicago (2015)
-
19J. Kores, R. Ravisankar, G.R. Annamalai, G. Senthilkumar, BAOJ Phys. 3, 4 (2017) 1.
-
20M.S. Tite, Archaeometry 11 (1969) 131.
-
21J. Van Klinken, Archaeometry 43 (2001) 49.
-
22M.A.R. Torres, V. Costanzo-Álvarez, M. Aldana, N. Suárez, C. Campos, M.M. Mackowiak-Antczak, M.C. Brandtet, Stud. Geophys. Geod. 55 (2011) 717.
-
23J. Srodon, Clays Clay Miner. 32 (1984) 337.
-
24R. Ravisankar , A. Naseerutheen, A. Rajalakshmi, G.R. Annamalai , A. Chandrasekaran, Spectrochim. Acta A Mol. Biomol. Spectrosc. 129 (2014) 201.
-
25C. Heberling, R.P. Lowell, L. Liu, M.R. Fisk, Geochem. Geophy. Geosy. 11 (2010) 1.
-
26P.G. Johansen, J. Field Archaeol. 39 (2014) 256.
-
27J.D. Jordá, M.M. Jordán, R. Ibanco-Cañete, M.A. Montero, J.A. Reyes-Labarta, A. Sánchez, M. Cerdán, Appl. Clay Sci. 115 (2015) 1.
-
28S. Shoval, P. Beck, J. Therm. Anal. Calorim. 82 (2005) 609.
-
29Merkevičius, P. Bezdicka, R. Juskenas, J. Kiuberis, J. Senvaitiesne, I. Pakutinaskiene, A. Kareiva, Chemija 18 (2007) 36.
-
30K.V. Soundara Rajan, in “Seminar papers on the problem of megaliths in India”, Banaras Hindu Un., Varanasi (1969) 69.
-
31G.G. Mujumdar, in “Seminar papers on the problem of megaliths in India”, Banaras Hindu Un., Varanasi (1969) 90.
-
32T. Broekmans, A. Adriaens, E. Pantos, Nucl. Instrum. Methods Phys. Res. B 226 (2004) 92.
-
33E.W. Washburn, Phys. Rev. 17 (1921) 273.
-
34S. Kumar, G. Stecher, M. Li, C. Knyaz, K. Tamura, Mol. Biol. Evol. 35 (2018) 1547.
-
35J.G. Miller, J. Phys. Chem. 65 (1961) 800.
-
36F. Elsass, D. Olivier, Clay Miner. 13 (1978) 299.
-
37R. Prost, A. Dameme, E. Huard, J. Driard, J.P. Leydecker, Clays Clay Miner. 37 (1989) 464.
-
38Y. Maniatis, M. Tite, Trans. J. Br. Ceram. Soc. 74 (1975) 229.
-
39Y. Maniatis , A. Simopoulos, A. Kostikas, V. Perdikatsis, J. Am. Ceram. Soc. 66 (1983) 773.
-
40M.S. Jayswal, D.K. Kanchan, P. Sharma, N. Gondaliya, J. Mater. Sci. 21 (1986) 2418.
-
41G.R. Annamalai , R. Ravisankar , A. Naseerutheen , A. Chandrasekaran , K. Rajan, Optik 125 (2014) 6375.
-
42A. Chandrasekaran , A. Rajalakshmi , R. Ravisankar , S. Kalarasai, Egypt J. Basic Appl. Sci. 2 (2015) 55.
-
43D. Seetha, G. Velraj, Spectrochim. Acta A Mol. Biomol. Spectrosc. 149 (2015) 59.
-
44V.V. Morariu, M. Bogdan, I. Ardelean, Archaeometry 19 (1977) 187.
-
45S. Shoval, in “The Oxford handbook of archaeological ceramic analysis”, A. Hunt (Ed.), Oxford Un. Press (2017).
-
46R. Palanivel, U.R. Kumar, Rom. J. Phys. 56 (2011) 195.
-
47K. Kihara, Eur. J. Mineral. 2 (1990) 63.
-
48R. Ravisankar , S. Kiruba, A. Chandrasekaran , G. Senthilkumar , C. Maheswaran, Indian J. Sci. Technol. 3 (2010) 858.
-
49W.W. Barker, S.A. Welch, J.F. Banfield, in “Geomicrobiology: interaction between microbes and minerals”, J.F. Banfield , K.M. Nealson (Eds.), Miner. Soc. Am., Washington D.C., 35 (1997) 391.
-
50S. Bonneville, D.J. Morgan, A. Schmalenberger, A. Bray, A. Brown, S.A. Banwart, L.G. Benning, Geochim. Cosmochim. Acta 75 (2011) 6988.
-
51R. Ravisankar , G.R. Annamalai , A. Naseerutheen , A. Chandrasekaran , M.V.R. Prasad, K.K. Satpathy, C. Maheswaran, Spectrochim. Acta A Mol. Biomol. Spectrosc. 115 (2013) 845.
-
52R. Ravisankar , A. Naseerutheen , G.R. Annamalai , A. Chandrasekaran , A. Rajalakshmi , K.V. Kanagasabapathy, M.V.R. Prasad , K.K. Satpathy, Spectrochim. Acta A Mol. Biomol. Spectrosc. 121 (2014) 457.
-
53G.R. Annamalai , R. Ravisankar , A. Rajalakshmi , A. Chandrasekaran , K. Rajan, Spectrochim. Acta A Mol. Biomol. Spectrosc. 133 (2014) 112.
-
54G. Raja Annamalai, R. Ravisankar , A. Chandrasekaran, Cerâmica 66, 379 (2020) 347.
-
55K.J.D. MacKenzie, C.M. Cardile, J. Mater. Sci. 25 (1990) 2937.
-
56H.Y. Moon, H.S. Kim, D.S. Choi, Constr. Build. Mater. 20 (2006) 725.
-
57S. Kramar, J. Lux, Slovenia. Mater. Technol. 49 (2015) 503.
Publication Dates
-
Publication in this collection
17 May 2021 -
Date of issue
Apr-Jun 2021
History
-
Received
06 June 2020 -
Reviewed
11 Aug 2020 -
Reviewed
07 Oct 2020 -
Reviewed
13 Nov 2020 -
Accepted
17 Nov 2020


