
ABSTRACT
Determination of leaf nutrient concentrations is traditionally performed by carrying out destructive procedures, requiring laboratory chemical analysis, specialized equipment, and skilled labor. However, technological advances in recent years have now made it possible to analyze leaf nutrient concentrations using non-destructive methods such as leaf reflectance. This study evaluates the relationship between leaf reflectance and nutrient concentration in order to develop and apply nutrient indices by proximal sensing data in plantations of Eucalyptus. Two experiments were carried out for the development, application and validation of nutrient indices in Eucalyptus stands in the municipalities of Lassance and Três Marias, Minas Gerais state, Brazil. Study I was undertaken in Eucalyptus stands with 25 months old and, three clones. Leaves from the lower crown were visually classified into five color patterns using the Munsell chart for plant tissues. Study II was carried out in commercial stands of a hybrid of Eucalyptus urophylla ST Blake, whith 9, 12, 15 and 25 months old. Analysis revealed strong relationships between leaf nutrients and leaf reflectance in the visible and near infrared regions (400 - 900 nm) of the light spectrum. Correlation analysis between leaf reflectance and nutrients can be useful in an exploratory analysis of leaf nutrient concentration. Some nutrient indices developed (NI, PI, SI and CuI) provided satisfactory estimates of leaf nutrient concentration in Eucalyptus stands. The nutrient indices developed in this study may be a useful alternative to laboratory chemical analysis.
Keywords:
Hyperspectral; Leaf reflectance; Vegetation índices; Feature selection; Bootstrap
INTRODUCTION
Nutrient concentration in the tissues of a plant, especially foliage tissue, is directly related to exchange processes between matter and energy, including photosynthesis, evapotranspiration and respiration (Marschner, 1995MARSCHNER, H. Mineral nutrition of higher plants. Academic Press, 1995. 672 p.). Consequently, evaluation of leaf nutrient concentrations (LNCs) is useful for understanding a plant’s nutritional needs, planning fertilization, and optimizing the economic return from crops by maximizing productivity and minimizing resource inputs.
Determination of LNCs is traditionally performed using destructive procedures, requiring laboratory chemical analysis, specialized equipment, and skilled labor. However, technological advances in recent years have made it possible to analyze LNC using non-destructive methods (Pimstein et al., 2011PIMSTEIN, A.; KARNIELI, A.; SURINDER, K. B.; BONFIL, D. J. Exploring remotely sensed technologies for monitoring wheat potassium and phosphorus using field spectroscopy. Field Crops Research , v. 121, p. 125-135, 2011.; Mahajan et al., 2016; Oliveira et al., 2017OLIVEIRA, L. F. R., OLIVEIRA, M. L. R., GOMES, F. S., SANTANA, R. C. Estimating foliar nitrogen in Eucalyptus using vegetation indexes. Scientia Agricola, v. 74, n. 2, p. 142-147, 2017.). Spectral analysis techniques, using a variety of sensors, have enabled crops to be managed using non-destructive methods (Ustin et al., 2009USTIN, S. L.; GITELSON, A. A.; JACQUEMOUD, S.; SCHAEPMAN, M.; ASNER, G. P.; GAMON, J. A.; ZARCO-TEJADA, P. Retrieval of foliar information about plant pigment systems from high resolution spectroscopy. Remote Sensing of Environment , v. 113, p. 567-577, 2009.; Ollinger, 2010OLLINGER, S. V. Sources of variability in canopy reflectance and the convergent properties of plants. New Phytology, v. 189, p. 375-394, 2011.; Schlemmer et al., 2013SCHLEMMER, M.; GITELSON, A.; SCHEPERS, J.; FERGUSON, R.; PENG, Y.; SHANAHAN, J.; RUNDQUIST, D. Remote estimation of nitrogen and chlorophyll concentrations in maize at leaf and canopy levels. International Journal of Applied Earth Observation and Geoinformation, v. 25, p. 47-54, 2013.), and the technology could be extended to tree plantations (Stein et al., 2014STEIN, B. R.; THOMAS, V. A.; LORENTZ, L. J.; STRAHM, B. D. Predicting macronutrient concentrations from loblolly pine leaf reflectance across local and regional scales. GIScience &. Remote Sensing, v. 51, p. 269-287, 2014.; Oliveira et al., 2017).
Remotely-sensed analysis techniques require multiple electromagnetic wavelengths reflected by the plant’s foliage to be processed. The visible region (VIS, 400 - 700 nm) is influenced mainly by leaf pigments, especially chlorophyll (Gitelson et al., 2003GITELSON, A. A.; GRITZ, Y.; MERZLYAK, M. N. Relationships between leaf chlorophyll concentration and spectral reflectance and algorithms for non-destructive chlorophyll assessment in higher plant leaves. Journal of Plant Physiologic, v. 160, p. 271-282, 2003.; 2006GITELSON, A. A.; KEYDAN, G. P.; MERZLYAK, M. N. Three-band model for noinvasive estimation of chlorophyll carotenoids and anthocyanin concentrations in higher plant leaves. Geophysical Research Letters, v. 33, p. 1-5, 2006.; 2009). The near infrared region (NIR, 701 - 1200 nm) is related to morphological and anatomical leaf structures (Gates et al., 1965GATES, D. M.; KEEGAN, H. J.; SCHLETER, J. C.; WEIDNER, V. R. Spectral properties of plants. Applied Optics, v. 4, n. 1, p. 11-20, 1965.).
Currently, several indices are used to quantify the relationships between reflectance in the VIS and NIR regions and LNCs. However, such implementation has been limited to estimates of leaf pigments (eg, Gitelson et al., 2003GITELSON, A. A.; GRITZ, Y.; MERZLYAK, M. N. Relationships between leaf chlorophyll concentration and spectral reflectance and algorithms for non-destructive chlorophyll assessment in higher plant leaves. Journal of Plant Physiologic, v. 160, p. 271-282, 2003.; 2006; 2009GITELSON, A. A.; CHIVKUNOVA, O. B.; MERZLYAK, M. N. Nondestructive estimation of anthocyanins and chlorophylls in anthocyanic leaves. American Journal of Botany, v. 96, n. 10, p. 1861-1868, 2009.) and nitrogen (N, eg Fitzgerald et al., 2010FITZGERALD, G.; RODRIGUEZ, D.; O’LEARY, G. Measuring and predicting canopy nitrogen nutrition in wheat using a spectral index - The canopy chlorophyll concentration index (CCCI). Field Crops Research, v. 116, p. 318-324, 2010.; Schlemmer et al., 2013SCHLEMMER, M.; GITELSON, A.; SCHEPERS, J.; FERGUSON, R.; PENG, Y.; SHANAHAN, J.; RUNDQUIST, D. Remote estimation of nitrogen and chlorophyll concentrations in maize at leaf and canopy levels. International Journal of Applied Earth Observation and Geoinformation, v. 25, p. 47-54, 2013.; Oliveira et al., 2017OLIVEIRA, L. F. R., OLIVEIRA, M. L. R., GOMES, F. S., SANTANA, R. C. Estimating foliar nitrogen in Eucalyptus using vegetation indexes. Scientia Agricola, v. 74, n. 2, p. 142-147, 2017.). Deficiencies in nutrients other than N can alter plant metabolism and consequently a leaf’s reflectance (Mariotti et al., 1996MARIOTTI, M.; ERCOLI, L.; MASONI, A. Spectral properties of iron-deficient corn and sunflower leaves. Remote Sensing of Environment , v. 58, p. 282-288, 1996.; Mahajan et al., 2014MAHAJAN, G. R.; SAHOO, R. N.; PANDEY, R. N.; GUPTA, V. K.; KUMAR, D. Using hyperspectral remote sensing techniques to monitor nitrogen, phosphorus, sulphur and potassium in wheat (Triticum aestivum L.). Precision Agriculture, v. 15, n. 1, p. 499-522, 2014.). However, applications linking leaf reflectance to other macronutrients and micronutrients are poorly developed for trees (eg, Ponzoni and Gonçalves, 1999PONZONI, F. J.; GONÇALVES, J. L. M. Spectral features associated with nitrogen, phosphorus, and potassium deficiencies in Eucalyptus saligna seedling leaves. International Journal of Remote Sensing , v. 20, n. 11, p. 2249-2264, 1999.; Adams et al., 2000ADAMS, M. L.; NORVELL, W. A.; PHILPOT, W. D.; PEVERLY, J. H. Toward the discrimination of manganese, zinc, copper, and iron deficiency in “Bragg” sobyan using spectral detection methods. Agronomy Journal, v. 92, p. 268-274, 2000.; Pimstein et al., 2011PIMSTEIN, A.; KARNIELI, A.; SURINDER, K. B.; BONFIL, D. J. Exploring remotely sensed technologies for monitoring wheat potassium and phosphorus using field spectroscopy. Field Crops Research , v. 121, p. 125-135, 2011.; Mahajan et al., 2014; Stein et al., 2014STEIN, B. R.; THOMAS, V. A.; LORENTZ, L. J.; STRAHM, B. D. Predicting macronutrient concentrations from loblolly pine leaf reflectance across local and regional scales. GIScience &. Remote Sensing, v. 51, p. 269-287, 2014.). Therefore, the study of relationships between N, phosphorous (P), potassium (K), calcium (Ca), magnesium (Mg), sulfur (S), boron (B), iron (Fe), zinc (Zn), manganese (Mn) and cooper (Cu) concentrations and leaf reflectance can be useful to procced non-destructive analysis in Eucalyptus stands.
The objective of this study is to predict LNCs using leaf reflectance in order to develop nutrient indices of Eucalyptus plantation by proximal sensing data.
MATERIAL AND METHODS
Two studies (Study I and Study II) were carried out for the development, application and validation of nutrient indices using Eucalyptus stands in the counties of Lassance and Três Marias, Minas Gerais - Brazil (Figure 1).
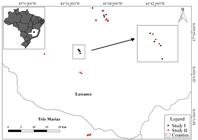
Study I was established in Eucalyptus stands with 25 months old, planted with 7.0 x 1.3 m tree spacing, with three clones (E. urophylla x E. grandis: GG680, E. urophylla x E. grandis: GG682 and hybrid of E. urophylla ST Blake: I144). In these stands nine plots of 10 ha were allocated, three per clone. Leaves from the lower parts of tree crowns were visually classified into five color patterns using the Munsell chart for plant tissues (Gretag-Macbeth, New Winsor, NY, USA). The leaf color patterns were defined by the clear expression of the biochemical cycling of nutrients (Table 1).
For each color pattern, 30 leaves were collected from each of the nine plots. A leaf was collected from each tree encountered on a random zig-zag walk. Each set of 30 leaves constituted a composite sample, and there was a total of 45 composite samples (3 clones x 3 plots x 5 leaf color patterns). This sampling was performed to obtain a wide variation in LNCs. Immediately after leaf collection, the leaf reflectance (400-900 nm) was scanned in the abaxial part of each leaf, 10 mm from the lower border, on the left side of each leaf using a CI-710 mini-spectrometer (CID Bio- Science - Camas, Washington, USA).
The leaf reflectance was analyzed using SpectraSnap! (software version 1.1.3.150, CID Bio-Science) with 300 milliseconds of integration time, a boxcar with 10 points and two scans for averaging. Subsequently, the reflectance spectra were smoothed using the Savitsky-Golay algorithm (Savitzky and Golay, 1964SAVITZKY, A.; GOLAY, M. J. E. Smoothing and differentiation of data by simplified least squares procedures. Analytical Chemistry, v. 36, n. 8, p. 1627-1639, 1964.) with a second-degree polynomial model. From every set of 30 smoothed spectra per composite sample, the average value of leaf reflectance was obtained, giving values for each of the 45 composite samples.
Subsequent to collecting the leaf reflectance, the 30 leaves for each composite sample were placed in paper bags and oven-dried with forced air circulation at 65ºC. After drying, the 45 composite samples were digested in nitro-perchloric solution and the concentrations of Ca, Mg, S, Zn, Fe and Mn were determined by spectrophotometry. The P concentration was determined by colorimetry, the K concentration by flame photometry and the total N concentration using the Kjeldahl method following sulfuric digestion.
Study II was carried out in commercial stands of the hybrid of Eucalyptus urophylla ST Blake (clone I144), which were 9, 12, 15 and 25 months old. Sixteen plots of 10 ha were allocated, four for each age of tree (Figure 1). Leaves from 25 trees in each of these plots were sampled; they were taken from the upper canopies of the stands (80% percentile). For each tree, four completely expanded leaves, without physical damage, were collected at the four cardinal points near the middle of each Eucalyptus crown (Bellote and Silva, 2000BELLOTE, A. F. J.; SILVA, H. D. Técnicas de amostragem e avaliações nutricionais em plantios de Eucalyptus spp. In: GONÇALVES, J. L. M., BENEDETTI, V., eds. Nutrição e fertilização florestal, IPEF, Piracicaba, Brasil, 2000. p. 105-134.). The 100-leaf set was made up of a composite sample used to determine nutrients and to collected leaf reflectance. The procedures for collecting, smoothing the reflectance spectra and leaf chemical analysis were the same as those used in Study I.
The results obtained from Studies I and II were grouped into a unique dataset and split into two groups: 75% as a training set and 25% as a validation set using the bootstrap resampling method with 1000 random iterations (Efron and Tibshirani, 1994EFRON, B.; TIBSHIRANI, R. J. An introduction to the bootstrap. Boca Raton:Chapman & Hall, 1994. 430 p.). The bootstrap statistic involves randomly composing the population samples n times, producing n statistical values with the objective of reducing the error associated with non-representative samples. The training set was used to generate the models for LNCs, while the validation set was used to validate the regression model generated.
The smoothed leaf reflectance spectra and the nutrient concentrations in the training set for the same composite sample were correlated in each iteration. This procedure was carried out to verify the effect of nutrients on Eucalyptus leaf by reflectance spectral responses. The Pearson correlation (r) was obtained using two vectors in each iteration: the corresponding average smoothed leaf reflectance of the training set and the foliar chemical analysis of the same samples. In order to identify significant wavelengths, a p-value (α ˂ 0.05) was also computed.
Spectral indices for different nutrients were calculated with all possible combinations of leaf reflectance at wavelengths between 400 and 900 nm. The indices were developed based on the Normalized Difference Vegetation Index (NDVI) model (Equation 1), wherein: NDVI is nutrient index based on Normalized Difference Vegetation Index; is the reflectance at wavelength (λ) x and is the reflectance at wavelength (λ) y, with x and y varying from 400 to 900 nm.
The nutrient indices were evaluated based on the mean for the coefficient of determination (R² train ) in all iterations, obtained by simple linear regressions. The R² train mean values were organized into matrices ranging from white, for smaller R² train , up to black, for larger R² train . Among all the indices, the one that provided the highest R² train value in each nutrient was selected for analysis of the regression and application in the validation set. The analysis of the quality of the adjustments was made based on the mean of the Root of Mean Square Error (RMSE train ) (Equation 2), wherein: Yi is the nutrient concentration of sample i estimated using the equation; yi is the nutrient concentration observed in the laboratory of sample i; and n is the total number of samples. RMSE train: g.kg-1 for N, P, K, Ca, Mg and S; mg.kg-1 for B, Zn, Mn, Fe and Cu.
To validate the nutrient indices and equations obtained for the training set, the determination coefficient (R²
val ) and the Root Mean of Square Error (RMSE
val ) were used; they were calculated in the same way as RMSE
train (Equation 2). The Kernel density was used with the bandwidths chosen according to Silverman’s rule of thumb (Silverman, 1986SILVERMAN, B. W. Density estimation for statistics and data analysis. Chapman and Hall,1986.) to demonstrate the density of the statistics bootstraps in the training and validation sets. The mean of the parameters slope and intercept was used to estimate the concentration of each nutrient in the original dataset. All statistical procedures were carried out using the software R Core Team (2017)R CORE TEAM. 2017. R: A language and environment for statistical computing. R Foundation for Statistical Computing, Vienna, Austria. https: //www.R-project.org./.
https: //www.R-project.org./...
version 3.4.0, platform support R Studio version 1.0.143.
Moreover, in order to aid the interpretation of the results obtained, mean and standard deviations of LNCs from commercial eucalyptus stands, which were between 0.4 and 7.0 years old, were used for reference (Galdino, 2015GALDINO, M. P. Valores de referência e faixas de suficiência nutricional para avaliação do estado nutricional da cultura do eucalipto no Brasil. 2015. 79 p. PhD thesis Universidade Federal de Viçosa, Viçosa.). These values came from an evaluation of 9608 leaf samples taken from the middle of each Eucalyptus crown, using the same method of leaf analysis as Studies I and II in this research.
RESULTS
The reflectance spectra in the bootstrap training and validation sets were similar (Figure 2). The visible spectrum, more specifically between 530 - 780 nm, was the region of the reflectance spectrum within the samples.

The samples provided a wide range of nutrient concentrations (Figure 3). This amplitude is desirable for the training and validation models. Nutrients with higher mobility, such as N and P presented lower concentrations when compared to the standard nutrient concentrations for Eucalyptus. The opposite was observed for some nutrients with lower mobility in plants, such as Ca, B and Mn concentrations. The other nutrients concentrations were similar in the training/validation sets compared with standard nutrient concentration.

Mean and standard deviation of nutrient concentrations in training and validation sets and standard concentrations to Eucalyptus. Standard concentration data from Galdino (2015GALDINO, M. P. Valores de referência e faixas de suficiência nutricional para avaliação do estado nutricional da cultura do eucalipto no Brasil. 2015. 79 p. PhD thesis Universidade Federal de Viçosa, Viçosa.).
As can be observed in Figure 4, there was a negative correlation between N, P, K, S, Cu concentrations and leaf reflectance in almost the entire visible region (400 - 700 nm). However, for K concentration, lower correlations were obtained in this region. The opposite was observed for Ca, B and Mn concentrations, which showed positive correlations in almost the entire visible region. Furthermore, Fe concentration showed significant correlation only at wavelengths of 560 - 710 nm, and Zn concentration showed significant correlation only in a small region around the wavelength of 400 nm. There was no significative correlation between Mg concentration and leaf reflectance for any of the wavelengths studied.

Pearson correlation (r) between nutrient concentrations and leaves reflectance from training set. Shaded region illustrate significance level (α< 0.05).
The correlation curves between N, P, S, Cu, K concentrations and leaf reflectance followed a similar pattern for all wavelengths evaluated (Figure 4). Moreover, the correlation curves between Ca, Mn, B concentrations and leaf reflectance also showed a similar pattern. Additionally, around a wavelength of 730 nm all nutrients presented correlations with the leaf reflectance close to zero. Above this wavelength, all nutrients reversed their relationship with leaf reflectance. Most of the nutrient concentrations exhibited maximum correlations in the red edge region (680 - 740 nm); only Zn demonstrated a maximum correlation in the region of blue (400 - 450 nm) and Ca at around 750 nm.
For most nutrients, the wavelengths combinations in red edge region provided high R² values in the development of the index (Figure 5). All indices developed showed significant R² at 95% probability using t test (α < 0.05). The Nitrogen Index (NI) had the highest R² (0.96), followed by the Phosphorus Index (PI, R² = 0.92), Sulfur Index (SI, R² = 0.79), Copper Index (CuI, R² = 0.71), Potassium Index (KI, R² = 0.64), Calcium Index (CaI, R² = 0.60), Manganese Index (MnI, R² = 0.56), Boron Index (BI, R² = 0.55), Zinc Index (ZnI, R² = 0.36), Iron Index (FeI, R² = 0.22) and Magnesium Index (MgI, R² = 0.17).

Determination coefficient (R²) between indices and nutrient concentrations from training set. NI= Nitrogen Index; PI= Phosphorus Index, KI= Potassium Index; CaI= Calcium Index; MgI= Magnesium Index; SI= Sulphur Index; BI= Boron Index; ZnI= Zinc Index; MnI= Manganese Index; FeI= Iron Index; CuI= Copper Index.
The NI obtained the highest R 2 values followed by others with wavelength combinations in the red edge region (Figure 5). To estimate the P concentration, two well-demarcated regions of high R² were obtained, one in the red edge region and other in the green region (≈ 560 - 570 nm). However, the highest R² value was obtained in the red edge region. Therefore, the PI was developed with wavelengths in this region. Similar to PI, other indices like KI, CaI, SI and MnI obtained their maximum R 2 values in more than one region of spectrum. For KI, the maximum was obtained in the green wavelength region; for CaI and SI maximums were in wavelength combinations in red edge region, and the MnI used red edge and blue wavelength regions. MnI and CuI were indices formed by combinations of distinct regions of the electromagnetic spectrum with the CuI developed using blue and green wavelengths. Some indices obtained higher values of R² with combinations of wavelengths in the blue region, such as ZnI and FeI. Additionally, MgI obtained higher R² values using near infrared (NIR) wavelengths. Nevertheless, MgI was the index with the lowest R².
To demonstrate all iterations for the bootstrap regression, training and validating were used to produce the Kernel density plot for each leaf nutrient (Figure 6). The estimates of N, P, S and Cu concentrations using their related indices gave higher R 2 train and R 2 val , on average. The estimate for nitrogen using the NI gave the highest R 2 train and R 2 val , 0.96, on average. Moreover, the NI estimates N with RMSE train = 1.23 (g.kg-1) and RMSE val = 1.20 (g.kg-1), on average. As can be observed in Figure 7, this index showed excellent prediction of N concentration.
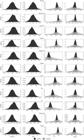
Kernel Density of parameters intercept and slope, R²train, R²val, RMSEtrain and RMSEval. Training average: black dotted vertical lines. Validation average: grey dotted vertical lines.
Similar to predicted N concentration, the PI estimate for the P concentration with R 2 train = 0.92, R 2 val = 0.93, RMSE train = 0.10 (g.kg-1) and RMSE val = 0.09 (g kg-1) on average (Figure 6), resulted in an excellent prediction of P concentration (Figure 7). The SI and CuI estimates for the S and Cu concentrations showed relationships R 2 train = 0.79, R 2 val = 0.80 and R 2 train = 0.71, R 2 val = 0.70 respectively, on average (Figure 6). Furthermore, the SI provided RMSE train and RMSE val = 0.12 g.kg-1 and CuI provided RMSE train and RMSE val = 0.71 mg.kg-1 on average (Figure 6), resulting in good predictions for both S concentration and Cu concentration (Figure 7).

The linear relationships between K, Ca, B and Mn concentrations and their indices were less precise than previous nutrients (Figures 6, 7). However, these nutrients were predicted with R 2 train and R 2 val average ranges between 0.55 and 0.66. Moreover; the RMSE train and RMSE val on average were 1.56 and 1.57 g.kg-1 for K concentration, 2.60 and 2.56 g.kg-1 for Ca concentration, 26.72 and 26.46 mg.kg-1 for B concentration and 589.83 and 587.32 mg.kg-1 for Mn concentration (Figure 6).
On average, the estimates for Mg, Zn and Fe concentrations and their related indices showed the lowest linear relationships (Figure 7). The MgI was the index with the lowest R 2 train (0.17) and R 2 val (0.22), and it also had the peak R 2 val for Kernel density, at close to 0 (Figure 6). Likewise, the FeI also had a peak R 2 val for Kernel density close to zero and the average linear relationship with Fe concentration was 0.22 for training and 0.25 for validation. The ZnI provided an R 2 val for Kernel density with a range of 0.00 to 0.80, which may mean that the linear model is not suitable for estimating Zn concentration (Figure 6).
DISCUSSION
The major standard deviation range in the visible region is due to the color pattern used in leaf sampling (Table 1). Changes in leaf color result in changes in leaf reflectance, mainly in the visible region (Merzlyak et al., 2003MERZLYAK, M. N.; GITELSON, A. A.; CHIVKUNOVA, O. B.; SOLOVCHENCO, A. E.; POGOSYAN, S. I. Application of reflectance spectroscopy for analysis of higher plant pigments. Russian Journal of Plant Physiology, v. 50, n. 5, p. 704-710, 2003.). The similarity between training and validation sets occurred as a result of using the bootstrap technique (Figures 2, 3). This is mainly because the bootstrap statistic distribution is based on a large number of resamples, representing the distribution for each statistic, based on a large number of samples (Efron and Tibshirani, 1994EFRON, B.; TIBSHIRANI, R. J. An introduction to the bootstrap. Boca Raton:Chapman & Hall, 1994. 430 p.).
The negative correlation between N, P, K, Cu, S concentrations and foliar reflectance in the VIS region indicates that the lower these nutrients concentrations in the leaves, the higher will be the reflectance in this region (Figures 3 and 4). This similarity in pattern suggests that the nutrients in question are strongly correlated (Pimstein et al., 2011PIMSTEIN, A.; KARNIELI, A.; SURINDER, K. B.; BONFIL, D. J. Exploring remotely sensed technologies for monitoring wheat potassium and phosphorus using field spectroscopy. Field Crops Research , v. 121, p. 125-135, 2011.; Mahajan et al., 2014MAHAJAN, G. R.; SAHOO, R. N.; PANDEY, R. N.; GUPTA, V. K.; KUMAR, D. Using hyperspectral remote sensing techniques to monitor nitrogen, phosphorus, sulphur and potassium in wheat (Triticum aestivum L.). Precision Agriculture, v. 15, n. 1, p. 499-522, 2014.). The increase of reflectance in the VIS region is mainly due to a reduction in chlorophyll concentration, triggered by the lowering of these nutrient concentrations (Al-Abbas et al., 1974AL-ABBAS, A. H.; BARR, R.; HALL, J. D.; CRANE, F. L.; BAUMGARDNER, M. F. Spectral of normal and nutrient-deficient maize leaves. Agronomy Journal , v. 66, n. 1, p. 16-20, 1974.; Adams et al., 2000ADAMS, M. L.; NORVELL, W. A.; PHILPOT, W. D.; PEVERLY, J. H. Toward the discrimination of manganese, zinc, copper, and iron deficiency in “Bragg” sobyan using spectral detection methods. Agronomy Journal, v. 92, p. 268-274, 2000.). Consequently, with an increase of reflectance in the visible region there is a decrease in the intensity of the leaf color (Ponzoni and Gonçalves, 1999PONZONI, F. J.; GONÇALVES, J. L. M. Spectral features associated with nitrogen, phosphorus, and potassium deficiencies in Eucalyptus saligna seedling leaves. International Journal of Remote Sensing , v. 20, n. 11, p. 2249-2264, 1999.; Ayala-Silva and Beyl, 2005AYALA-SILVA, T.; BEYL, C.A. Changes in spectral reflectance of wheat leaves in response to specific macronutrient deficiency. Advances in Space Research, v. 35, p. 305-317, 2005.; Oliveira et al., 2017OLIVEIRA, L. F. R., OLIVEIRA, M. L. R., GOMES, F. S., SANTANA, R. C. Estimating foliar nitrogen in Eucalyptus using vegetation indexes. Scientia Agricola, v. 74, n. 2, p. 142-147, 2017.). Thus, the reduction of the intensity of the green coloration of Eucalyptus leaves can be verified through a deficiency in these nutrients with evolution of the characteristic symptoms for each nutrient (Dell, 1996DELL, B. Diagnosis of nutrient deficiencies in eucalypts. In: ATTIWILL, P. M.; ADAMS, M.A., editors. Nutrition of eucalypts. Australia:CSIRO, 1996. p. 417-440.).
Regarding the Ca, B and Mn concentrations, positive correlations obtained with leaf reflectance in the VIS region indicate that the higher their concentrations, the greater will be the leaf reflectance in this region (Figure 4). The concentrations of these nutrients are higher than the ranges for leaf desire concentrations for Eucalyptus (Figure 3). Therefore, an increase in these nutrient concentrations in leaves could indicate damage to the metabolism and a consequent increase in leaf reflectance as suggested by the correlations in the visible region (Figure 4).
At around 700 nm, correlation peaks were found for all nutrient concentrations (Figure 4). This region of the electromagnetic spectrum is widely used in the estimation of chlorophyll (Ustin et al., 2009USTIN, S. L.; GITELSON, A. A.; JACQUEMOUD, S.; SCHAEPMAN, M.; ASNER, G. P.; GAMON, J. A.; ZARCO-TEJADA, P. Retrieval of foliar information about plant pigment systems from high resolution spectroscopy. Remote Sensing of Environment , v. 113, p. 567-577, 2009.) and strongly correlates with LNCs (Mutanga et al., 2004MUTANGA, O.; SKIDMORE, A. K.; PRINS, H. H. T. Predicting in situ pasture quality in the Kruger National Park, South Africa, using continuum-removed absorption features. Remote Sensing of Environment , v. 89, p. 393-408, 2004.; Mahajan et al., 2014MAHAJAN, G. R.; SAHOO, R. N.; PANDEY, R. N.; GUPTA, V. K.; KUMAR, D. Using hyperspectral remote sensing techniques to monitor nitrogen, phosphorus, sulphur and potassium in wheat (Triticum aestivum L.). Precision Agriculture, v. 15, n. 1, p. 499-522, 2014.; Stein et al., 2014STEIN, B. R.; THOMAS, V. A.; LORENTZ, L. J.; STRAHM, B. D. Predicting macronutrient concentrations from loblolly pine leaf reflectance across local and regional scales. GIScience &. Remote Sensing, v. 51, p. 269-287, 2014.). Thus, in the development of nutrient indices, the selection of at least one wavelength in this region was expected (Figure 4).
In the development of the NI, combinations of wavelengths with high R² were obtained (Figure 5). The relationship between N and leaf reflectance is very strong in practically all VIS region (Figure 4). Therefore, in the literature, indices are able to estimate the N concentration in the blue wavelength region (Hansen and Schjoerring, 2002HANSEN, P. M., SCHJOERRING, J. K. Reflectance measurement of canopy biomass and nitrogen status in wheat crops using normalized difference vegetation indices and partial least squares regression. Remote Sensing of Environment, v. 86, p. 542-553, 2003.) and in the green, red and red edge regions (Oliveira et al., 2017OLIVEIRA, L. F. R., OLIVEIRA, M. L. R., GOMES, F. S., SANTANA, R. C. Estimating foliar nitrogen in Eucalyptus using vegetation indexes. Scientia Agricola, v. 74, n. 2, p. 142-147, 2017.). In this study, better results were found using combinations of red edge wavelength regions (Figure 5). In addition, it is a common observation in plants that the N concentration estimates are the most accurate out of all leaf nutrients (Ponzoni and Gonçalves, 1999PONZONI, F. J.; GONÇALVES, J. L. M. Spectral features associated with nitrogen, phosphorus, and potassium deficiencies in Eucalyptus saligna seedling leaves. International Journal of Remote Sensing , v. 20, n. 11, p. 2249-2264, 1999.; Richardson and Reeves III, 2005RICHARDSON, A. D.; REEVES III, J. B. Quantitative reflectance spectroscopy as an alternative to traditional wet lab analysis of foliar chemistry: near-infrared and mid-infrared calibrations compared. Canadian Journal of Forest Research, v. 35, p. 1122-1130, 2005.; Mahajan et al., 2014MAHAJAN, G. R.; SAHOO, R. N.; PANDEY, R. N.; GUPTA, V. K.; KUMAR, D. Using hyperspectral remote sensing techniques to monitor nitrogen, phosphorus, sulphur and potassium in wheat (Triticum aestivum L.). Precision Agriculture, v. 15, n. 1, p. 499-522, 2014.). This was also the case in our study, where the N concentration was predicted with R train and R val above 0.95 (Figures 6 and 7).
Similar to the NI, the PI was developed using a combination of red edge wavelengths (Figure 5). Moreover, combinations of leaf reflectance in the region for green wavelengths (≈ 550 nm) also showed high R² in the estimation of P concentration (Figure 5). Leaf reflectance in these regions of the electromagnetic spectrum is widely used to construct relationships between P concentration and leaf reflectance. For instance, leaf reflectance in the green region was related to P concentration in soybean plants (Glycine max (L.) Merr.) and seedlings of Eucalyptus saligna Smith (Milton et al., 1991MILTON, N. M.; EISWERTH, B. A.; AGER, C. M. Effect of phosphorus deficiency on spectral reflectance and morphology of soybean plants. Remote Sensing of Environment , v. 36, p. 121-127, 1991.; Ponzoni and Gonçalves, 1999PONZONI, F. J.; GONÇALVES, J. L. M. Spectral features associated with nitrogen, phosphorus, and potassium deficiencies in Eucalyptus saligna seedling leaves. International Journal of Remote Sensing , v. 20, n. 11, p. 2249-2264, 1999.). Nevertheless, correlation peaks between P concentration and leaf reflectance in the green and red regions were also verified in sequoias (Gong et al., 2002GONG, P.; PU, R.; HEALD, R. C. Analysis of in situ hyperspectral data for nutrient estimation of giant sequoia. International Journal of Remote Sensing, v. 23, n. 9, p. 1827-1850, 2002.). In addition, the region of red wavelengths has been used to estimate P concentration in rangeland plants and pastures (Kawamura et al., 2011KAWAMURA, K.; MACKAY, A. D.; TUOHY, M. P.; BETTERIDGE, K.; SANCHES, I. D.; INOUE, Y. Potential for spectral indices to remotely sense phosphorus and potassium concentration of legume-based pasture as a means of assessing soil phosphorus and potassium fertility status. International Journal of Remote Sensing , v. 32, n. 1, p. 103-124, 2011.; Özyiğit and Bilgen, 2013ÖZYIĞIT, Y.; BILGEN, M. Use of spectral reflectance values for determining nitrogen, phosphorus, and potassium concentrations of rangeland plants. Journal Agricola Science Technology, v. 15, p. 1537-1545, 2013.). It is assumed that for P concentration, there is the possibility of developing a PI in both regions, green and red edge. However, the adjustment performed with the PI in the red edge region presented a better estimate of P concentration in this study (Figures 6, 7).
The correlations curve and matrix between S concentration and leaf reflectance demonstrated a great similarity with the correlation curves between N and P concentrations and leaf reflectance (Figures 4, 5). Moreover, the S concentration predicted provided average R train and R val above 0.79 and RMSE train and RMSE val below 0.12 g.kg-1 (Figures 6, 7). The wavelengths selected for the SI were close to those selected for the NI (Figure 5). Probably, this was due to the high correlation between these nutrients, both of which have structural functions in amino acids and proteins (Marschner, 1995MARSCHNER, H. Mineral nutrition of higher plants. Academic Press, 1995. 672 p.). The CuI, another index that predicted nutrient concentration with high accuracy (Figures 6, 7), was developed by combining blue and red wavelength regions (Figure 5). More than half of the Cu located in the chloroplast is in plastocyanin, a blue protein component of the electron transport chain (Marschner, 1995). Possibly because of this, these wavelengths provided the best results. Furthermore, Wang et al. (2015WANG, J.; WANG, T.; SHI, T.; WU, G.; SKIDMORE, A. K. A wavelet-based area parameter for indirectly estimating copper concentration in Carex leaves from canopy reflectance. Remote Sensing, v. 7, p. 15340-15360, 2015.) noted the red and red edge wavelength regions were strongly correlated with Cu concentration in Carex cinerascens Kük..
The K, Ca, B and Mn concentrations were predicted with less accuracy than the previously mentioned nutrients. The index constructed to predict K concentration (KI) was developed by combining green wavelengths (Figure 5). Although the relationship between leaf reflectance and K concentration was lower than for N and P concentrations (Figure 4), wavelength combinations in the visible region can be used to predict K concentration (Figure 5). Perhaps for this reason, the visible region has been used to detect K deficiencies in Eucalyptus saligna Smith seedling leaves (Ponzoni and Gonçalves, 2010).
The CaI was developed using red edge wavelengths (Figure 5), a region that has a strong relationship with the metabolic changes in plants (Horler et al., 1983HORLER, D. N.; DOCKRAY, M.; BARBER, J. The red edge of plant leaf reflectance. International Journal of Remote Sensing , v. 4, p. 273-288, 1983.). Nevertheless, it was expected that the CaI would be developed using wavelengths related to foliar structural components such as the NIR region (Gates et al., 1965GATES, D. M.; KEEGAN, H. J.; SCHLETER, J. C.; WEIDNER, V. R. Spectral properties of plants. Applied Optics, v. 4, n. 1, p. 11-20, 1965.), because of Ca’s structural function in the leaf cell wall (Marschner, 1995MARSCHNER, H. Mineral nutrition of higher plants. Academic Press, 1995. 672 p.). However, there is evidence of the direct role of Ca in photosynthesis as a cofactor in photosystem II (Siegbahn and Crabtree, 1999SIEGBAHN, P. E. M.; CRABTREE, R. H. Manganese oxyl radical intermediates and O-O bond formation in photosynthetic oxygen evolution and a proposed role for the calcium cofactor in photosystem II. Journal of American Chemical Society, v. 121, n. 1, p. 117-127, 1999.), which would explain the selection of wavelengths in this region.
Another index for which a combination of red edge wavelengths provided better results was the BI (Figure 5). It was also expected that estimation for this nutrient concentration would be most accurate in the NIR wavelength region. This is mainly owing to B’s contribution to cell wall biosynthesis and structure; it is the main element responsible for membrane integrity (Marschner, 1995MARSCHNER, H. Mineral nutrition of higher plants. Academic Press, 1995. 672 p.). However, there is evidence that a cascade effect for this nutrient occurs, wherein changes in membrane integrity lead to changes in plant metabolism (Marschner, 1995). Probably due to this cascade effect, better results were obtained in the red edge wavelength region (Figure 5).
The MnI was developed using red edge and blue wavelength regions (Figure 5). The red edge wavelengths, as previously stated, are related to the metabolism of plants (Horler et al., 1983HORLER, D. N.; DOCKRAY, M.; BARBER, J. The red edge of plant leaf reflectance. International Journal of Remote Sensing , v. 4, p. 273-288, 1983.). In terms of the choice of the blue wavelength region, the light in the blue region may cause a photodamage process to photosystem II. It is suggested that this process occurs at the manganese cluster of the oxygen-evolving complex (OEC) by means of photoexcitation of manganese (Hakala et al. 2005HAKALA, M.; TUOMINEN, I.; KERÄNEN, M.; TYYSTJÄRVI, T.; TYYSTJÄRVI, E. Evidence for the role of the oxygen-evolving manganese complex in photoinhibition of photosystem II. Biochemical Biophysical Acta, v. 1706, p. 68-80, 2005.). It may be due to this that combinations of blue regions with high R 2 (Figure 5) can be observed. The Mn was predicted with mean values for R 2 train and R 2 val above 0.56, and RMSE train and RMSE val below 590 mg.kg-1 (Figures 6, 7). As in this study, Adams et al. (2000ADAMS, M. L.; NORVELL, W. A.; PHILPOT, W. D.; PEVERLY, J. H. Toward the discrimination of manganese, zinc, copper, and iron deficiency in “Bragg” sobyan using spectral detection methods. Agronomy Journal, v. 92, p. 268-274, 2000.), using NDVI to discriminate some micronutrient deficits in soybean leaves, obtained better results for Mn and Cu concentrations.
The ZnI, FeI and MgI each provided lower linear relationships with their concentrations (Figure 6). Among these indices, a better estimate for Zn concentration was observed (Figures 6, 7). For the FeI, the green wavelength region (≈550 nm) estimated the Fe concentration better than the blue region in sunflowers (Helianthus annuus L.) and maize (Zea mays L.) (Mariotti et al., 1996MARIOTTI, M.; ERCOLI, L.; MASONI, A. Spectral properties of iron-deficient corn and sunflower leaves. Remote Sensing of Environment , v. 58, p. 282-288, 1996.). On the other hand, Adams et al. (2000ADAMS, M. L.; NORVELL, W. A.; PHILPOT, W. D.; PEVERLY, J. H. Toward the discrimination of manganese, zinc, copper, and iron deficiency in “Bragg” sobyan using spectral detection methods. Agronomy Journal, v. 92, p. 268-274, 2000.), using NDVI, failed to discern Fe and Zn deficits in soybean leaves, in spite of obtaining better results for Mn and Cu concentrations. The MgI was developed in the NIR wavelength region in this study. The MgI was the index that presented smaller R² (Figure 5). Mostly, estimates of this nutrient provide lower R² of LNCs (Richardson and Reeves III, 2005RICHARDSON, A. D.; REEVES III, J. B. Quantitative reflectance spectroscopy as an alternative to traditional wet lab analysis of foliar chemistry: near-infrared and mid-infrared calibrations compared. Canadian Journal of Forest Research, v. 35, p. 1122-1130, 2005.; Stein et al., 2014STEIN, B. R.; THOMAS, V. A.; LORENTZ, L. J.; STRAHM, B. D. Predicting macronutrient concentrations from loblolly pine leaf reflectance across local and regional scales. GIScience &. Remote Sensing, v. 51, p. 269-287, 2014.). Mg is the central atom of the chlorophyll molecule, in addition to being an activator of some enzymes in plants (Marschner, 1995MARSCHNER, H. Mineral nutrition of higher plants. Academic Press, 1995. 672 p.). Thus, wavelengths more related to chlorophyll, such as the red edge region, were expected to be selected. However, the NIR region is generally used to estimate Mg concentration (Ferwerda and Skidmore, 2007FERWERDA, J. G.; SKIDMORE, A. K. Can nutrient status of four woody plant species be predicted using field spectrometry? ISPRS Journal of Photogrammetry and Remote Sensing, v. 62, p. 406-414, 2007.; Mutanga et al., 2004MUTANGA, O.; SKIDMORE, A. K.; PRINS, H. H. T. Predicting in situ pasture quality in the Kruger National Park, South Africa, using continuum-removed absorption features. Remote Sensing of Environment , v. 89, p. 393-408, 2004.).
CONCLUSION
There are strong relationships between leaf nutrients and leaf reflectance in the visible and near infrared regions (400-900 nm) of the spectrum. Correlation analysis between foliar reflectance and leaf nutrients may be useful in an exploratory analysis of LNCs. Some of the nutrient indices developed provided satisfactory estimates of LNC in Eucalyptus stands. The nutrient indices developed may offer a viable alternative to laboratory chemical analysis.
REFERENCES
- ADAMS, M. L.; NORVELL, W. A.; PHILPOT, W. D.; PEVERLY, J. H. Toward the discrimination of manganese, zinc, copper, and iron deficiency in “Bragg” sobyan using spectral detection methods. Agronomy Journal, v. 92, p. 268-274, 2000.
- AL-ABBAS, A. H.; BARR, R.; HALL, J. D.; CRANE, F. L.; BAUMGARDNER, M. F. Spectral of normal and nutrient-deficient maize leaves. Agronomy Journal , v. 66, n. 1, p. 16-20, 1974.
- AYALA-SILVA, T.; BEYL, C.A. Changes in spectral reflectance of wheat leaves in response to specific macronutrient deficiency. Advances in Space Research, v. 35, p. 305-317, 2005.
- BELLOTE, A. F. J.; SILVA, H. D. Técnicas de amostragem e avaliações nutricionais em plantios de Eucalyptus spp. In: GONÇALVES, J. L. M., BENEDETTI, V., eds. Nutrição e fertilização florestal, IPEF, Piracicaba, Brasil, 2000. p. 105-134.
- DELL, B. Diagnosis of nutrient deficiencies in eucalypts. In: ATTIWILL, P. M.; ADAMS, M.A., editors. Nutrition of eucalypts. Australia:CSIRO, 1996. p. 417-440.
- EFRON, B.; TIBSHIRANI, R. J. An introduction to the bootstrap. Boca Raton:Chapman & Hall, 1994. 430 p.
- FERWERDA, J. G.; SKIDMORE, A. K. Can nutrient status of four woody plant species be predicted using field spectrometry? ISPRS Journal of Photogrammetry and Remote Sensing, v. 62, p. 406-414, 2007.
- FITZGERALD, G.; RODRIGUEZ, D.; O’LEARY, G. Measuring and predicting canopy nitrogen nutrition in wheat using a spectral index - The canopy chlorophyll concentration index (CCCI). Field Crops Research, v. 116, p. 318-324, 2010.
- GATES, D. M.; KEEGAN, H. J.; SCHLETER, J. C.; WEIDNER, V. R. Spectral properties of plants. Applied Optics, v. 4, n. 1, p. 11-20, 1965.
- GALDINO, M. P. Valores de referência e faixas de suficiência nutricional para avaliação do estado nutricional da cultura do eucalipto no Brasil. 2015. 79 p. PhD thesis Universidade Federal de Viçosa, Viçosa.
- GITELSON, A. A.; GRITZ, Y.; MERZLYAK, M. N. Relationships between leaf chlorophyll concentration and spectral reflectance and algorithms for non-destructive chlorophyll assessment in higher plant leaves. Journal of Plant Physiologic, v. 160, p. 271-282, 2003.
- GITELSON, A. A.; KEYDAN, G. P.; MERZLYAK, M. N. Three-band model for noinvasive estimation of chlorophyll carotenoids and anthocyanin concentrations in higher plant leaves. Geophysical Research Letters, v. 33, p. 1-5, 2006.
- GITELSON, A. A.; CHIVKUNOVA, O. B.; MERZLYAK, M. N. Nondestructive estimation of anthocyanins and chlorophylls in anthocyanic leaves. American Journal of Botany, v. 96, n. 10, p. 1861-1868, 2009.
- GONG, P.; PU, R.; HEALD, R. C. Analysis of in situ hyperspectral data for nutrient estimation of giant sequoia. International Journal of Remote Sensing, v. 23, n. 9, p. 1827-1850, 2002.
- HAKALA, M.; TUOMINEN, I.; KERÄNEN, M.; TYYSTJÄRVI, T.; TYYSTJÄRVI, E. Evidence for the role of the oxygen-evolving manganese complex in photoinhibition of photosystem II. Biochemical Biophysical Acta, v. 1706, p. 68-80, 2005.
- HANSEN, P. M., SCHJOERRING, J. K. Reflectance measurement of canopy biomass and nitrogen status in wheat crops using normalized difference vegetation indices and partial least squares regression. Remote Sensing of Environment, v. 86, p. 542-553, 2003.
- HORLER, D. N.; DOCKRAY, M.; BARBER, J. The red edge of plant leaf reflectance. International Journal of Remote Sensing , v. 4, p. 273-288, 1983.
- KAWAMURA, K.; MACKAY, A. D.; TUOHY, M. P.; BETTERIDGE, K.; SANCHES, I. D.; INOUE, Y. Potential for spectral indices to remotely sense phosphorus and potassium concentration of legume-based pasture as a means of assessing soil phosphorus and potassium fertility status. International Journal of Remote Sensing , v. 32, n. 1, p. 103-124, 2011.
- MAHAJAN, G. R.; SAHOO, R. N.; PANDEY, R. N.; GUPTA, V. K.; KUMAR, D. Using hyperspectral remote sensing techniques to monitor nitrogen, phosphorus, sulphur and potassium in wheat (Triticum aestivum L.). Precision Agriculture, v. 15, n. 1, p. 499-522, 2014.
- MARIOTTI, M.; ERCOLI, L.; MASONI, A. Spectral properties of iron-deficient corn and sunflower leaves. Remote Sensing of Environment , v. 58, p. 282-288, 1996.
- MARSCHNER, H. Mineral nutrition of higher plants. Academic Press, 1995. 672 p.
- MERZLYAK, M. N.; GITELSON, A. A.; CHIVKUNOVA, O. B.; SOLOVCHENCO, A. E.; POGOSYAN, S. I. Application of reflectance spectroscopy for analysis of higher plant pigments. Russian Journal of Plant Physiology, v. 50, n. 5, p. 704-710, 2003.
- MILTON, N. M.; EISWERTH, B. A.; AGER, C. M. Effect of phosphorus deficiency on spectral reflectance and morphology of soybean plants. Remote Sensing of Environment , v. 36, p. 121-127, 1991.
- MUTANGA, O.; SKIDMORE, A. K.; PRINS, H. H. T. Predicting in situ pasture quality in the Kruger National Park, South Africa, using continuum-removed absorption features. Remote Sensing of Environment , v. 89, p. 393-408, 2004.
- OLIVEIRA, L. F. R., OLIVEIRA, M. L. R., GOMES, F. S., SANTANA, R. C. Estimating foliar nitrogen in Eucalyptus using vegetation indexes. Scientia Agricola, v. 74, n. 2, p. 142-147, 2017.
- OLLINGER, S. V. Sources of variability in canopy reflectance and the convergent properties of plants. New Phytology, v. 189, p. 375-394, 2011.
- ÖZYIĞIT, Y.; BILGEN, M. Use of spectral reflectance values for determining nitrogen, phosphorus, and potassium concentrations of rangeland plants. Journal Agricola Science Technology, v. 15, p. 1537-1545, 2013.
- PIMSTEIN, A.; KARNIELI, A.; SURINDER, K. B.; BONFIL, D. J. Exploring remotely sensed technologies for monitoring wheat potassium and phosphorus using field spectroscopy. Field Crops Research , v. 121, p. 125-135, 2011.
- PONZONI, F. J.; GONÇALVES, J. L. M. Spectral features associated with nitrogen, phosphorus, and potassium deficiencies in Eucalyptus saligna seedling leaves. International Journal of Remote Sensing , v. 20, n. 11, p. 2249-2264, 1999.
- R CORE TEAM. 2017. R: A language and environment for statistical computing. R Foundation for Statistical Computing, Vienna, Austria. https: //www.R-project.org./
» https: //www.R-project.org./ - RICHARDSON, A. D.; REEVES III, J. B. Quantitative reflectance spectroscopy as an alternative to traditional wet lab analysis of foliar chemistry: near-infrared and mid-infrared calibrations compared. Canadian Journal of Forest Research, v. 35, p. 1122-1130, 2005.
- SAVITZKY, A.; GOLAY, M. J. E. Smoothing and differentiation of data by simplified least squares procedures. Analytical Chemistry, v. 36, n. 8, p. 1627-1639, 1964.
- SAUR, E.; NAMBIAR, E. K. S.; FIFE, D. N. Foliar nutrient retranslocation in Eucalyptus globulus Tree Physiology, v. 20, n. 16, p. 1105-1112, 2000.
- SCHLEMMER, M.; GITELSON, A.; SCHEPERS, J.; FERGUSON, R.; PENG, Y.; SHANAHAN, J.; RUNDQUIST, D. Remote estimation of nitrogen and chlorophyll concentrations in maize at leaf and canopy levels. International Journal of Applied Earth Observation and Geoinformation, v. 25, p. 47-54, 2013.
- SIEGBAHN, P. E. M.; CRABTREE, R. H. Manganese oxyl radical intermediates and O-O bond formation in photosynthetic oxygen evolution and a proposed role for the calcium cofactor in photosystem II. Journal of American Chemical Society, v. 121, n. 1, p. 117-127, 1999.
- SILVERMAN, B. W. Density estimation for statistics and data analysis. Chapman and Hall,1986.
- STEIN, B. R.; THOMAS, V. A.; LORENTZ, L. J.; STRAHM, B. D. Predicting macronutrient concentrations from loblolly pine leaf reflectance across local and regional scales. GIScience &. Remote Sensing, v. 51, p. 269-287, 2014.
- STROPPIANA, D.; BOSCHETTI, M.; BRIVIO, P. A.; BOCCHI, S. Plant nitrogen concentration in paddy rice from field canopy hyperspectral radiometry. Field Crops Research , v. 111, p. 119-129, 2009.
- USTIN, S. L.; GITELSON, A. A.; JACQUEMOUD, S.; SCHAEPMAN, M.; ASNER, G. P.; GAMON, J. A.; ZARCO-TEJADA, P. Retrieval of foliar information about plant pigment systems from high resolution spectroscopy. Remote Sensing of Environment , v. 113, p. 567-577, 2009.
- WANG, J.; WANG, T.; SHI, T.; WU, G.; SKIDMORE, A. K. A wavelet-based area parameter for indirectly estimating copper concentration in Carex leaves from canopy reflectance. Remote Sensing, v. 7, p. 15340-15360, 2015.
HIGHLIGHTS
-
Optimal wavelengths related to nutrient concentrations were identified.
-
Nutrient indices were developed to predict leaf nutrient concentrations.
-
Nutrient concentration in Eucalyptus were predicted by spectral indices.
-
Quantitative models between spectra and nutrient concentrations were established.
Publication Dates
-
Publication in this collection
09 Sept 2019 -
Date of issue
Apr-Jun 2019
History
-
Received
15 Mar 2019 -
Accepted
02 June 2019


