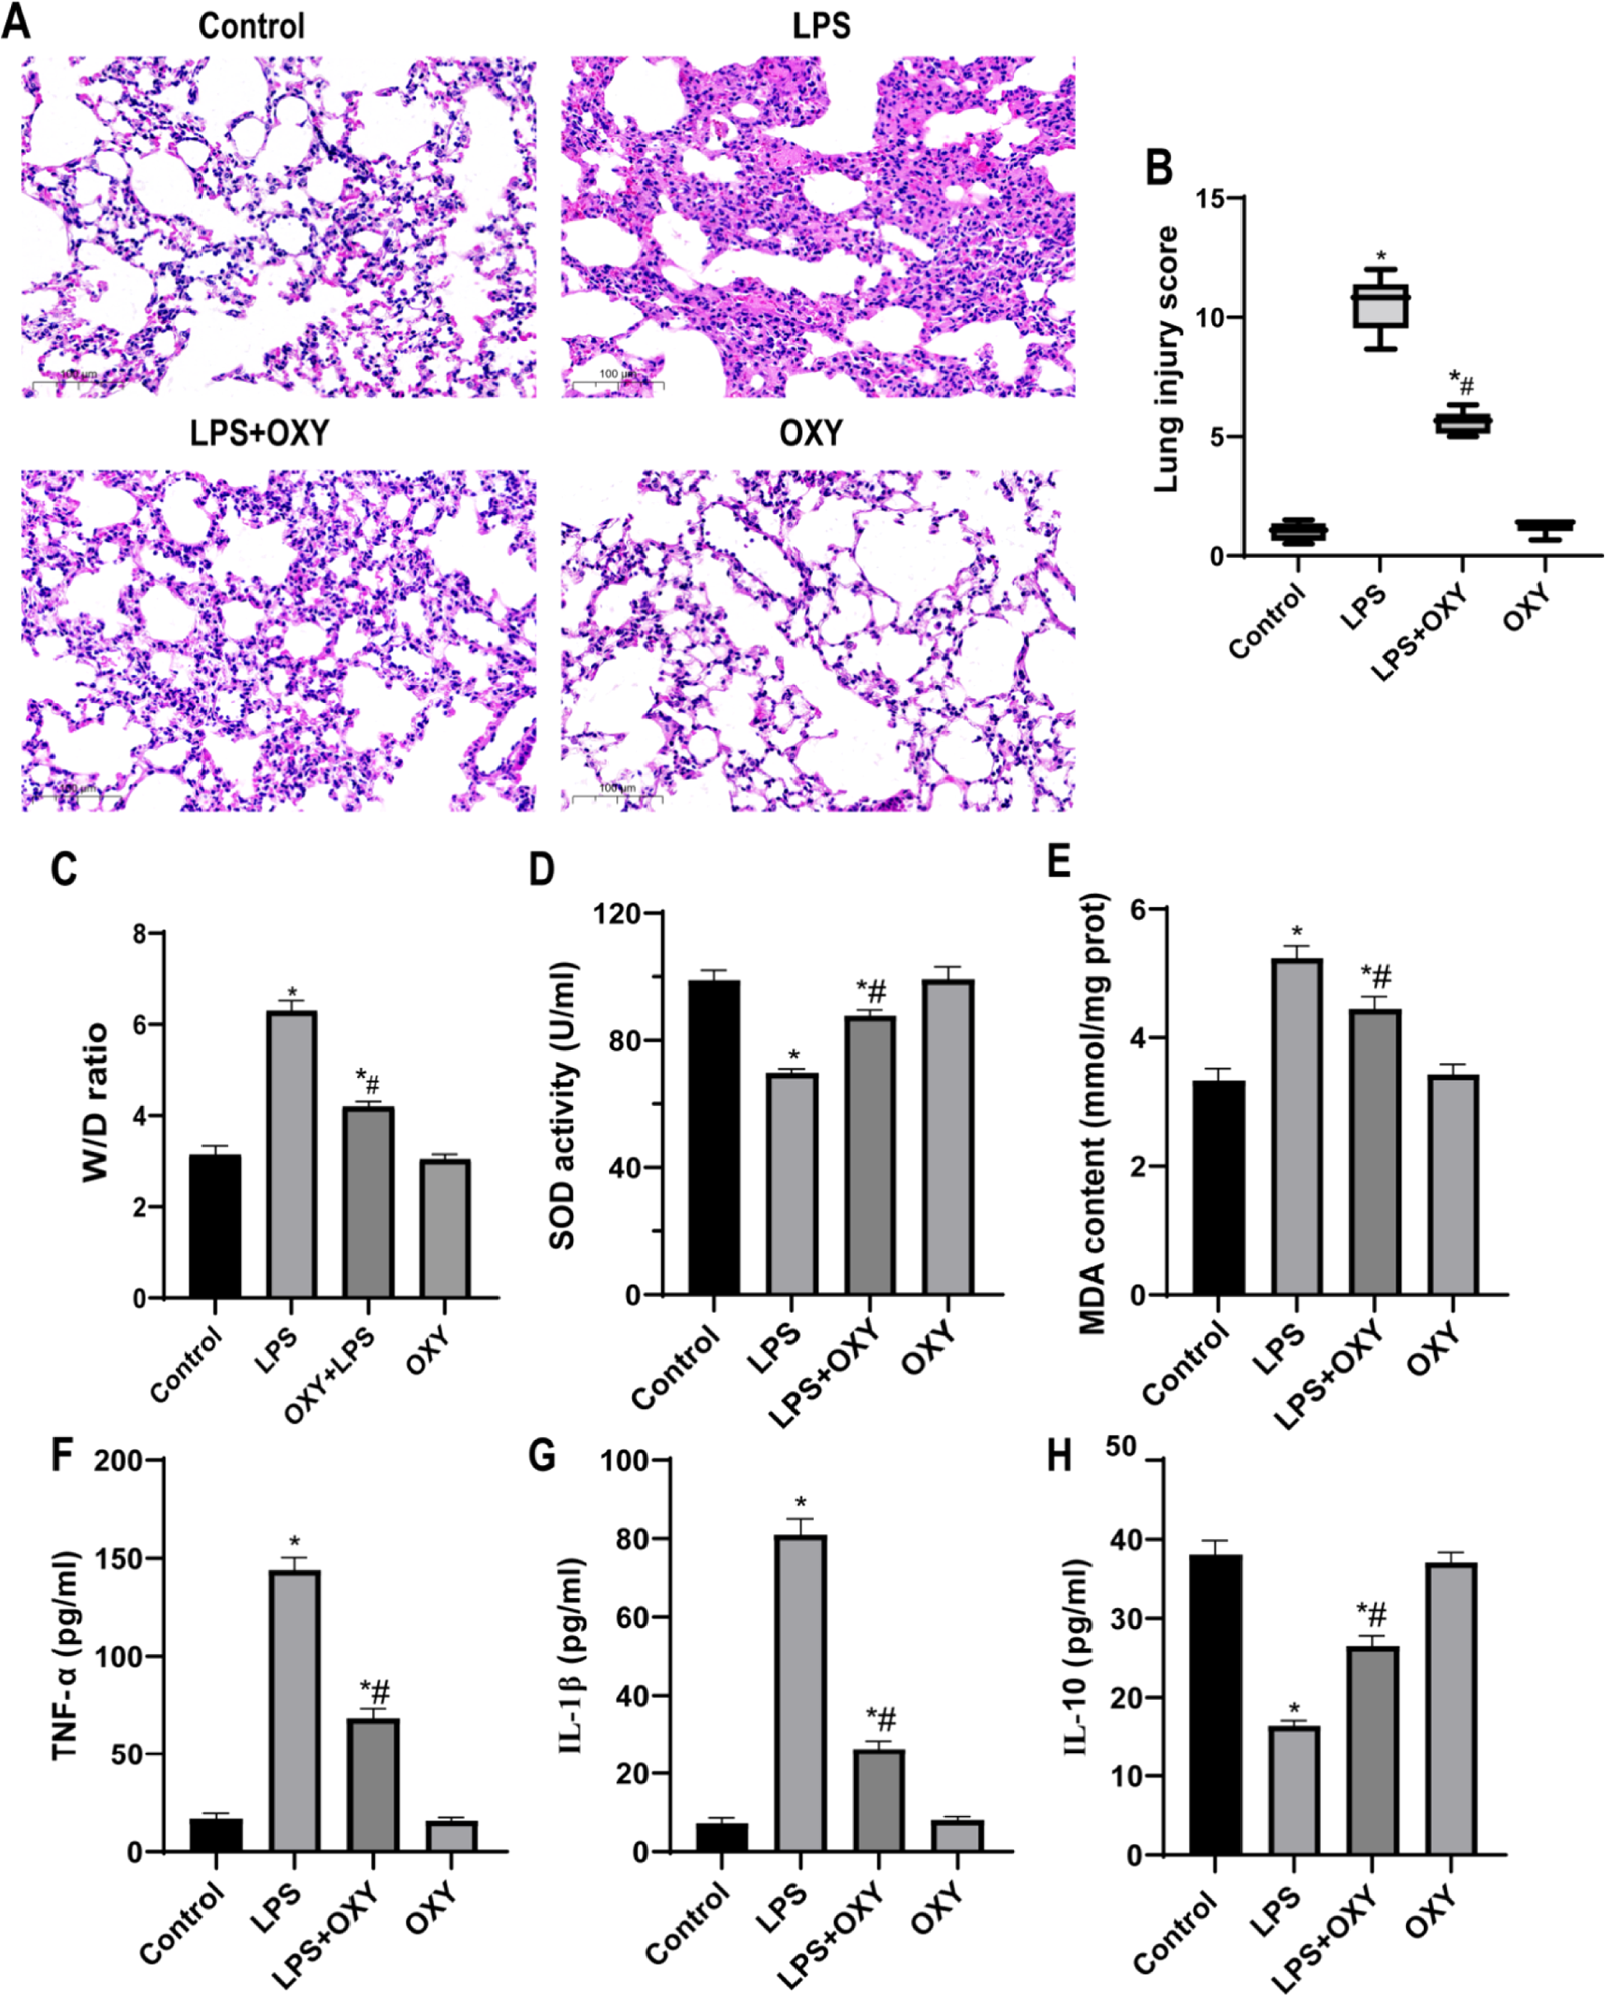
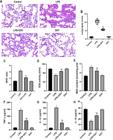
Fig. 1
Oxycodone alleviated LPS-driven lung pathologiccal injury and oxidative stress in mice. (A) The histopathologic changes of lung sections stained with HE in control group, OXY group, LPS group and OXY + LPS group (original magnification, ×200), scale bar: 100 μm. (B) Lung injury scores evaluated by two blinded pathologists. Values are expressed by medians (range) using the Mann-Whitney U test. (C) The lung Wet/Dry (W/D) weight ratio. (D‒E) Quantitative determination of MDA and SOD concentrations. (F‒H) The serum levels of inflammatory cytokines TNF-α and IL-1β, and anti-inflammatory cytokine IL-10 levels were detected by ELISA. Date in C-H bar graph were represented as mean ± SEM using one-way ANOVA and Bonferroni test (n = 6). * p < 0.05, vs. Control group; # p < 0.05, vs. LPS group. Abbreviations: LPS, Lipopolysaccharide; HE, Hematoxylin and Eosin; ALI, Acute Lung Injury; MDA, Malondial-Dehyde; SOD, Superoxide Dismutase; TNF-α, Tumor Necrosis Factor-α; IL-1β, Interleukin-1β; IL-10, Interleukin-10; SEM, Standard Error of the Mean; OXY, Oxycodone; ANOVA, Analysis of Variance; ELISA, Enzyme-Linked Immunosorbent Assay.
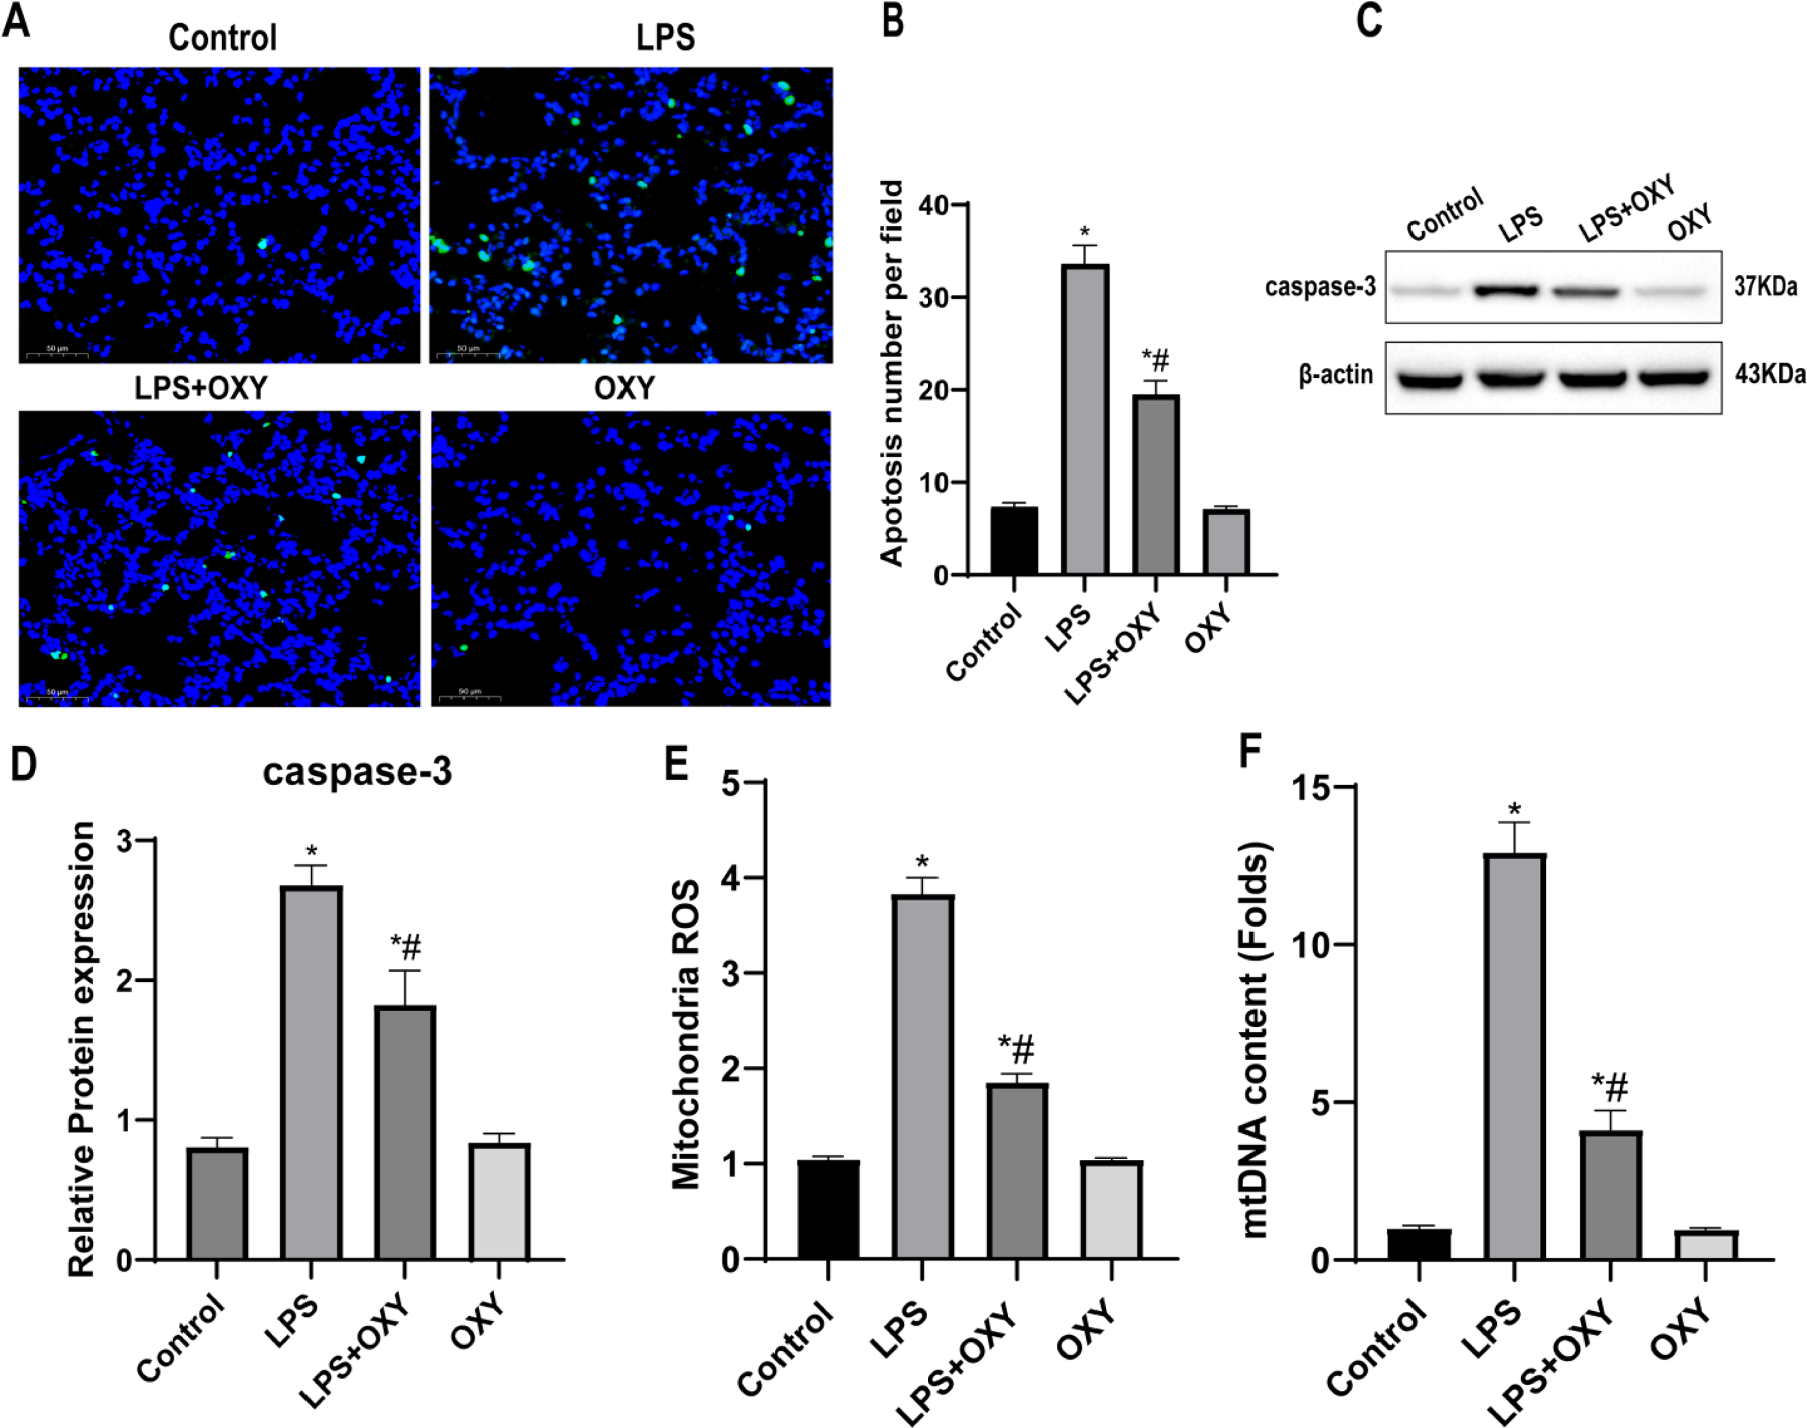
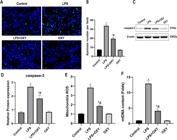
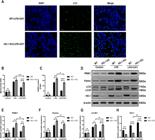
Fig. 2
Oxycodone reduces cell apoptosis and mitochondrial injury in mice. (A) TUNEL staining for cell apoptosis in lung tissues. (B) Apoptosis cell number per field. The number of TUNEL-positive cells was observed by a blinded pathologist (original magnification, ×400). Scale bar: 50 μm. (C‒D) Representative western blot band and quantification to assess the expression of caspase-3 in the lung tissues (n = 3). Β-actin served as a standard for protein loading. (E) Mitochondrial ROS production was detected spectro-fluorometrically using DCFH-DA as a fluorescent dye. (F) The mtDNA content determined by real-time PCR. Date are presented as mean ± SEM using one-way ANOVA and Bonferroni test (n = 6). * p < 0.05, vs. Control group; # p < 0.05, vs. LPS group. Abbreviations: ANOVA, Analysis of Variance; TUNEL, TdT-mediated dUTP Nick-End Labeling; ROS, Reactive Oxygen Species; DCFH-DA, 2’,7’-Dichlorofluorescein Diacetate; mtDNA, Mitochondrial DNA; SEM, Standard Error of the Mean.
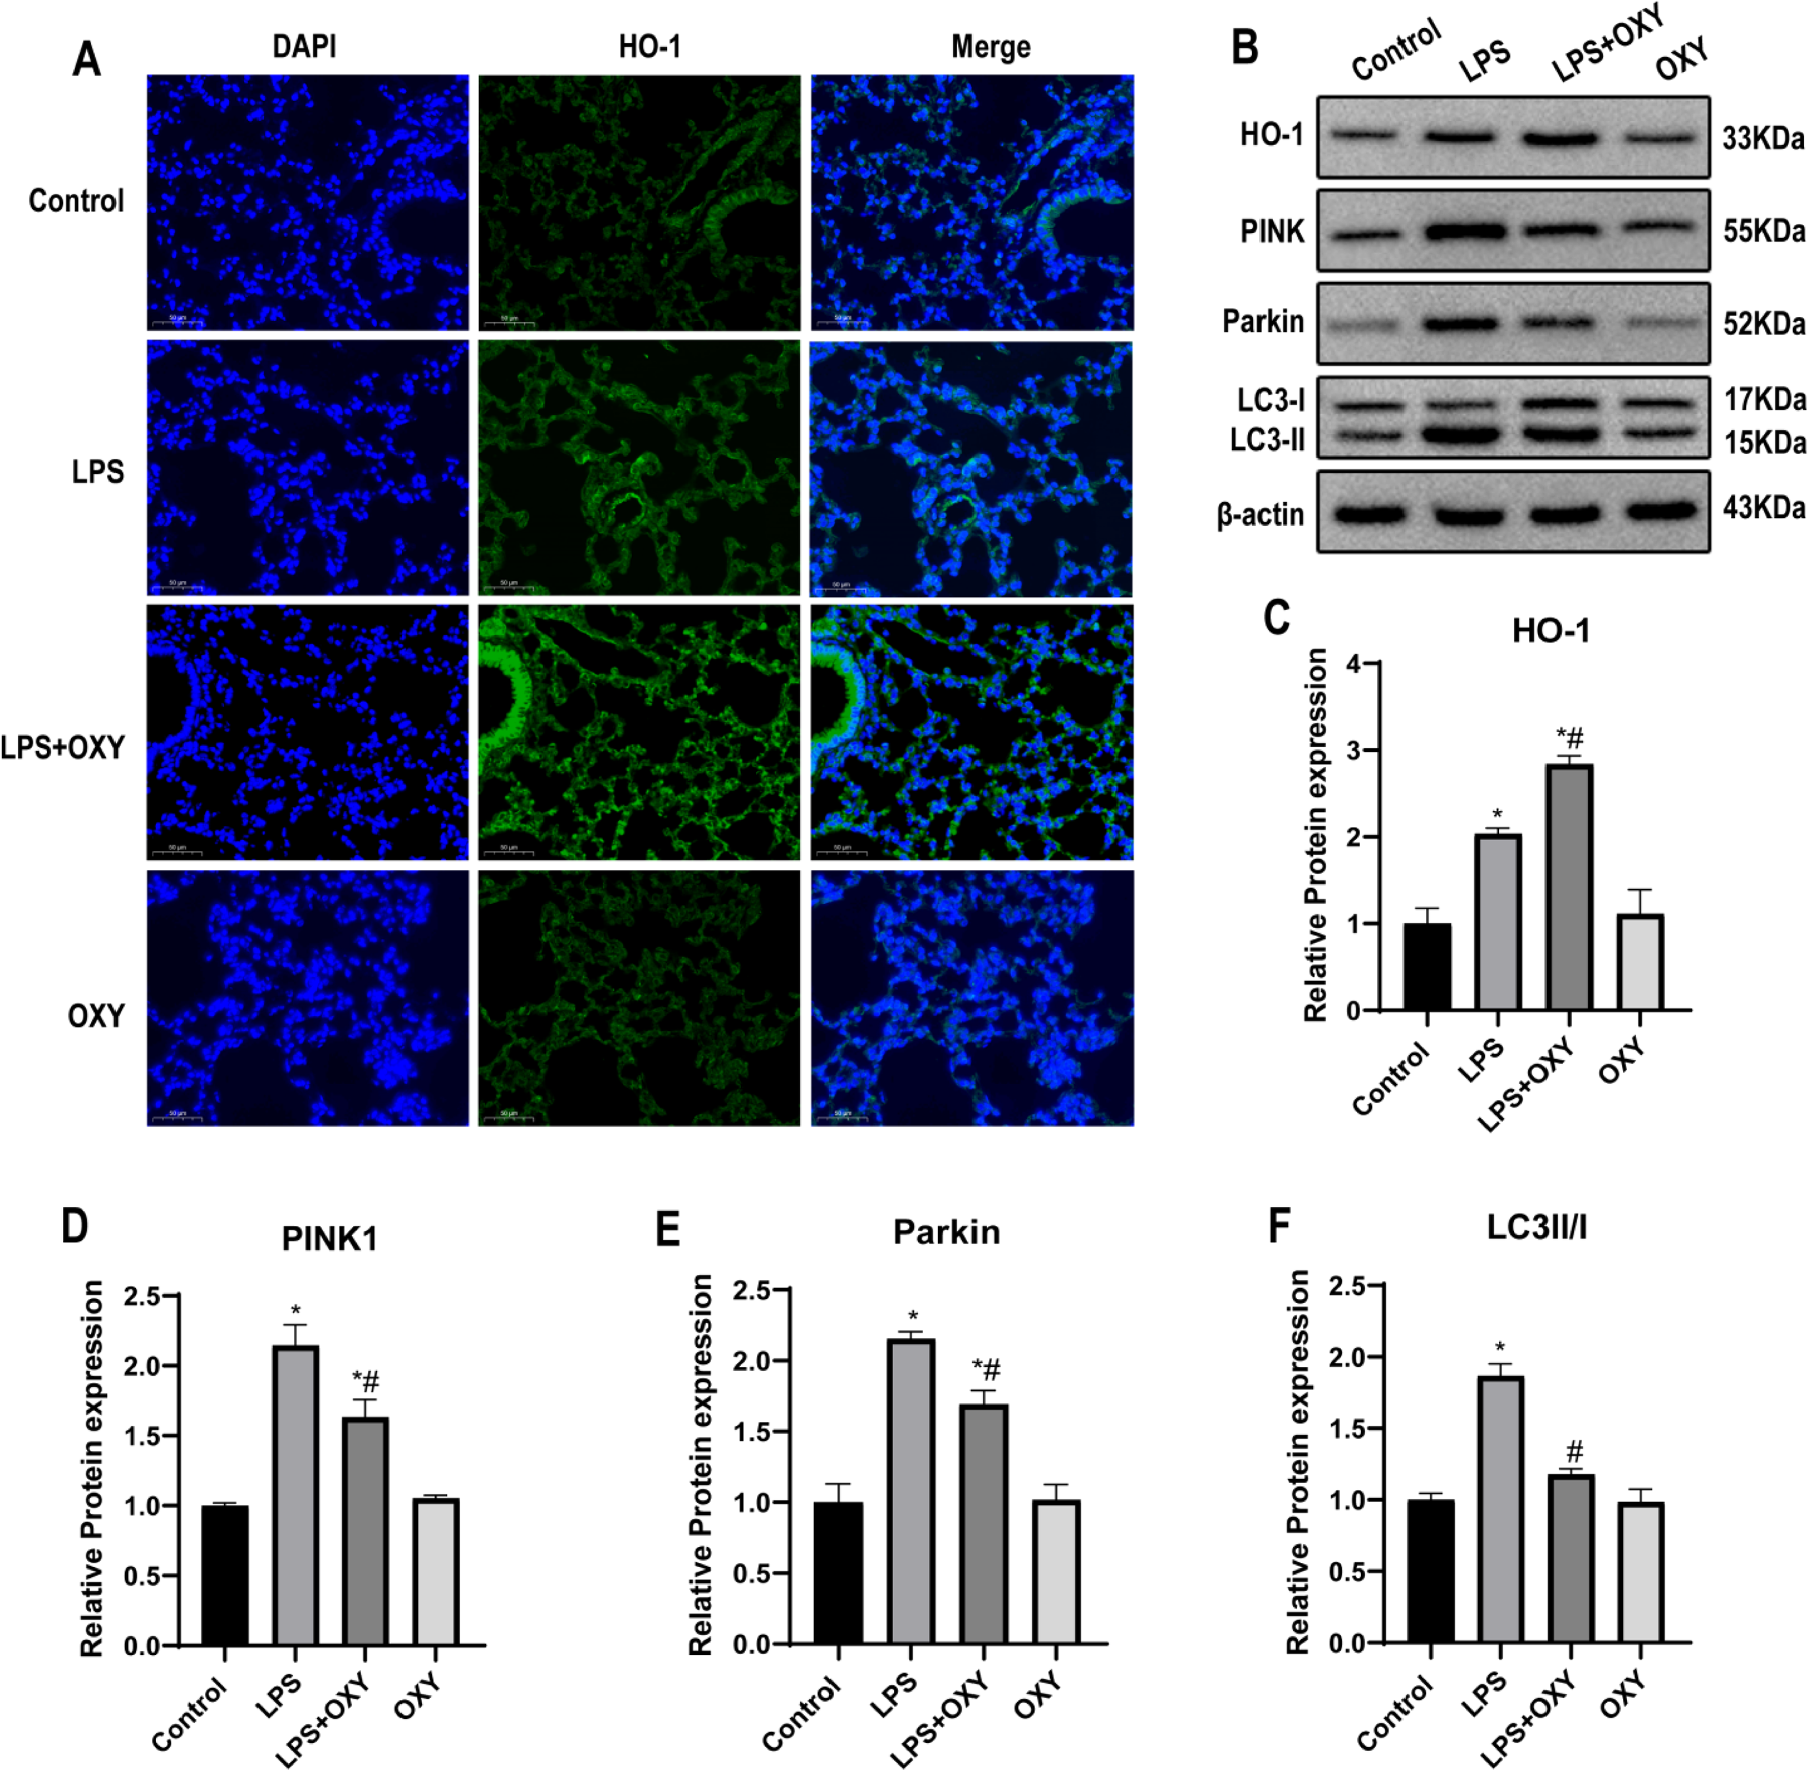
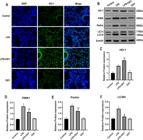
Fig. 3
Oxycodone pre-treatment mitigated mitophagy and activated the expression of HO-1 in LPS-stimulated lung tissue of mice. (A) Immune-fluorescence staining of HO-1 (green) and DAPI (blue) in the four groups by fluorescence microscopy (original magnification, ×400). Scale bar: 50 μm. (B‒F) Representative western blot bands and quantification to assess the expression of mitophagy-related proteins (PINK1, Parkin, and LC3) and HO-1 in the lung tissues (n = 3). Β-actin served as a standard for protein loading. Values are expressed as mean ± SEM using one-way ANOVA corrected with Bonferroni test for multiple comparisons. * p < 0.05, vs. Control group; # p < 0.05, vs. LPS group. Abbreviations: ANOVA, Analysis of Variance; DAPI, 6-Diamino-2-Phenylindole; LC3, Microtuble-associated protein Light Chain-3; HO-1, Heme Oxygenase-1; PINK1, PTEN Induced Putative Kinase-1; SEM, Standard Error of the Mean.
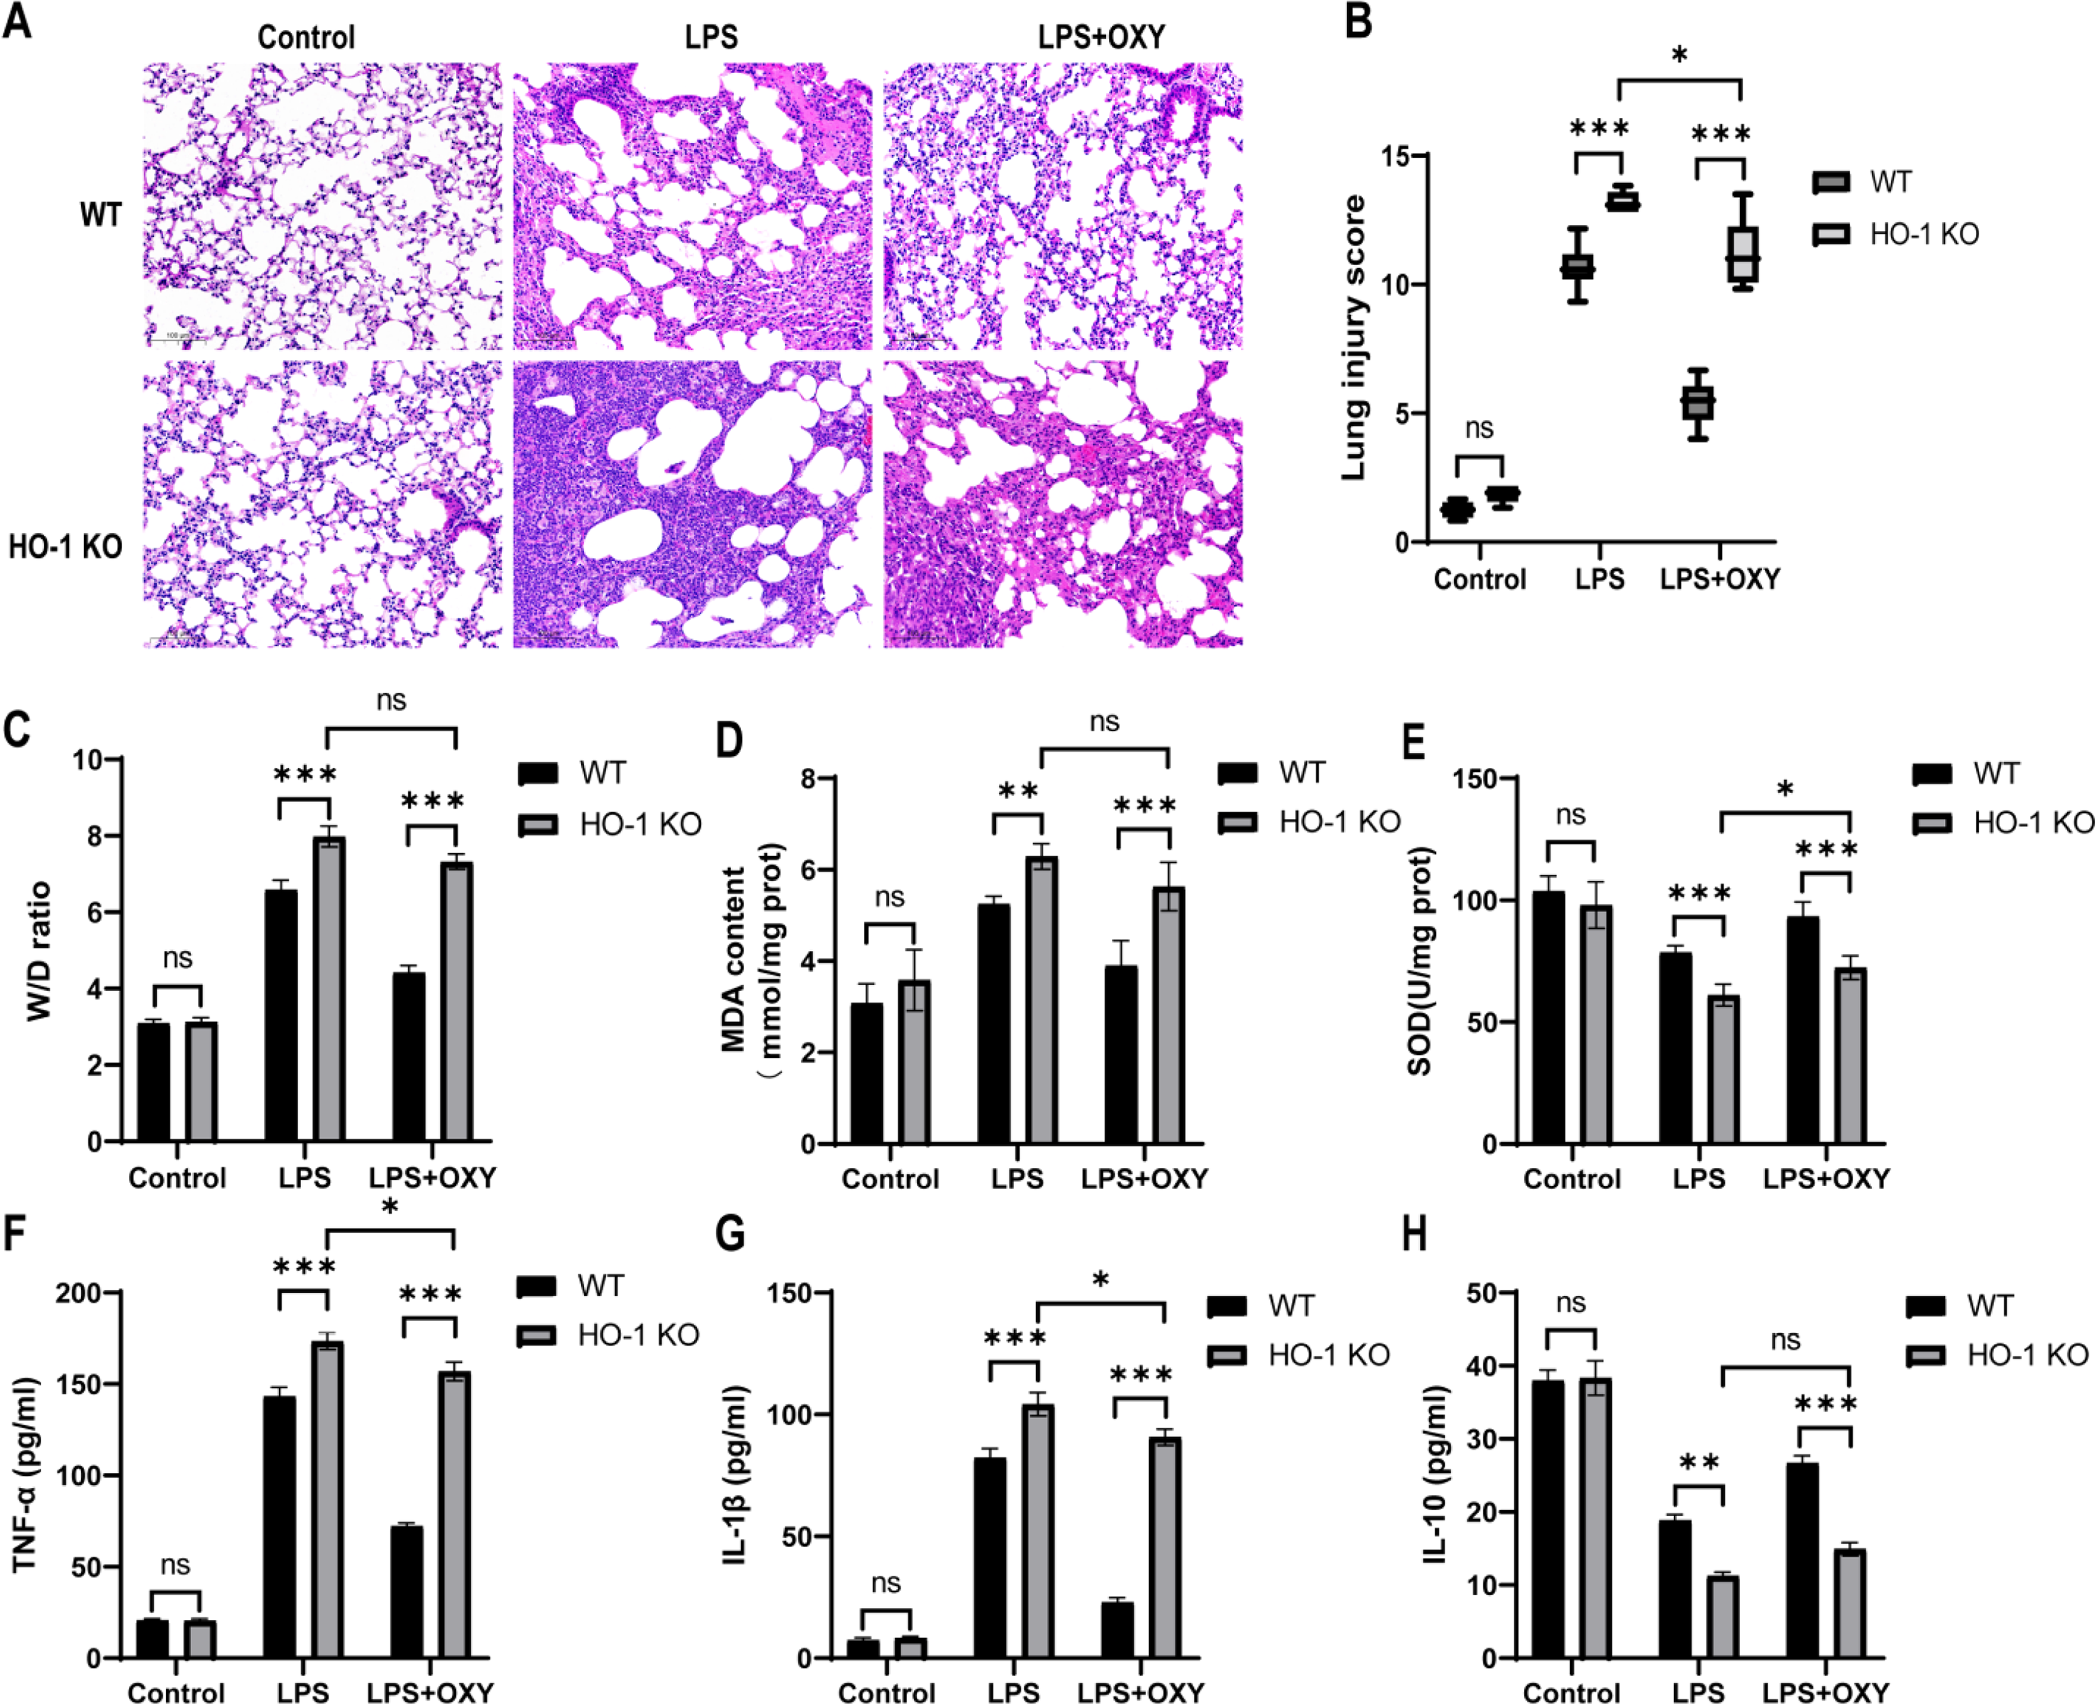
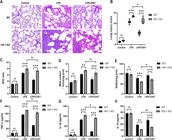
Fig. 4
Knockout of HO-1 weaken the protective effect of oxycodone on LPS-induced ALI in vivo. (A) The representative images of histopathologic changes in lung sections with HE staining (original magnification, ×200), scale bar: 100 μm. (B) Lung injury scores determined by two blinded pathologists. (C) The lung Wet/Dry (W/D) weight ratio. (D‒E) Quantitative determination of MDA and SOD concentrations of the six groups. (F‒H) Serum levels of inflammatory cytokines TNF-α and IL-1β and anti-inflammatory cytokine IL-10 detected by ELISA. The date in B are expressed by medians (range) using the Mann-Whitney U test. Date C-H are presented as mean ± SEM using two-way ANOVA and Bonferroni test (n = 6). Ns, No statistical difference, * p < 0.05, ** p < 0.01, *** p < 0.001. TNF-α, Tumor Necrosis Factor-α; IL-1β, Interleukin-1β; IL-10, Interleukin-10.
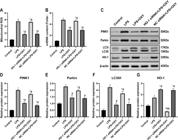
Fig. 5
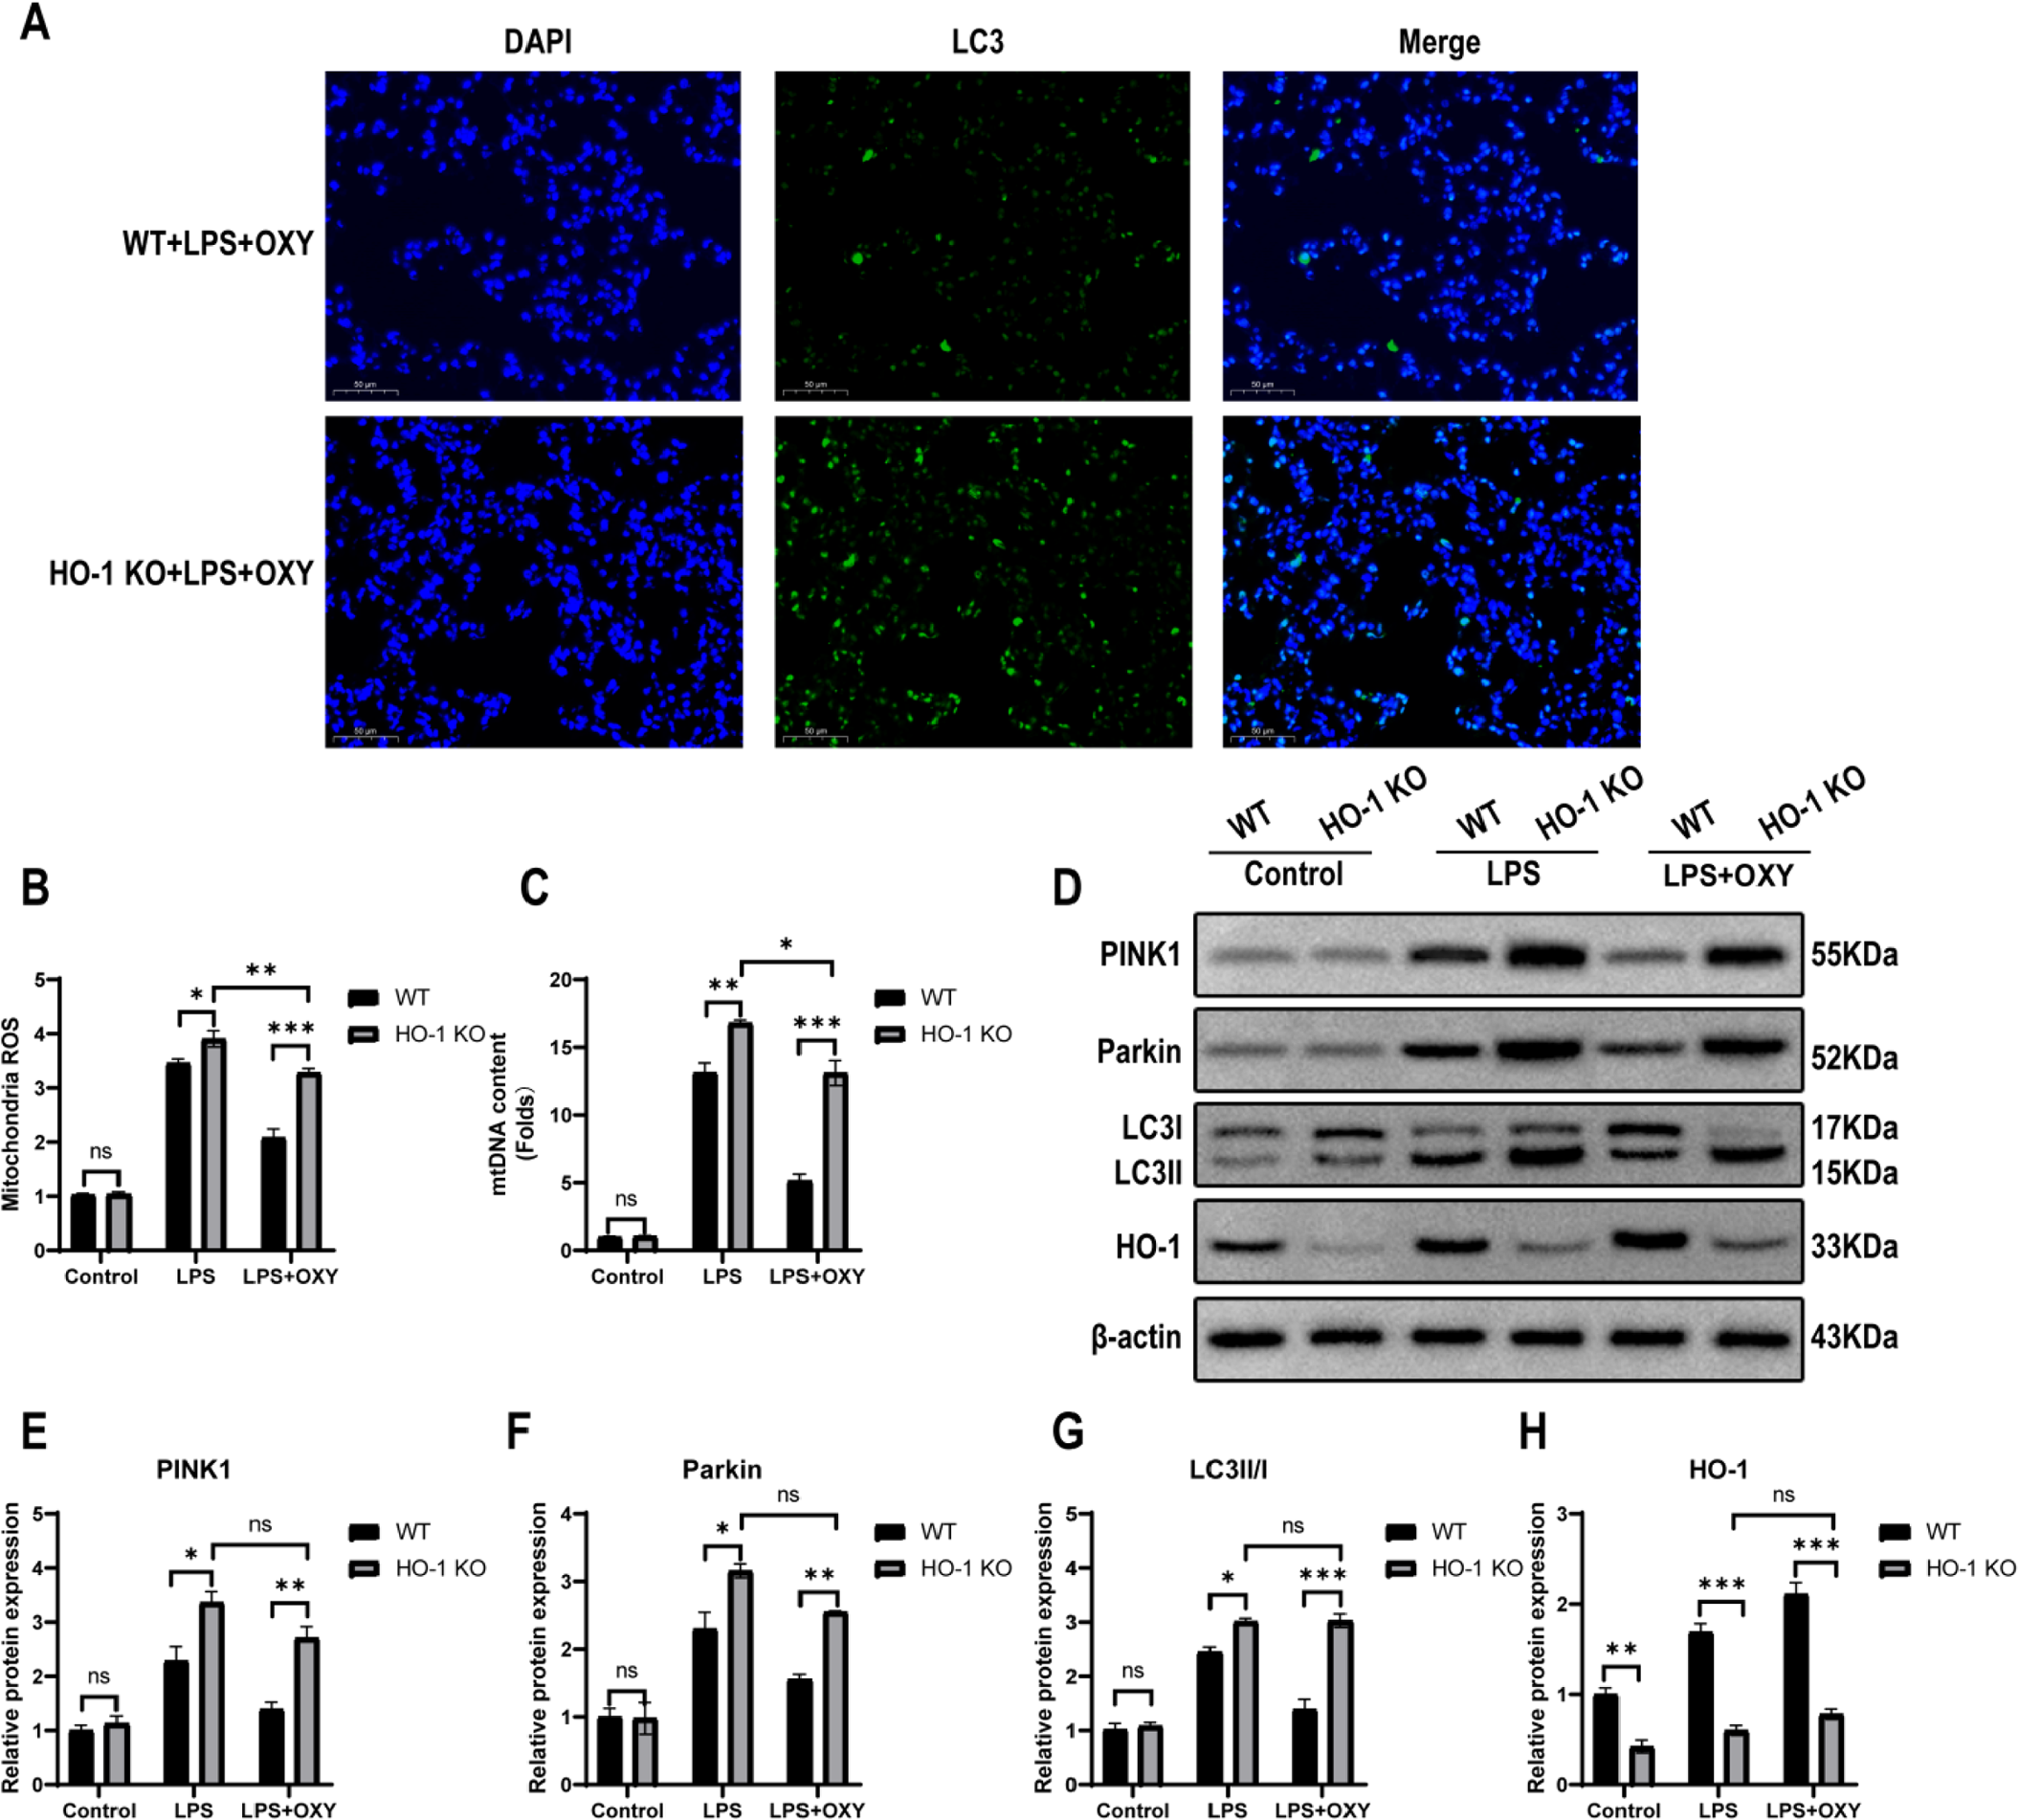
Knockout of HO-1 inhibited the effect of oxycodone on attenuating mitophagy during ALI after LPS challenge in mice. (A) Immunofluorescence assays of LC3 protein in lung tissue by fluorescence microscope (original magnification, ×400). Scale bar: 50 μm. LC3 and DAPI was stained with green and blue respectively. (B) Mitochondrial ROS production was detected by fluorescence spectroscopy with DCFH-DA. (C) The mtDNA content was deteceted by real time PCR. (D‒H) Representative western blot bands and quantification of mitophagy-related proteins (PINK1, Parkin, and LC3) as well as the HO-1 protein. Date are presented as mean ± SEM using two-way ANOVA and Bonferroni test for multiple comparisons (n = 3). Ns, No statistical difference, * p < 0.05, ** p < 0.01, *** p < 0.001. Abbreviations: ANOVA, Analysis of Variance; HO-1, Heme Oxygenase-1; ALI, Acute Lung Injury; ROS, Reactive Oxygen Species; DCFH-DA, 2’,7’-Dichlorofluorescein Diacetate; PINK1, PTEN Induced Putative Kinase-1; mtDNA, Mitochondrial DNA; SEM, Standard Error of the Mean; LPS, Lipopolysaccharide; OXY, Oxycodone.
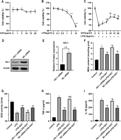
Fig. 6
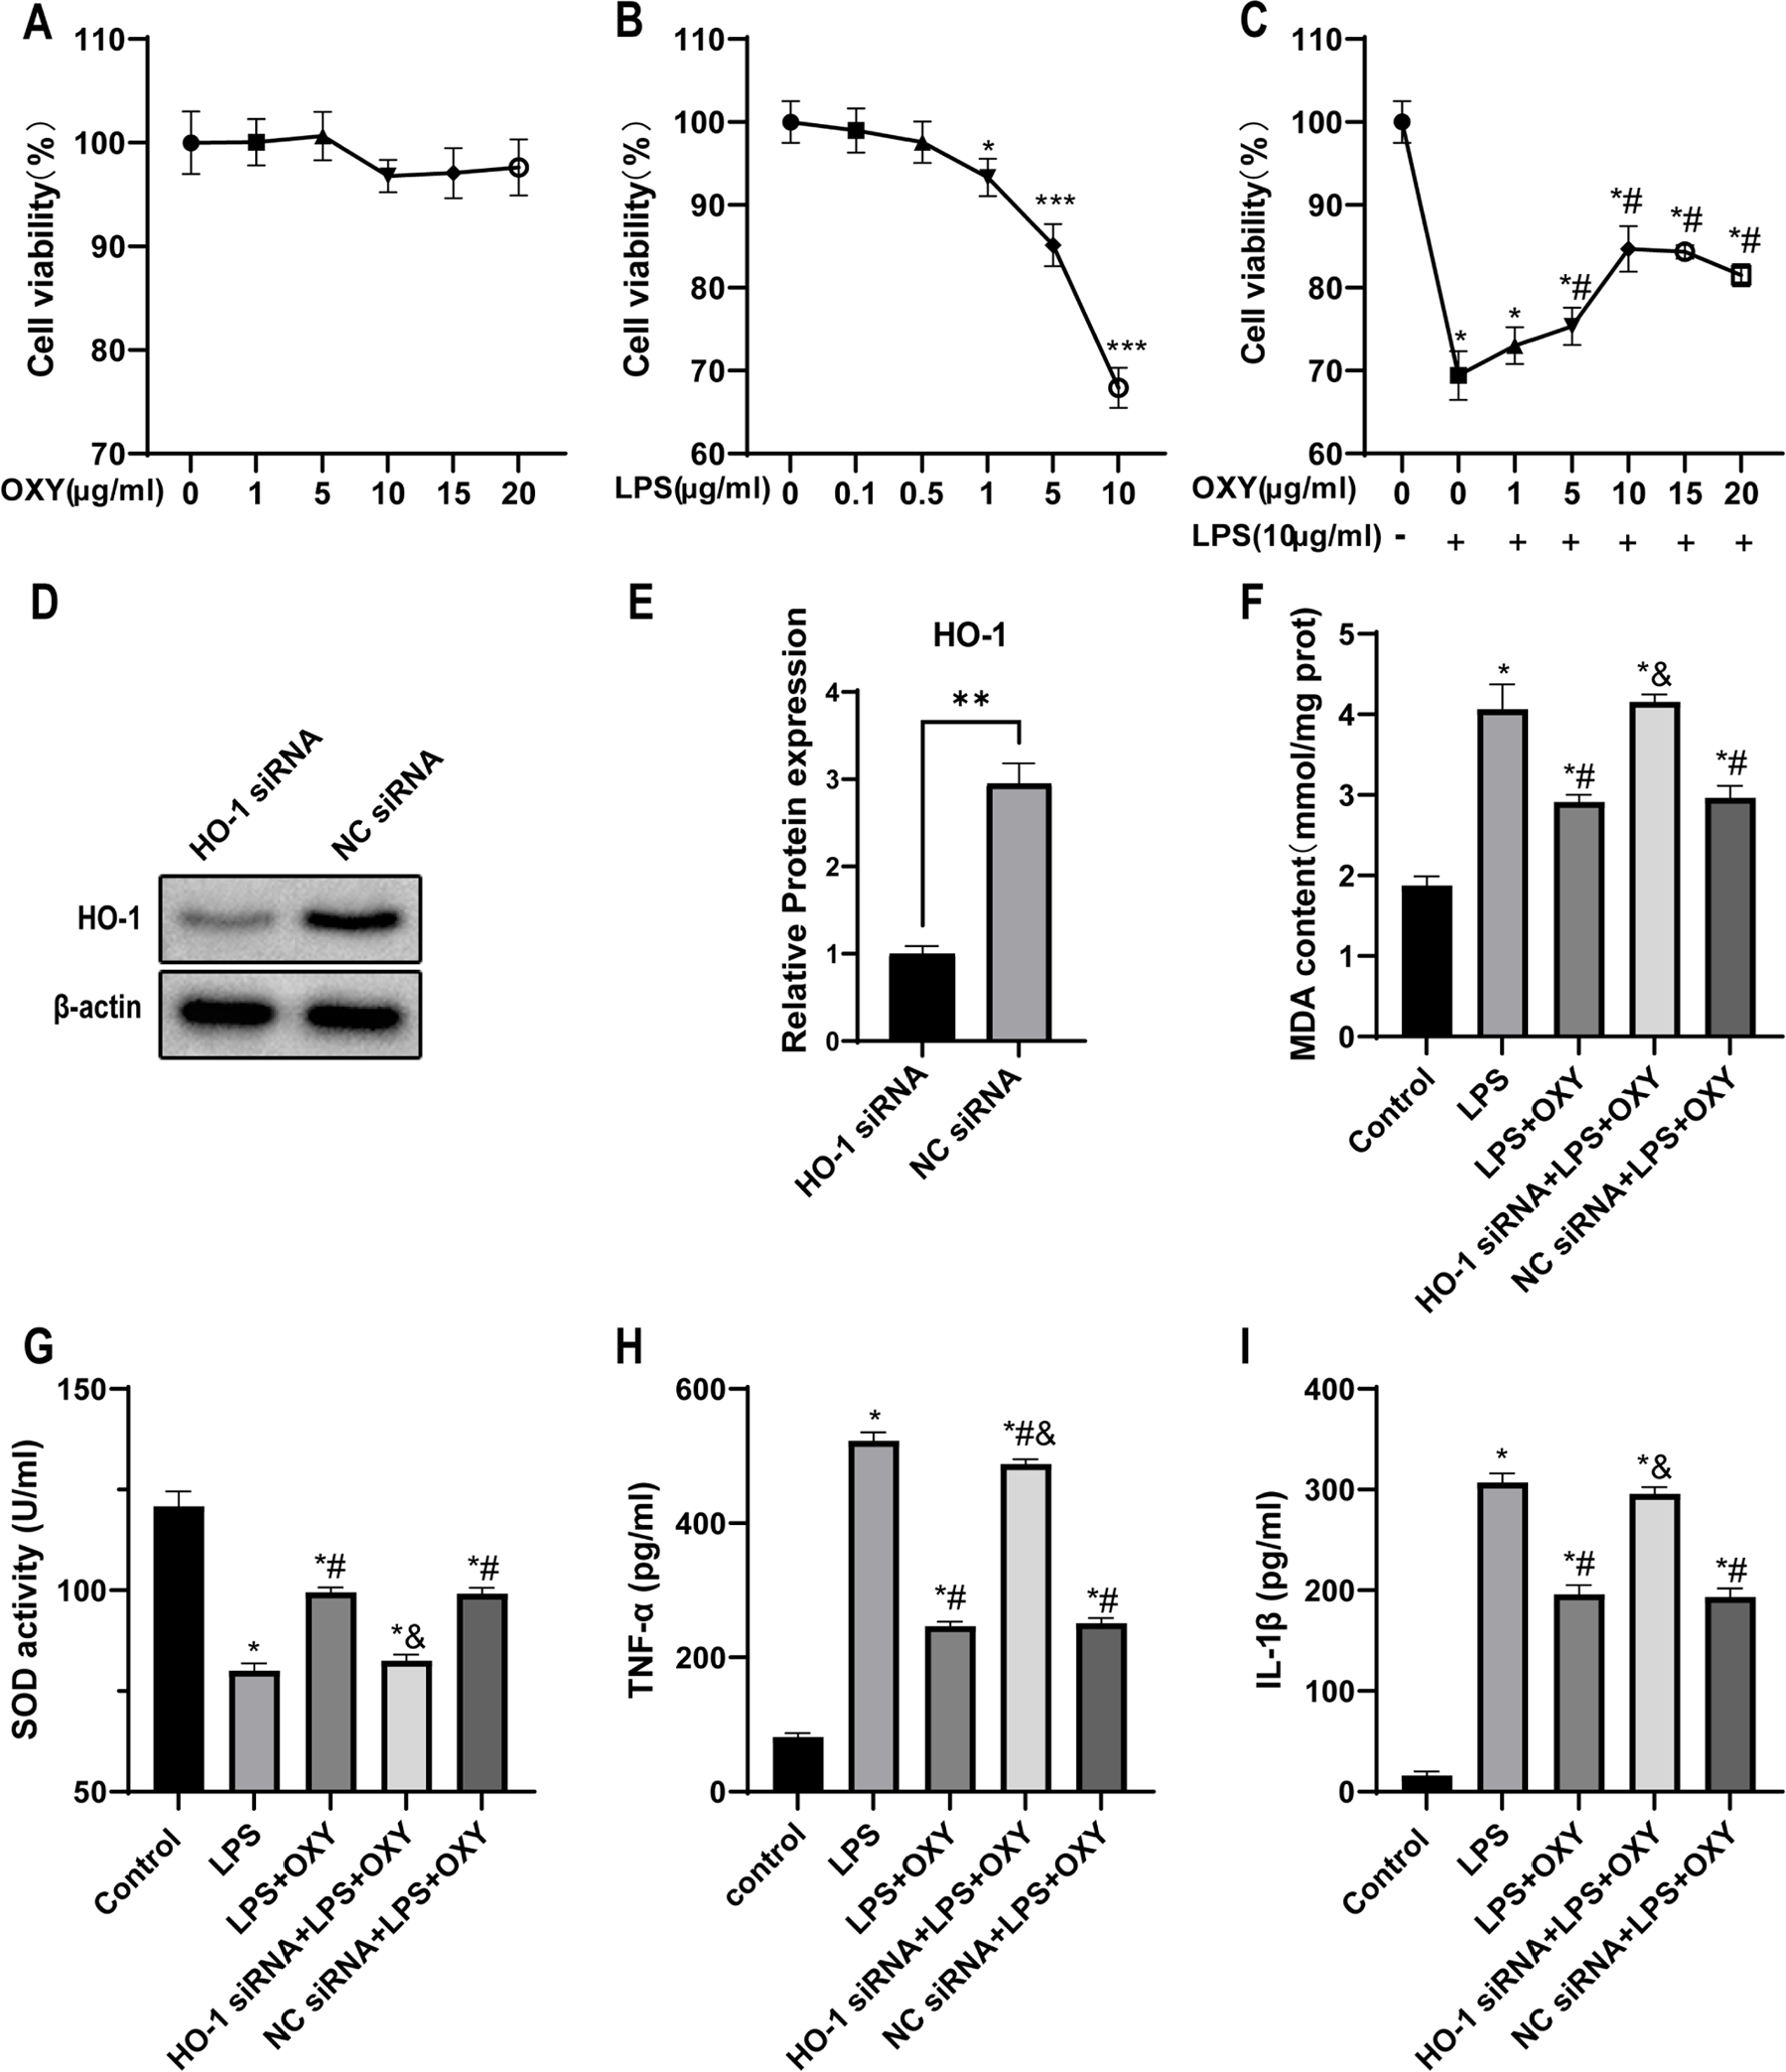
HO-1 knockdown neutralized the effects of oxycodone in alleviating LPS-induced inflammation and oxidative injury in vitro. (A) The viability of oxycodone-treated MLE12 cells was measured by MTT assays. (B) Cell viability treated with different concentrations of LPS for 24h, and was determined by MTT assays. *p < 0.05, vs. LPS = 0 group; ** p < 0.01, vs. LPS = 0 group; *** p < 0.001, vs. LPS = 0 group. (C) Viability of MLE12 cells cultivated with different concentrations of oxycodone before LPS treatment was determined by MTT assays. * p < 0.05, vs. OXY = O and LPS = 0 group; # p < 0.05, vs. OXY = O and LPS = 10 μg/mL group. (D‒E) The western blot image and quantification of HO-1 protein in MLE12 cells transfected with HO-1 siRNA and negative control siRNA (NC siRNA). ** p < 0.01. (F‒G) Levels of MDA and SOD in the five groups. (H‒I) Levels of inflammatory factors TNF-α and IL-1β in the cell supernatant. The date of F‒I were expressed as mean ± SEM using one-way ANOVA and Bonferroni test for multiple comparisons (n = 6). * p < 0.05, vs. Control group; # p < 0.05, vs. LPS group; & p < 0.05, vs. LPS + OXY group.
Fig. 7
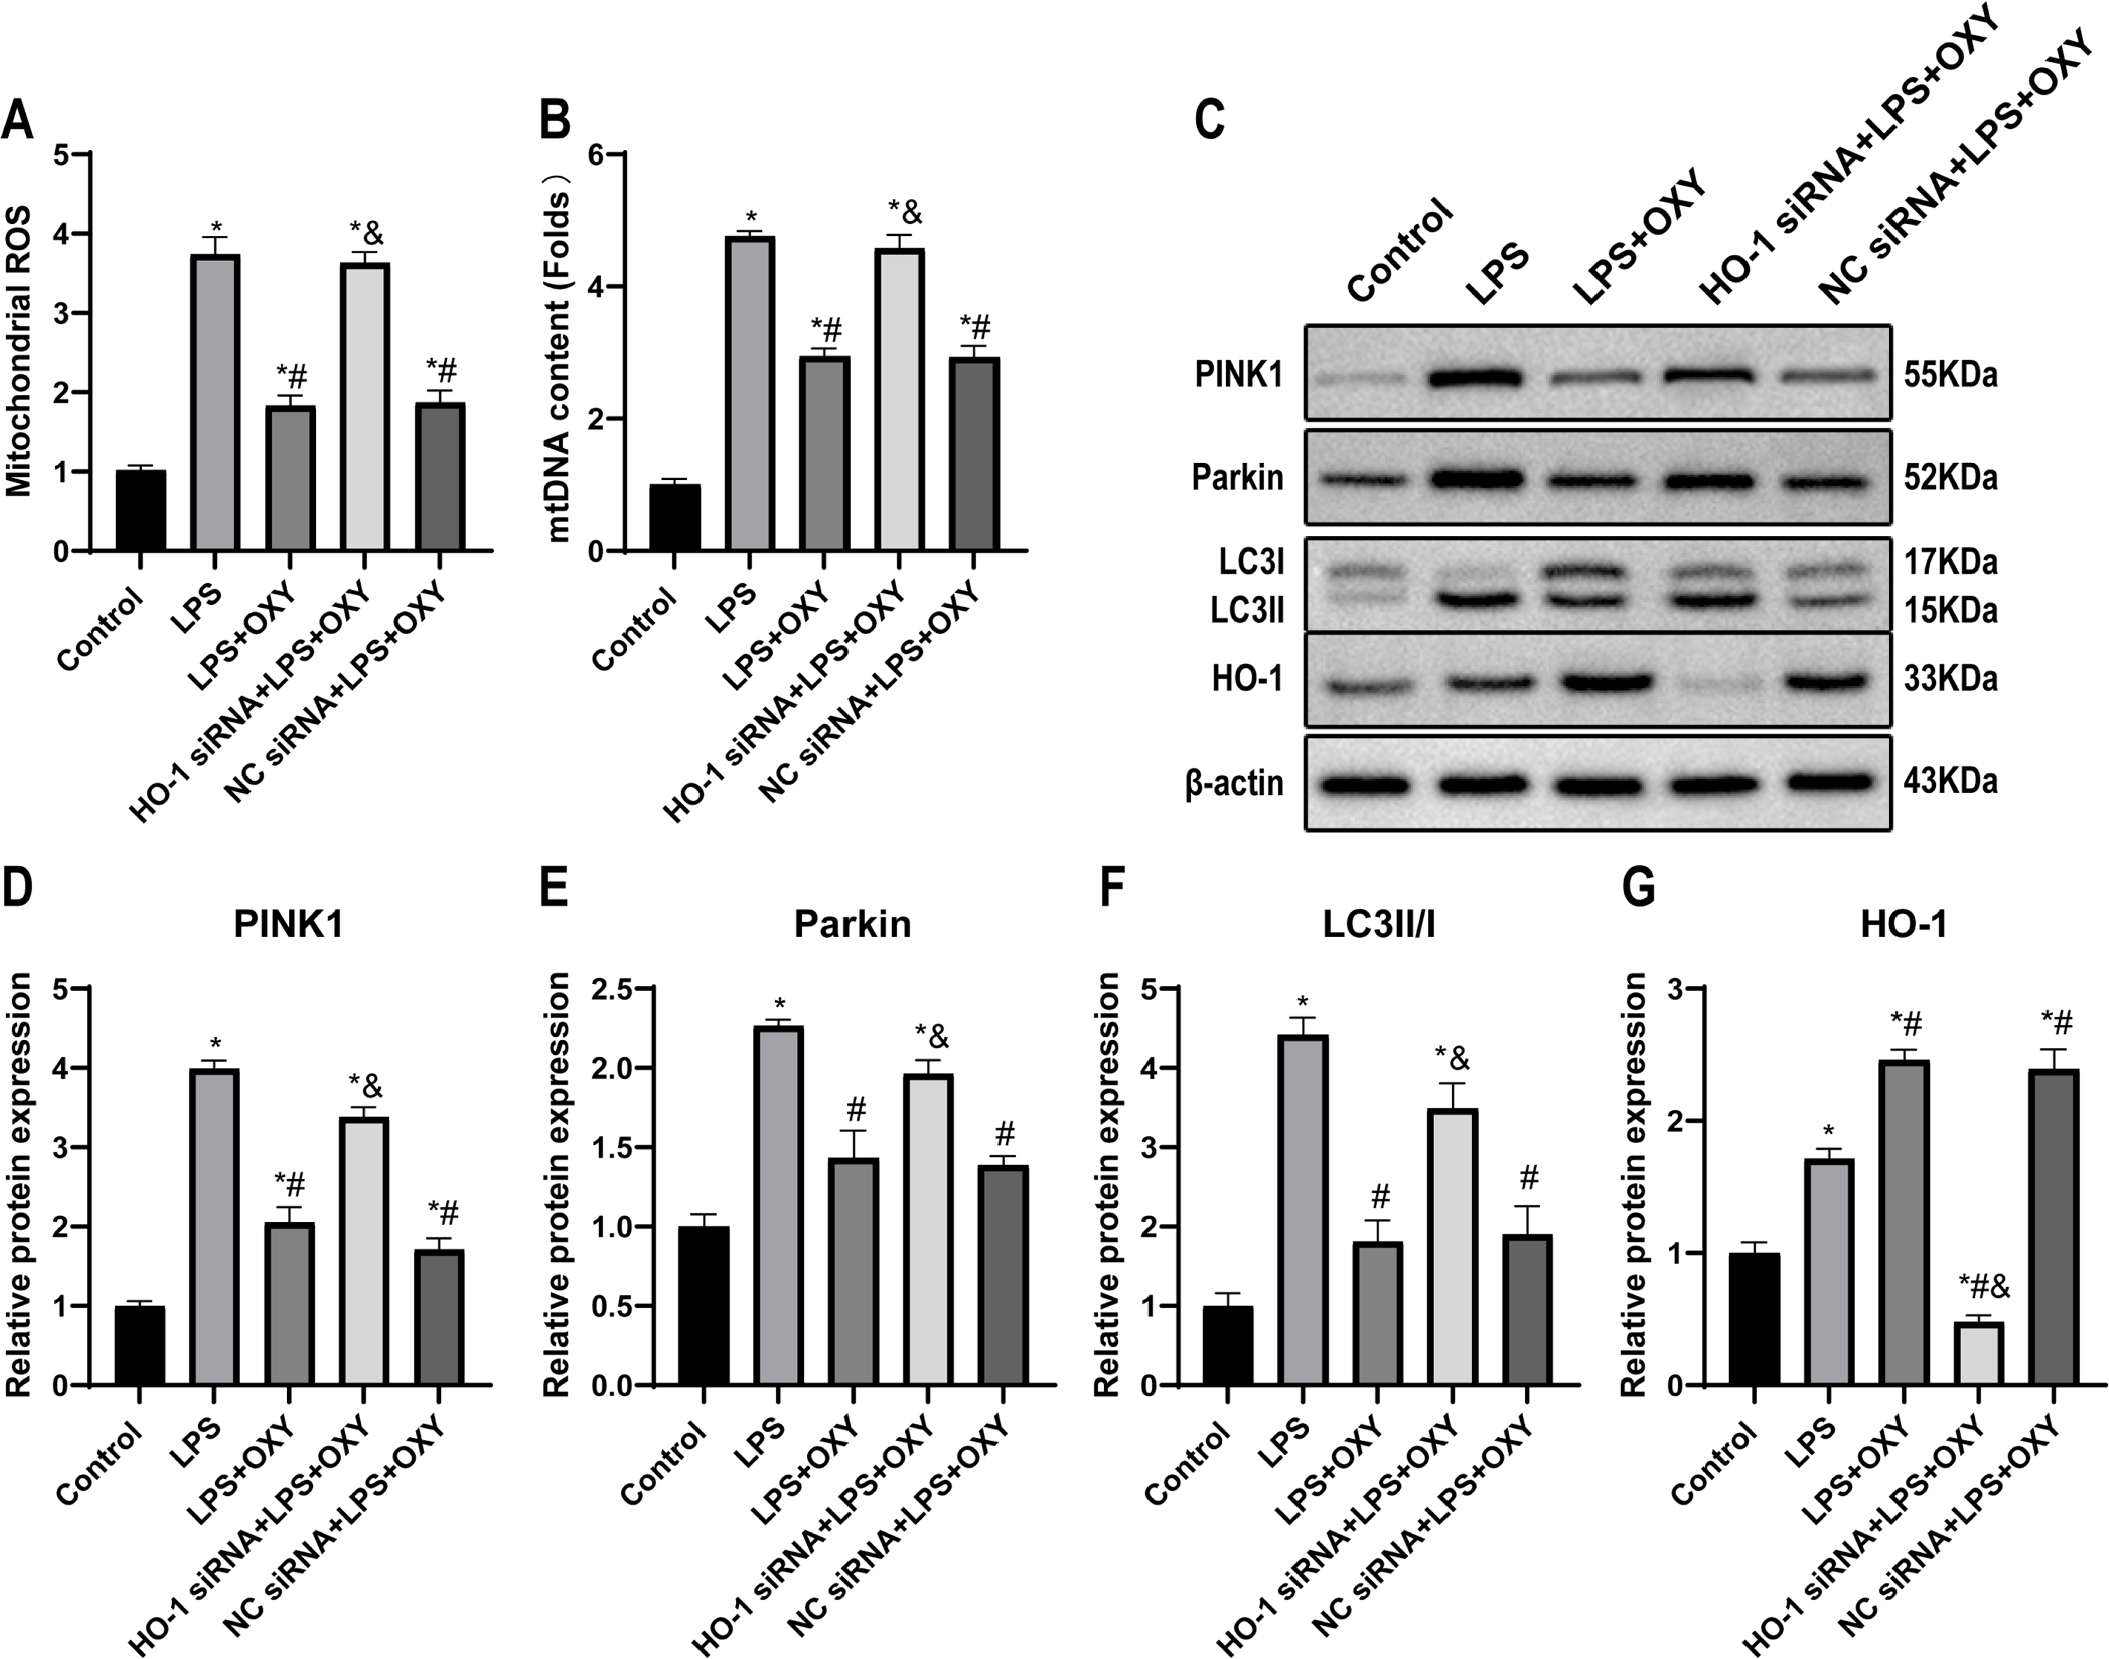
Oxycodone inhibited LPS-induced MLE12 cells damage by regulating mitophagy through the HO-1 pathway. (A) Mitochondrial ROS production was measured by fluorescence spectroscopy using DCFH-DA as the fluorescent dye. (B) The mtDNA content detected by real time PCR. (C‒G) The representative western blot bands and quantification of mitophagy-related proteins (PINK1, Parkin, and LC3) and pathway-related protein (HO-1). Band intensity analysis of western blotting images was performed using their relative ratios to β-actin. Date were expressed as mean ± SEM using one-way ANOVA and Bonferroni test for multiple comparisons (n = 3). * p < 0.05, vs. Control group; # p < 0.05, vs. LPS group; & p < 0.05, vs. LPS + OXY group. Abbreviations: ANOVA, Analysis of Variance; ROS, reactive oxygen species; DCFH-DA, 2’,7’-Dichlorofluorescein Diacetate; mtDNA, Mitochondrial DNA; PINK1, PTEN induced putative kinase 1; HO-1, Heme Oxygenase-1; KO, Knockout; SEM, Standard Error of the Mean; LPS, Lipopolysaccharide; OXY, Oxycodone.
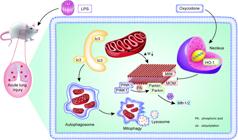
Fig. 8
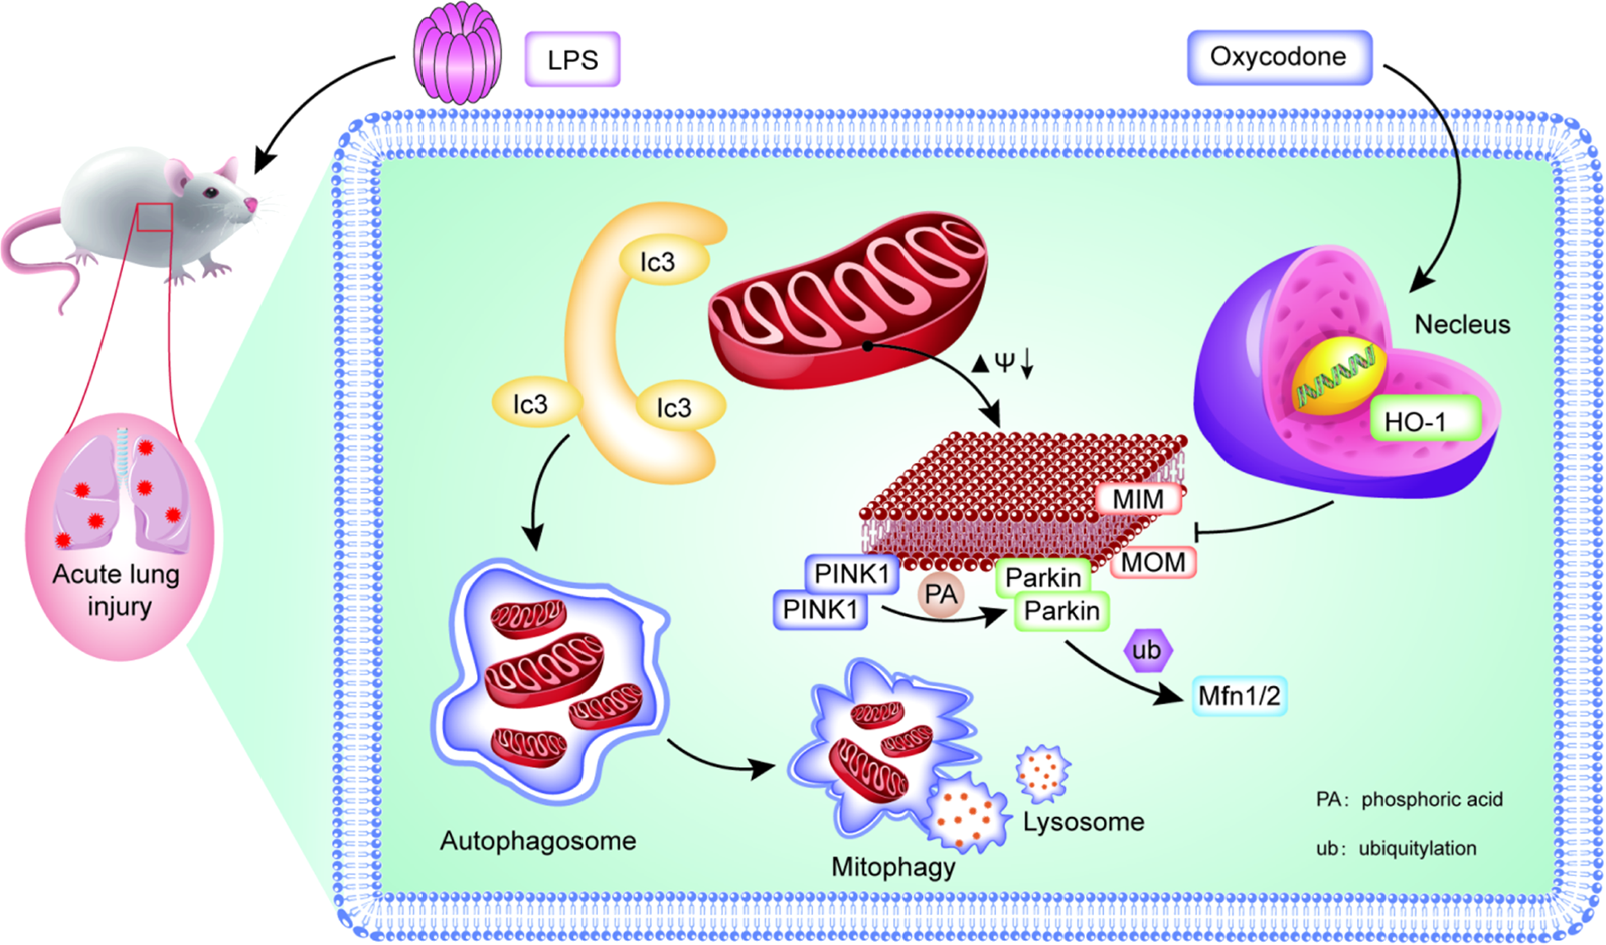
Graphical illustration of oxycodone pretreatment-mediated suppression of mitophagy in LPS-induced ALI or cell damage by regulating the HO-1 pathway. Oxycodone activated the HO-1 pathway when LPS was administered, leading to the response to induce target gene of HO-1 expression. Additionally, pretreatment with oxycodone downregulated the expressions of mitophagy markers PINK1, Parkin, and LC3Ⅱ/Ⅰ. In conclusion, oxycodone pre-treatment alleviates mitophagy in endotoxin-related ALI and cell damage, thus alleviating the inflammation and oxidative stress of lung tissue and cells, ultimately reducing cell death.

 Oxycodone attenuates endotoxin-induced acute lung injury by regulating mitophagy via the HO-1 pathway
 Thumbnail
 Thumbnail
 Thumbnail
 Thumbnail
 Thumbnail
 Thumbnail
 Thumbnail
 Thumbnail