ABSTRACT:
The aim of this study was to determine the optimal plot size for evaluating the fresh weight of black oats (Avena strigosa Schreb) and the common vetch (Vicia sativa L.) in scenarios comprising combinations of the number of treatments, number of replications and levels of precision. Fifteen uniformity trials were conducted with single-crop and intercropped black oats and vetch. Fresh weight was evaluated in 540 basic experimental units (BEU), each of 1 m × 1 m (36 BEU per trial). The Smith index of soil heterogeneity (1938) was estimated. Plot size was determined using the HATHEWAY method (1961), in scenarios comprising combinations of i treatments (i = 5, 10, 15 and 20), r replications (r = 3, 4, 5, 6, 7 and 8) and d levels of precision (d = 2%, 4%, 6%, 8%, 10%, 12%, 14%, 16%, 18% and 20%). To evaluate the fresh weight of monocropped or intercropped black oats and vetch in a completely randomized or randomized complete block design, with from 5 to 20 treatments and five replications, plots of 10 m2 are sufficient to identify, at a probability of 0.05, significant differences between treatments of 10% of the overall mean value of the experiment.
Key words:
Avena strigosa; cover crop; experimental design; uniformity trial; Vicia sativa
RESUMO:
O objetivo deste trabalho foi determinar o tamanho ótimo de parcela para avaliar a massa de matéria fresca de aveia preta (Avena strigosa Schreb) e de ervilhaca (Vicia sativa L.), em cenários formados por combinações de números de tratamentos, números de repetições e níveis de precisão. Foram conduzidos 15 ensaios de uniformidade com aveia preta e ervilhaca, em cultivo solteiro e em consórcio. Foi avaliada a massa de matéria fresca em 540 unidades experimentais básicas (UEB) de 1 m × 1 m (36 UEB por ensaio). Foi estimado o índice de heterogeneidade do solo de SMITH (1938). Foi determinado o tamanho de parcela por meio do método de HATHEWAY (1961) em cenários formados pelas combinações de i tratamentos (i = 5, 10, 15 e 20), r repetições (r = 3, 4, 5, 6, 7 e 8) e d níveis de precisão (d = 2%, 4%, 6%, 8%, 10%, 12%, 14%, 16%, 18% e 20%). Para avaliar a massa de matéria fresca de aveia preta e de ervilhaca, em cultivo solteiro ou em consórcio, nos delineamentos inteiramente casualizado e de blocos completos ao acaso, com 5 a 20 tratamentos e com cinco repetições, parcelas de 10 m2 são suficientes para identificar diferenças significativas entre tratamentos, a 0,05 de probabilidade, de 10% da média geral do experimento.
Palavras-chave:
Avena strigosa; cultura de cobertura de solo; dimensionamento experimental; ensaio de uniformidade; Vicia sativa
INTRODUCTION:
In field experiments with species of winter cover crops, such as black oats (Avena strigosa Schreb) and the common vetch (Vicia sativa L.), it is important to evaluate the fresh weight of the plants, whether grown as single crops or intercropped. Research has shown the importance of monocropping or intercropping in these species. Intercropping resulted in a more-balanced C/N ratio than did monocropping, as well as providing enough crop residue to protect the soil against erosive agents and to supply N to maize (HEINRICHS et al., 2001HEINRICHS, R. Cultivo consorciado de aveia e ervilhaca: relação C/N da fitomassa e produtividade do milho em sucessão. Revista Brasileira de Ciência do Solo, v.25, p.331-340, 2001. Available from: <Available from: http://dx.doi.org/10.1590/S0100-06832001000200010
>. Accessed: Feb. 15, 2019. doi: 10.1590/S0100-06832001000200010.
http://dx.doi.org/10.1590/S0100-06832001...
). Greater growth was obtained in maize when grown in succession to vetch as a single cropor intercropped with black oats or turnip (FORTE et al., 2018aFORTE, C. T. et al. Coberturas vegetais do solo e manejo de cultivo e suas contribuições para as culturas agrícolas. Revista Brasileira de Ciências Agrárias, v.13, e5501, 2018a. Accessed: Feb. 15, 2019. doi: 10.5039/agraria.v13i1a5504.
https://doi.org/10.5039/agraria.v13i1a55...
). Intercropping these two species gave maximum weed control in a crop of soya (FORTE et al., 2018bFORTE, C. T. et al. Cultivation systems, vegetable soil covers and their influence on the phytosocyology of weeds. Planta Daninha, v.36, e018176776, 2018b. Available from: <Available from: http://dx.doi.org/10.1590/s0100-83582018360100099
>. Accessed: Feb. 15, 2019. doi: 10.1590/S0100-83582018360100099.
http://dx.doi.org/10.1590/s0100-83582018...
). Both single-crop and intercropped black oats and vetch resulted in a lower density of weed species, especially Lolium multiflorum (FORTE et al., 2018cFORTE, C. T. et al. Soil management systems and their effect on the weed seed bank. Pesquisa Agropecuária Brasileira, v.53, p.435-442, 2018c. Available from: <Available from: http://dx.doi.org/10.1590/s0100-204x2018000400005
>. Accessed: Feb. 15, 2019. doi: 10.1590/s0100-204x2018000400005.
http://dx.doi.org/10.1590/s0100-204x2018...
).
In planning such experiments, aspects related to plot size, number of treatments and the number of replications are important; these should be adequately sized, so that the results are reliable and inferences concerning the treatments under evaluation are valid. Proper sizing optimizes resources involved in the research, such as labour, time, financial resources and the experimental area. Sizing is a common question of researchers involved in this area of knowledge.
In uniformity trials or blank experiments, it is possible to divide the experimental area into basic experimental units (BEU) of the smallest possible size that is compatible with the evaluations (STORCK et al., 2016STORCK, L. et al. Experimentação vegetal. 3. ed. Santa Maria: UFSM, 2016. 198p.). From the data collected in these BEU, the coefficient of variation (CV) between the BEU, and the Smith index of soil heterogeneity (b) (1938SMITH, H. F. An empirical law describing heterogeneity in the yields of agricultural crops. Journal of Agricultural Science, v.28, p.1-23, 1938.) can be estimated. Estimates of CV and b can be used with the HATHEWAY methodology (1961) to calculate the optimal plot size (Xo) according to the experimental design, number of treatments, number of replications and experimental precision. After establishing the experimental design and number of treatments, the researcher can then choose the best combination of plot size, number of replications and level of experimental precision. This approach has been used with the common bean (MAYOR-DURÁN et al., 2012MAYOR-DURÁN, V. M. et al. Metodología para estimar el coeficiente de heterogeneidad del suelo, el número de repeticiones y el tamaño de parcela eninvestigaciones con frijol (Phaseolus Vulgaris L.). Acta Agronomica, v.61, p.32-39, 2012. Available from: <Available from: http://www.redalyc.org/pdf/1699/169924335006.pdf
>. Accessed: Feb. 15, 2019.
http://www.redalyc.org/pdf/1699/16992433...
), and for evaluating fresh weight in potential ground cover species, such as the velvet bean (CARGNELUTTI FILHO et al., 2014bCARGNELUTTI FILHO, A. et al. Tamanho de parcela para avaliar a massa de plantas de mucuna cinza. Comunicata Scientiae, v.5, p.196-204, 2014b. Available from: <Available from: http://comunicatascientiae.com.br/comunicata/article/view/328/245
>. Accessed: Feb. 15, 2019.
http://comunicatascientiae.com.br/comuni...
) and the forage turnip (CARNELUTTI FILHO et al., 2014cCARGNELUTTI FILHO, A. et al. Planejamentos experimentais em nabo forrageiro semeado a lanço e em linha. Bioscience Journal, v.30, p.677-686, 2014c. Available from: <Available from: http://www.seer.ufu.br/index.php/biosciencejournal/article/view/18048/13925
>. Accessed: Feb. 15, 2019.
http://www.seer.ufu.br/index.php/bioscie...
). Important results were generated in those studies, which can be applied when planning experiments with these species grown as single crops.
Although, plot size was investigated using the maximum curvature of the model of the coefficient of variation (PARANAÍBA et al., 2009PARANAÍBA, P. F. et al. Tamanho ótimo de parcelas experimentais: proposição de métodos de estimação. Revista Brasileira de Biometria, v.27, p.255-268, 2009. Available from: <Available from: http://jaguar.fcav.unesp.br/RME/fasciculos/v27/v27_n2/Patricia.pdf
>. Accessed: Feb. 15, 2019.
http://jaguar.fcav.unesp.br/RME/fascicul...
) in the single cultivation of black oats (CARGNELUTTI FILHO et al., 2014aCARGNELUTTI FILHO, A. et al. Tamanho de parcela e número de repetições em aveia preta. Ciência Rural, v.44, p.1732-1739, 2014a. Available from: <Available from: http://dx.doi.org/10.1590/0103-8478cr20131466
>. Accessed: Feb. 15, 2019. doi: 10.1590/0103-8478cr20131466.
http://dx.doi.org/10.1590/0103-8478cr201...
) and vetch (CARGNELUTTI FILHO et al., 2017CARGNELUTTI FILHO, A. et al. Plot size and number of repetitions in vetch. Bragantia, v.76, p.178-188, 2017. Available from: <Available from: http://dx.doi.org/10.1590/1678-4499.084
>. Accessed: Feb. 15, 2019. doi: 10.1590/1678-4499.084.
http://dx.doi.org/10.1590/1678-4499.084...
), it is assumed that intercropping, commonly used with ground cover plants, can generate distinct patterns of experimental design, and that the use of this approach can combine information for planning experiments with these two ground cover species.
Thus, the aim of this study was to determine the optimal plot size for evaluating the fresh weight of black oats (Avena strigosa Schreb) and the common vetch (Vicia sativa L.) in scenarios comprising combinations of the number of treatments, number of replications and levels of precision.
MATERIALS AND METHODS:
Fifteen uniformity trials were conducted with black oats (Avena strigosa Schreb) ‘Embrapa 139’, and the common vetch (Vicia sativa L.) ‘SS Ametista’, in an experimental area located at 29º42’ S and 53º49’ W, at an altitude of 95 m. According to the Köppen classification, the climate in the area is type Cfa, humid subtropical with hot summers and no dry season (ALVARES et al., 2013ALVARES, C. A. et al. Köppen’s climate classification map for Brazil. Meteorologische Zeitschrift, v.22, p.711-728, 2013. Available from: <Available from: https://www.schweizerbart.de/papers/metz/detail/22/82078/Koppen_s_climate_classification_map_for_Brazil?af=crossref
>. Accessed: Feb. 15, 2019. doi: 10.1127/0941-2948/2013/0507.
https://www.schweizerbart.de/papers/metz...
); the soil is a Dystrophic Red Arenic Argisol (SANTOS et al., 2013SANTOS, H. G. et al. Sistema brasileiro de classificação de solos. 3.ed. Brasília, DF: Embrapa Solos, 2013. 353p.). A physical and chemical analysis of the soil at a depth of 0-20 cm revealed: pHH2O 1:1:5.8, Ca: 5.7 cmolc dm-3, Mg: 2.4 cmolc dm-3, Al: 0.0 cmolc dm-3, H+Al: 3.5 cmolc dm-3, SMP index: 6.2, organic matter: 2.4%, clay content: 29.0%, S: 13.3 mg dm-3, P (Mehlich): 25.7 mg dm-3, K: 0.696 cmolc dm-3, CECpH7: 12.4 cmolc dm-3, Cu: 1.28 mg dm-3, Zn: 0.753 mg dm-3, and B: 0.1 mg dm-3. These results were used to define the fertilization (CQFS, 2016CQFS - Comissão de Química e Fertilidade do Solo. Manual de calagem e adubação para os Estados de Rio Grande do Sul e de Santa Catarina. 11. ed. Viçosa: Sociedade Brasileira de Ciência do Solo, 2016. 376p.).
The uniformity trials comprised combinations of sowing densities of black oats (Avena strigosa Schreb) ‘Embrapa 139’ (BO) and vetch (Vicia sativa L.) ‘SS Ametista’ (VE). Three trials were conducted for each of the following combinations, with the respective sowing densities shown in parentheses: 100% BO (80 kg ha-1), 75% BO (60 kg ha-1) + 25% VE (15 kg ha-1), 50% BO (40 kg ha-1) + 50% VE (30 kg ha-1), 25% BO (20 kg ha-1) + 75% VE (45 kg ha-1), and 100% VE (60 kg ha-1). On 16 June 2017, base fertilizer was applied using 20 kg ha-1 N, 80 kg ha-1 P2O5 and 80 kg ha-1 K2O (as 05-20-20 formulation NPK) with broadcast seeding.
For each uniformity trial, the central area of 6 m × 6 m (36 m2) was divided into 36 basic experimental units (BEU) of 1 m × 1 m (1 m2), to form a matrix of six rows and six columns. At flowering, the plants in each BEU were cut close to the ground and the fresh weight (FW) was determined, in g m-2. Weighing was carried out immediately after cutting to minimise possible variations in plant moisture.
In the period between sowing (16/06/2017) and evaluating the FW (20/09/2017), daily data were recorded for the minimum (Tmin) and maximum (Tmax) air temperature, in ºC, and rainfall, in mm, at the Automatic Weather Station of the Federal University of Santa Maria, located 40 m from the experimental area. The daily mean air temperature (Tm) was calculated in °C, using the expression: Tm = (Tmin + Tmax)/2.
With the FW data of the 36 BEU in each uniformity trial, plots were marked out consisting of XR adjacent BEU in a row and XC adjacent BEU in a column. Plots of different sizes and/or shapes were marked out as (X = XR × XC), i.e. (1 × 1), (1 × 2), (1 × 3), (1 × 6), (2 × 1), (2 × 2), (2 × 3), (2 × 6), (3 × 1), (3 × 2), (3 × 3), (3 × 6), (6 × 1), (6 × 2) and (6 × 3). The abbreviations XR, XC and X indicate the number of adjacent BEU in a row, the number of adjacent BEU in a column, and the size of the plot in number of BEU respectively.
For each plot size (X), the following were determined: n - the number of plots with a size of X BEU (n = 36/X), M(X) - mean value of the plots with a size of X BEU, V(X) - variance between plots with a size of X BEU, CV(X) - coefficient of variation (in %) between plots with a size of X BEU, and VU(X) - variance per BEU between plots with a size of X BEU [VU(X) = V(X)/X2].
The parameters, V1 (estimate of the variance per BEU between plots with a size of one BEU) and b (estimate for the index of soil heterogeneity), and the coefficient of determination (r2) of the function VU(X) = V1/Xb (SMITH, 1938SMITH, H. F. An empirical law describing heterogeneity in the yields of agricultural crops. Journal of Agricultural Science, v.28, p.1-23, 1938.), were estimated by logarithmic transformation and linearisation of the function VU(X) = V1/Xb (SMITH, 1938), i.e. logVU(X) = logV1 - b logX, the estimate being weighted by the degrees of freedom (DF = n-1) associated with each plot size (STEEL et al., 1997STEEL, R. G. D. et al. Principles and Procedures of Statistics: A Biometrical Approach. 3.ed. Nova York: McGraw-Hill, 1997, 666p.). The observed values of the dependent [VU(X)] and independent (X) variables and the function VU(X) = V1/Xb (SMITH, 1938) were plotted.
Experimental plans were simulated in completely randomized and randomized complete block designs for scenarios comprising combinations of i treatments (i = 5, 10, 15 and 20), r replications (r = 3, 4, 5, 6, 7 and 8) and d differences between the mean values of those treatments detected as significant at a probability of 0.05, expressed as a percentage of the overall mean value for the experiment, i.e. at levels of precision [d = 2% (greatest precision), 4%, 6%, 8%, 10%, 12%, 14%, 16%, 18% and 20% (lowest precision)].
For each experimental plan, the optimal plot size (Xo) was calculated in number of BEU (rounded up to the next integer), using the expression
(HATHEWAY, 1961HATHEWAY, W. H. Convenient plot size. Agronomy Journal, v.53, p.279-280, 1961.). In this expression, b is the estimated index of soil heterogeneity (for each combination in this study, the mean value of b in the three uniformity trials was considered); t1 is the critical value of Student’s t-distribution for the significance level of the test (type I error) of α = 5% (5% bilateral test), with DF degrees of freedom; t2 is the critical value of Student’s t-distribution, corresponding to 2(1-P) (bilateral test), where P is the probability of obtaining a significant result, i.e. the power of the test (P = 0.80, in this study), with DF degrees of freedom; CV is the estimate of the coefficient of variation between plots with a size of one BEU as a percentage (in this study, the mean value of CV for the three uniformity trials was considered for each combination); r is the number of replications and d is the difference between the mean values of those treatments detected as significant at a probability of 0.05, expressed as a percentage of the overall mean value for the experiment (precision). The degrees of freedom (DF) for obtaining the critical (tabulated) values of Student’s t-distribution were given by the expressions, DF = (i)(r-1) for the completely randomized design and DF = (i-1)(r-1) for the randomized complete block design, where i is the number of treatments and r is the number of replications. In this study, the values for t1 and t2 were obtained with the Microsoft Office Excel® software, using the functions, t1 = INVT(0.05;DF) and t2 = INVT(0.40;DF) respectively. The statistical analyses were carried out using the Microsoft Office Excel® software.
RESULTS AND DISCUSSION:
In the 15 uniformity trials comprising combinations of the sowing densities of black oats (Avena strigosa Schreb) ‘Embrapa 139’ (BO) and vetch (Vicia sativa L.) ‘SS Ametista’ (VE), there was an increase in the mean value of the plots [M(X)] and the variance between plots [V(X)], with a decrease in the coefficient of variation [CV(X)] and the variance per BEU between plots [VU(X)], for increases in the planned size of the plot (X) (Table 1 and Figure 1). These results indicate an improvement in experimental precision (a decrease in CV(X) and VU(X)), with the increase in plot size. Therefore; although, it is possible to evaluate fresh weight (FW) in plots of 1 m2, it is important to evaluate the precision in larger plots, i.e. it is essential to design the experiment with the optimal plot size to ensure a proper discrimination of the treatments under evaluation and the reliability of the inferences. In addition, smaller sizes may not represent plant development for either single crops or intercrops; whereas larger sizes would make it possible to evaluate the plants in the central area of the plot (working area) and disregard the borders, thereby reducing interference from plants in adjacent plots, i.e. inter-plot competition.
Planned plot size (X = XR × XC) in basic experimental units (BEU), with XR adjacent BEU in a row and XC adjacent BEU in a column; number of plots with a size of X BEU (n = 36/X); mean value of plots with a size of X BEU [M(X)], in g; coefficient of variation (%) between plots with a size of X BEU [CV(X)]; and variance per BEU between plots with a size of X BEU [VU(X)]. Fresh weight for sowing density in black oats (BO) and vetch (VE).

Graphical representation of the relationship between the variance per basic experimental unit (BEU) for plots with a size of X BEU [VU(X)=V(X)/X2] and the planned plot size (X), in BEU, and estimates of the parameters of the function VU(x) = V1/Xb (SMITH,1938SMITH, H. F. An empirical law describing heterogeneity in the yields of agricultural crops. Journal of Agricultural Science, v.28, p.1-23, 1938.). Fresh weight data obtained from uniformity trials with 36 BEU of 1 m2, comprising combinations of sowing density in black oats (Avena strigosa Schreb) ‘Embrapa 139’ (BO) and vetch (Vicia sativa L.) ‘SS Ametista’ (VE).
The mean value of FW in the three trials of each combination was 24055, 24005, 23189, 23579 and 21252 kg ha-1 for the combinations of 100% BO, 75% BO + 25% VE, 50% BO + 50% VE, 25% BO + 75% VE and 100% VE respectively (Table 1). There was, therefore, adequate growth and development of the black oats and vetch, with similar values for FW between the single crops and the intercrops under the environmental conditions of the site (Figure 2). The beneficial aspects of the residue from these species, when intercropped, in relation to soil protection and nitrogen supply, control and a reduction in plant density, have been highlighted (HEINRICHS et al., 2001HEINRICHS, R. Cultivo consorciado de aveia e ervilhaca: relação C/N da fitomassa e produtividade do milho em sucessão. Revista Brasileira de Ciência do Solo, v.25, p.331-340, 2001. Available from: <Available from: http://dx.doi.org/10.1590/S0100-06832001000200010
>. Accessed: Feb. 15, 2019. doi: 10.1590/S0100-06832001000200010.
http://dx.doi.org/10.1590/S0100-06832001...
; FORTE et al., 2018aFORTE, C. T. et al. Coberturas vegetais do solo e manejo de cultivo e suas contribuições para as culturas agrícolas. Revista Brasileira de Ciências Agrárias, v.13, e5501, 2018a. Accessed: Feb. 15, 2019. doi: 10.5039/agraria.v13i1a5504.
https://doi.org/10.5039/agraria.v13i1a55...
, 2018b, 2018c), and justify the importance of evaluating the FW of these plants.

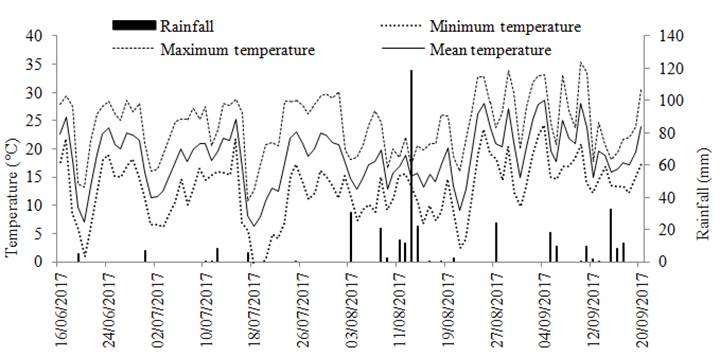
Daily minimum, maximum and mean air temperatures (°C) and rainfall (mm) for the period of the uniformity trials comprising combinations of sowing densities in black oats (Avena strigosa Schreb) ‘Embrapa 139’ and vetch (Vicia sativa L.) ‘SS Ametista’. Data obtained from the Automatic Weather Station of the Federal University of Santa Maria (Source: INMET Network).
The mean value of the coefficient of variation (CV) for FW in the three trials of each combination was 11.76%, 11.58%, 13.33%, 11.53% and 18.23% for the combinations of 100% BO, 75% BO + 25% VE, 50% BO + 50% VE, 25% BO + 75% VE and 100% VE respectively. Although, in the single-crop vetch the CV was greater (CV = 18.23%) in relation to the single-crop black oats (11.76%) and to the intercropped BO and VE (11.53% ≤ CV ≤ 13.33%), at these values, all the coefficients are considered average according to the PIMENTEL-GOMES classification (2009PIMENTEL-GOMES, F. Curso de estatística experimental. 15. ed. Piracicaba: FEALQ, 2009. 451p.) for agricultural crops in general, i.e. they are within the range of 10% and 20%. This suggested that experiments with black oats and vetch, whether as single crops or intercropped, have similar experimental precision. The variations in CV between the combinations might be associated with environmental and genotypic variability, and genotype interaction with the environment.
In the 15 uniformity trials, there were visible marked decreases in variance per BEU [VU(X)] for plots of up to four BEU in size (4 m2), midway between four and ten BEU, tending to stabilise for plots greater than ten BEU (Figure 1). This variance is phenotypic, and is therefore the sum of environmental and genotypic variances, and of genotype interaction with the environment. The behaviour was similar for other ground cover plants such as the velvet bean (CARGNELUTTI FILHO et al., 2014bCARGNELUTTI FILHO, A. et al. Tamanho de parcela para avaliar a massa de plantas de mucuna cinza. Comunicata Scientiae, v.5, p.196-204, 2014b. Available from: <Available from: http://comunicatascientiae.com.br/comunicata/article/view/328/245
>. Accessed: Feb. 15, 2019.
http://comunicatascientiae.com.br/comuni...
) and the forage turnip (CARGNELUTTI FILHO et al., 2014cCARGNELUTTI FILHO, A. et al. Planejamentos experimentais em nabo forrageiro semeado a lanço e em linha. Bioscience Journal, v.30, p.677-686, 2014c. Available from: <Available from: http://www.seer.ufu.br/index.php/biosciencejournal/article/view/18048/13925
>. Accessed: Feb. 15, 2019.
http://www.seer.ufu.br/index.php/bioscie...
). As such, a plot size of up to ten BEU (10 m2) is suggested for evaluating the fresh weight of single-crop or intercropped black oats and vetch, as the gain in experimental precision (a decrease in VU(X)) with the increase in plot size starting from ten BEU was negligible. This value of 10 m2 is relatively greater than the plot size of 4.14 m2 determined to evaluate the fresh weight of black oats (CARGNELUTTI FILHO et al., 2014aCARGNELUTTI FILHO, A. et al. Tamanho de parcela e número de repetições em aveia preta. Ciência Rural, v.44, p.1732-1739, 2014a. Available from: <Available from: http://dx.doi.org/10.1590/0103-8478cr20131466
>. Accessed: Feb. 15, 2019. doi: 10.1590/0103-8478cr20131466.
http://dx.doi.org/10.1590/0103-8478cr201...
) and of 4.52 m2 to assess the fresh weight of vetch (CARGNELUTTI FILHO et al., 2017CARGNELUTTI FILHO, A. et al. Plot size and number of repetitions in vetch. Bragantia, v.76, p.178-188, 2017. Available from: <Available from: http://dx.doi.org/10.1590/1678-4499.084
>. Accessed: Feb. 15, 2019. doi: 10.1590/1678-4499.084.
http://dx.doi.org/10.1590/1678-4499.084...
). It should be considered that these authors used another methodology, i.e. the maximum curvature of the model of the coefficient of variation (PARANAÍBA et al., 2009PARANAÍBA, P. F. et al. Tamanho ótimo de parcelas experimentais: proposição de métodos de estimação. Revista Brasileira de Biometria, v.27, p.255-268, 2009. Available from: <Available from: http://jaguar.fcav.unesp.br/RME/fasciculos/v27/v27_n2/Patricia.pdf
>. Accessed: Feb. 15, 2019.
http://jaguar.fcav.unesp.br/RME/fascicul...
).
To evaluate the fresh weight of single-crop or intercropped black oats and vetch in experiments conducted in completely randomized (CRD) and randomized complete block (RCB) designs, the optimal plot size (Xo), estimated by the HATHEWAY method (1961) from a fixed number of treatments (i) and replications (r), increases with the rise in precision (d) (Tables 2 and 3). For example, to evaluate the FW of black oats (100% BO) in an RCB design with five treatments (i = 5) and three replications (r = 3), so that in 80% of the experiments (power = 0.80) differences between treatments of d = 20% of the overall mean of the experiment (lower precision) are detected as significant at a probability of 0.05, the plot size should be four BEU (4 m2) (Table 3). A plot size equal to or greater than this is feasible in field experiments, which makes it possible to improve the experimental precision. For example, plots of 20 m2 would make it possible to achieve d = 10%. However, under these same conditions, for d = 2% (greater precision), a plot of 1330 BEU (1330 m2) would be necessary. In this situation, the experimental precision is greater, however, conducting a field experiment with a plot of 1330 m2 is impractical. As such, high experimental accuracies (low percentages of d) are difficult to achieve in practice due to the need for large plot sizes, as noted by CARGNELUTTI FILHO et al. (2014bCARGNELUTTI FILHO, A. et al. Tamanho de parcela para avaliar a massa de plantas de mucuna cinza. Comunicata Scientiae, v.5, p.196-204, 2014b. Available from: <Available from: http://comunicatascientiae.com.br/comunicata/article/view/328/245
>. Accessed: Feb. 15, 2019.
http://comunicatascientiae.com.br/comuni...
, 2014c). Similar behaviour was observed for the combinations of 75% BO + 25% VE, 50% BO + 50% VE, 25% BO + 75% VE and 100% VE (Table 3).
Optimal plot size in m2, for a completely randomized design, in combinations of i treatments, r replications and d levels of precision, for fresh weight at sowing densities in black oats and vetch.
Optimal plot size in m2, for a randomized complete block design, in combinations of i treatments, r replications and d levels of precision, for fresh weight at sowing densities in black oats and vetch.
In the CRD and RCB designs, with fixed values for i and d, the value of Xo decreases for an increase in r. Furthermore, with fixed values for r and d, there is a decrease in Xo for an increase in i (Tables 2 and 3). The greater the number of treatments and number of replications, the greater the number of error degrees of freedom and, consequently, the lower the estimate of residual variance (mean square error), i.e. the greater the experimental precision.
In the HATHEWAY methodology (1961), based on a fixed value for the Smith index of soil heterogeneity (1938SMITH, H. F. An empirical law describing heterogeneity in the yields of agricultural crops. Journal of Agricultural Science, v.28, p.1-23, 1938.) (b), Xo is dependent on i, r and d. Therefore, taking the number of treatments and the desired precision as a basis, it is possible to use the information from this study to plan the plot size and number of replications to be used. For example, if the researcher wants to evaluate the FW of ten treatments of single-crop black oats (100% BO) in an RCB design and requires a precision (d) of 10%, among the various options, he could use plots of 16 BEU (16 m2) and three replications, 11 BEU (11 m2) and four replications, eight BEU (8 m2) and five replications, six BEU (6 m2) and six replications, five BEU (5 m2) and seven replications or four BEU (4 m2) and eight replications (Table 3). For these six options, the area of the experiment would be 480, 440, 400, 360, 350 and 320 m2 respectively. Therefore, for the same precision (d = 10% in this case), smaller plots and a greater number of replications are more efficient in their use of the experimental area, as discussed in CARGNELUTTI FILHO et al. (2014bCARGNELUTTI FILHO, A. et al. Tamanho de parcela para avaliar a massa de plantas de mucuna cinza. Comunicata Scientiae, v.5, p.196-204, 2014b. Available from: <Available from: http://comunicatascientiae.com.br/comunicata/article/view/328/245
>. Accessed: Feb. 15, 2019.
http://comunicatascientiae.com.br/comuni...
, 2014c) and STORCK et al. (2016STORCK, L. et al. Experimentação vegetal. 3. ed. Santa Maria: UFSM, 2016. 198p.). It is important to consider that with the increase in the number of replications, a greater number of evaluations become necessary, and as the characteristic is difficult to measure and/or costly to evaluate, the use of a larger plot size and smaller number of replications might be advantageous, as long as there is sufficient area for the experiment. Therefore, depending on the available area, the number of treatments to be evaluated and the desired precision, the researcher should investigate which combination of plot size and number of replications is the most appropriate.
The information from this study makes it possible to investigate 240 scenarios comprising combinations of i treatments (i = 5, 10, 15 and 20), r replications (r = 3, 4, 5, 6, 7 and 8) and d differences between the mean values of those treatments detected as significant at 5% probability (d = 2%, 4%, 6%, 8%, 10%, 12%, 14%, 16%, 18% and 20%) for each combination and each design (Tables 2 and 3). Other scenarios can be simulated from the expression
(HATHEWAY, 1961HATHEWAY, W. H. Convenient plot size. Agronomy Journal, v.53, p.279-280, 1961.), based on the mean value of the index of soil heterogeneity (b) of the SMITH function (1938SMITH, H. F. An empirical law describing heterogeneity in the yields of agricultural crops. Journal of Agricultural Science, v.28, p.1-23, 1938.) and the mean value of the coefficient of variation (CV) for FW in the three trials of each combination. The following estimates would therefore be used for the combinations: 100% BO (b = 0.7593, CV = 11.76%), 75% BO + 25% VE (b = 1.0292, CV = 11.58%), 50% BO + 50% VE (b = 1.0746, CV = 13.33%), 25% BO + 75% VE (b = 0.7215, CV = 11.53%) and 100% VE (b = 1.0968, CV = 18.23%) (Tables 2 and 3).
In this context, as an example, to evaluate the FW of eight treatments of black oats (100% BO), with four replications and d = 10% in a randomized complete block design (RCB), we have: b = 0.7593, DF = (8-1) (4-1) = 21, t1 = INVT (0.05;21) = 2.07961383, t2 = INVT (0.40;21) = 0.85907403, CV = 11.76%, r = 4, d = 10%. Therefore, the optimal plot size (Xo) is . In simulating scenarios for a completely randomized design (CRD), only the expression for calculating the number of degrees of freedom will change, i.e. for this design, DF = i(r-1), where i is the number of treatments and r is the number of replications. In this example, therefore, b = 0.7593, DF = (8) (4-1) = 24, t1 = INVT (0.05;24) = 2.06389854, t2 = INVT (0.40;24) = 0.85685545, CV = 11.76%, r = 4 and d = 10%. Hence, BEU. For the same experimental values, the smaller plot size in CRD (23 BEU) compared to the RCB design (24 BEU) confirmed the greater efficiency of CRD when the experimental area is homogeneous (STORCK et al., 2016STORCK, L. et al. Experimentação vegetal. 3. ed. Santa Maria: UFSM, 2016. 198p.).
The results of this study make it possible to define the plot size and the number of replications in experiments to evaluate the fresh weight of black oats and the common vetch, grown as single crops or intercropped. However, it can generally be inferred that in experiments in a completely randomized or randomized complete block design, with from 5 to 20 treatments and five replications, plots of 10 m2 are sufficient to identify, at a probability of 0.05, significant differences between treatments of 10% of the overall mean value of the experiment. The suggestion for a plot size of 10 m2 is supported by viability in the field and the stabilized precision starting with this plot size.
CONCLUSION:
In experiments to evaluate the fresh weight of single-crop or intercropped black oats and vetch in a completely randomized or randomized complete block design, with from 5 to 20 treatments and 5 replications, plots of 10 m2 are sufficient to identify, at a probability of 0.05, significant differences between treatments of 10% of the overall mean value of the experiment.
ACKNOWLEDGEMENTS
The authors thank to the Conselho Nacional de Desenvolvimento Científico e Tecnológico (CNPq - process number 401045/2016-1 and 304652/2017-2), Coordenação de Aperfeiçoamento de Pessoal de Nível Superior (CAPES) and Fundação de Amparo à Pesquisa do Estado do Rio Grande do Sul (FAPERGS) by scholarships and financial support.
REFERENCES
- ALVARES, C. A. et al. Köppen’s climate classification map for Brazil. Meteorologische Zeitschrift, v.22, p.711-728, 2013. Available from: <Available from: https://www.schweizerbart.de/papers/metz/detail/22/82078/Koppen_s_climate_classification_map_for_Brazil?af=crossref >. Accessed: Feb. 15, 2019. doi: 10.1127/0941-2948/2013/0507.
» https://doi.org/10.1127/0941-2948/2013/0507.» https://www.schweizerbart.de/papers/metz/detail/22/82078/Koppen_s_climate_classification_map_for_Brazil?af=crossref - CARGNELUTTI FILHO, A. et al. Planejamentos experimentais em nabo forrageiro semeado a lanço e em linha. Bioscience Journal, v.30, p.677-686, 2014c. Available from: <Available from: http://www.seer.ufu.br/index.php/biosciencejournal/article/view/18048/13925 >. Accessed: Feb. 15, 2019.
» http://www.seer.ufu.br/index.php/biosciencejournal/article/view/18048/13925 - CARGNELUTTI FILHO, A. et al. Plot size and number of repetitions in vetch. Bragantia, v.76, p.178-188, 2017. Available from: <Available from: http://dx.doi.org/10.1590/1678-4499.084 >. Accessed: Feb. 15, 2019. doi: 10.1590/1678-4499.084.
» https://doi.org/10.1590/1678-4499.084.» http://dx.doi.org/10.1590/1678-4499.084 - CARGNELUTTI FILHO, A. et al. Tamanho de parcela e número de repetições em aveia preta. Ciência Rural, v.44, p.1732-1739, 2014a. Available from: <Available from: http://dx.doi.org/10.1590/0103-8478cr20131466 >. Accessed: Feb. 15, 2019. doi: 10.1590/0103-8478cr20131466.
» https://doi.org/10.1590/0103-8478cr20131466.» http://dx.doi.org/10.1590/0103-8478cr20131466 - CARGNELUTTI FILHO, A. et al. Tamanho de parcela para avaliar a massa de plantas de mucuna cinza. Comunicata Scientiae, v.5, p.196-204, 2014b. Available from: <Available from: http://comunicatascientiae.com.br/comunicata/article/view/328/245 >. Accessed: Feb. 15, 2019.
» http://comunicatascientiae.com.br/comunicata/article/view/328/245 - CQFS - Comissão de Química e Fertilidade do Solo. Manual de calagem e adubação para os Estados de Rio Grande do Sul e de Santa Catarina. 11. ed. Viçosa: Sociedade Brasileira de Ciência do Solo, 2016. 376p.
- FORTE, C. T. et al. Coberturas vegetais do solo e manejo de cultivo e suas contribuições para as culturas agrícolas. Revista Brasileira de Ciências Agrárias, v.13, e5501, 2018a. Accessed: Feb. 15, 2019. doi: 10.5039/agraria.v13i1a5504.
» https://doi.org/10.5039/agraria.v13i1a5504. - FORTE, C. T. et al. Cultivation systems, vegetable soil covers and their influence on the phytosocyology of weeds. Planta Daninha, v.36, e018176776, 2018b. Available from: <Available from: http://dx.doi.org/10.1590/s0100-83582018360100099 >. Accessed: Feb. 15, 2019. doi: 10.1590/S0100-83582018360100099.
» https://doi.org/10.1590/S0100-83582018360100099.» http://dx.doi.org/10.1590/s0100-83582018360100099 - FORTE, C. T. et al. Soil management systems and their effect on the weed seed bank. Pesquisa Agropecuária Brasileira, v.53, p.435-442, 2018c. Available from: <Available from: http://dx.doi.org/10.1590/s0100-204x2018000400005 >. Accessed: Feb. 15, 2019. doi: 10.1590/s0100-204x2018000400005.
» https://doi.org/10.1590/s0100-204x2018000400005.» http://dx.doi.org/10.1590/s0100-204x2018000400005 - HATHEWAY, W. H. Convenient plot size. Agronomy Journal, v.53, p.279-280, 1961.
- HEINRICHS, R. Cultivo consorciado de aveia e ervilhaca: relação C/N da fitomassa e produtividade do milho em sucessão. Revista Brasileira de Ciência do Solo, v.25, p.331-340, 2001. Available from: <Available from: http://dx.doi.org/10.1590/S0100-06832001000200010 >. Accessed: Feb. 15, 2019. doi: 10.1590/S0100-06832001000200010.
» https://doi.org/10.1590/S0100-06832001000200010.» http://dx.doi.org/10.1590/S0100-06832001000200010 - MAYOR-DURÁN, V. M. et al. Metodología para estimar el coeficiente de heterogeneidad del suelo, el número de repeticiones y el tamaño de parcela eninvestigaciones con frijol (Phaseolus Vulgaris L.). Acta Agronomica, v.61, p.32-39, 2012. Available from: <Available from: http://www.redalyc.org/pdf/1699/169924335006.pdf >. Accessed: Feb. 15, 2019.
» http://www.redalyc.org/pdf/1699/169924335006.pdf - PARANAÍBA, P. F. et al. Tamanho ótimo de parcelas experimentais: proposição de métodos de estimação. Revista Brasileira de Biometria, v.27, p.255-268, 2009. Available from: <Available from: http://jaguar.fcav.unesp.br/RME/fasciculos/v27/v27_n2/Patricia.pdf >. Accessed: Feb. 15, 2019.
» http://jaguar.fcav.unesp.br/RME/fasciculos/v27/v27_n2/Patricia.pdf - PIMENTEL-GOMES, F. Curso de estatística experimental. 15. ed. Piracicaba: FEALQ, 2009. 451p.
- SANTOS, H. G. et al. Sistema brasileiro de classificação de solos. 3.ed. Brasília, DF: Embrapa Solos, 2013. 353p.
- SMITH, H. F. An empirical law describing heterogeneity in the yields of agricultural crops. Journal of Agricultural Science, v.28, p.1-23, 1938.
- STEEL, R. G. D. et al. Principles and Procedures of Statistics: A Biometrical Approach. 3.ed. Nova York: McGraw-Hill, 1997, 666p.
- STORCK, L. et al. Experimentação vegetal. 3. ed. Santa Maria: UFSM, 2016. 198p.
-
CR-2019-0123.R2
Publication Dates
-
Publication in this collection
06 Apr 2020 -
Date of issue
2020
History
-
Received
15 Feb 2019 -
Accepted
20 Jan 2020 -
Reviewed
12 Feb 2020