Abstracts
Although from a societal point of view a modal shift from car to bicycle may have beneficial health effects due to decreased air pollution emissions and increased levels of physical activity, shifts in individual adverse health effects such as higher exposure to air pollution and risk of a traffic accident may prevail. We have summarized the literature for air pollution, traffic accidents, and physical activity using systematic reviews supplemented with recent key studies. We quantified the impact on all-cause mortality when 500,000 people would make a transition from car to bicycle for short trips on a daily basis in the Netherlands. We estimate that beneficial effects of increased physical activity are substantially larger (3-14 months gained) than the potential mortality effect of increased inhaled air pollution doses (0.8-40 days lost) and the increase in traffic accidents (5-9 days lost). Societal benefits are even larger because of a modest reduction in air pollution and traffic accidents. On average, the estimated health benefits of cycling were substantially larger than the risks relative to car driving for individuals shifting their mode of transport.
Air pollution; Biking; Modal shift; Physical activity; Traffic accidents
Embora uma mudança do uso de carro para bicicleta possa trazer efeitos benéficos para a saúde devido à diminuição da poluição do ar e a um aumento da atividade física, esta mudança também pode trazer efeitos adversos à saúde como exposição à poluição e risco de acidentes de trânsito, os quais podem superar os benefícios. Nós resumimos a literatura sobre poluição do ar, acidentes de trânsito e atividade física, utilizando revisões sistemáticas suplementadas com estudos recentes. Quantificamos também o impacto na causa de mortalidade se 500 mil pessoas fizessem a transição de carro para bicicleta em viagens curtas diárias na Holanda. Estimamos que os efeitos benéficos do aumento da atividade física são substancialmente maiores do que o efeito potencial da mortalidade por inalação de ar poluído e aumento de acidentes de trânsito. Os benefícios sociais são ainda maiores devido a uma modesta redução na poluição do ar e nos acidentes de trânsito. Em média, os benefícios de saúde devido ao uso da bicicleta são substancialmente maiores do que os riscos relativos a dirigir um carro para pessoas em transição do modo de transporte.
Poluição do ar; Bicicleta; Mudança; Atividade física; Acidentes de trânsito
REVIEW REVISÃO
Jeroen Johan de HartogI; Hanna BoogaardI; Hans NijlandII; Gerard HoekI
IInstitute for Risk Assessment Sciences, University of Utrecht. Jenalaan 18d, 3584 CK. 2059 Utrecht Netherlands. J.J.deHartog@uu.nl
IINetherlands Environmental Assessment Agency, Bilthoven, the Netherlands
ABSTRACT
Although from a societal point of view a modal shift from car to bicycle may have beneficial health effects due to decreased air pollution emissions and increased levels of physical activity, shifts in individual adverse health effects such as higher exposure to air pollution and risk of a traffic accident may prevail. We have summarized the literature for air pollution, traffic accidents, and physical activity using systematic reviews supplemented with recent key studies. We quantified the impact on all-cause mortality when 500,000 people would make a transition from car to bicycle for short trips on a daily basis in the Netherlands. We estimate that beneficial effects of increased physical activity are substantially larger (3-14 months gained) than the potential mortality effect of increased inhaled air pollution doses (0.8-40 days lost) and the increase in traffic accidents (5-9 days lost). Societal benefits are even larger because of a modest reduction in air pollution and traffic accidents. On average, the estimated health benefits of cycling were substantially larger than the risks relative to car driving for individuals shifting their mode of transport.
Key words: Air pollution, Biking, Modal shift, Physical activity, Traffic accidents
RESUMO
Embora uma mudança do uso de carro para bicicleta possa trazer efeitos benéficos para a saúde devido à diminuição da poluição do ar e a um aumento da atividade física, esta mudança também pode trazer efeitos adversos à saúde como exposição à poluição e risco de acidentes de trânsito, os quais podem superar os benefícios. Nós resumimos a literatura sobre poluição do ar, acidentes de trânsito e atividade física, utilizando revisões sistemáticas suplementadas com estudos recentes. Quantificamos também o impacto na causa de mortalidade se 500 mil pessoas fizessem a transição de carro para bicicleta em viagens curtas diárias na Holanda. Estimamos que os efeitos benéficos do aumento da atividade física são substancialmente maiores do que o efeito potencial da mortalidade por inalação de ar poluído e aumento de acidentes de trânsito. Os benefícios sociais são ainda maiores devido a uma modesta redução na poluição do ar e nos acidentes de trânsito. Em média, os benefícios de saúde devido ao uso da bicicleta são substancialmente maiores do que os riscos relativos a dirigir um carro para pessoas em transição do modo de transporte.
Palavras-chave: Poluição do ar, Bicicleta, Mudança, Atividade física, Acidentes de trânsito
Recently, policy interest in promoting cycling as a mode of transport has increased substantially within Europe. Several capitals, such as Copenhagen, Denmark (in 1995), Helsinki, Finland (2000), Oslo, Norway (2002), Stockholm, Sweden (2006), Barcelona, Spain (2007), Paris, France (2007), and Brussels, Belgium (2009), have implemented low-cost rental systems aimed at stimulating commuters to use bicycles for the typically short urban trips. Motive for these policies is more often the reduction of traffic congestion than promotion of health. In 2005, the European Union formulated an important area of action: "addressing the obesogenic environment to stimulate physical activity" (Commission of the European Communities 2005). Attitudes and policies toward active commuting have recently been discussed (Lorenc et al. 2008; Ogilvie et al. 2004). The Transport, Health, and Environment Pan-European Programme (THE PEP) provides guidance to policy makers and local professionals on how to stimulate cycling and walking (THE PEP 2009). The promotion of walking and cycling is a promising way to increase physical activity across the population by integrating it into daily life.
Promoting cycling for health reasons implies that the health benefits of cycling should outweigh the risks of cycling. Although society may benefit from a shift from private car use to bicycle use (e.g., reduced air pollution emission), disadvantages to individuals may occur. Although individuals may benefit from increased physical activity, at the same time they inhale more pollutants because of increased breathing rates. The risks of being involved in traffic accidents may increase, as well as the severity of an accident. A study in Vancouver, Canada (Marshall et al. 2009), illustrated that, especially in the city center, high-walkability neighborhoods had high traffic density, leading to high air pollution concentrations for a traffic-related primary pollutant [nitric oxide (NO)] but not for a secondary pollutant (ozone). For cycling, similar issues may occur.
The aim of this review is to assess quantitatively whether the health benefits of the use of a bicycle instead of a private car for short trips outweigh the health risks. The risks and benefits are evaluated both for the individuals who shift from car driving to cycling and for society as a whole.
Materials and Methods
We focus on the comparison of private car driving versus cycling because most trips are made by car, and the use of the private car is related to many negative aspects, including congestion, use of physical space, reduction of outdoor activities, air pollution, and noise. In the Netherlands, 20% and 30% of total car trips (totaling 15.9 million trips/day) are, respectively, for shopping and commuting purposes (Beckx et al. 2009a, 2009b; Mobiliteitsonderzoek Nederland 2007). Approximately 50% of all car trips are < 7.5 km, which is short enough to make travel by bicycle a feasible alternative.
In the quantitative comparison between car driving and cycling, we considered air pollution, traffic accidents, and physical activity as main exposures. We summarize the relevant evidence of health effects related to air pollution, traffic accidents, and physical activity separately. For these sections, we made use of published (systematic) reviews, supplemented with more recent key studies.
Health effects related to air pollution, traffic accidents, and physical activity differ-for example, traffic accidents resulting in injuries and physical activity affecting cardiovascular disease. Therefore, we compare potential effects of these exposures (in conjunction with driving or cycling) on mortality rather than morbidity. In addition, epidemiologic evidence of associations of these exposures with mortality is stronger than associations with other outcomes, particularly for physical activity. All three exposures have been associated with mortality, so a common metric can be used to quantify their potential effects, and mortality is reported more consistently than other health outcomes. In particular, minor injuries associated with traffic accidents are much more likely to be underreported than are deaths due to traffic accidents.
For deriving the relative risks comparing car driving and cycling, we specified a hypothetical scenario based on statistics in the Netherlands. The scenario assumes a transition from car driving to cycling for 500,000 people 18-64 years of age for short trips on a daily basis in the Netherlands. We made calculations for a daily traveled distance of 7.5 km and 15 km-for example, people commuting to and from work for 3.75 km (the average short trip) or 7.5 km (the maximum short trip). Our scenario implies a shift of about 12.5% of the 7.95 million short car trips, an ambitious yet not unrealistic percentage. In the Netherlands, 40.8% of persons > 18 years of age own both a car and a bicycle and therefore may be able to shift modes on a daily basis. In this review, we focus on the Dutch situation because of data availability, but in the overall discussion we illustrate that the use of this Dutch scenario has not substantially affected our conclusions. The scenario is used mostly to calculate travel time and kilometers driven, inputs needed to calculate air pollution, physical activity, and accident impacts, combined with more generic concentration-response functions.
We express mortality impacts in life-years gained or lost estimated with life table calculations (Miller and Hurley 2003). For the calculation we used a population of 500,000 people 18-64 years of age, distributed in age categories comparable to the 2008 Dutch population [Statistics Netherlands (CBS) 2008]. We estimated the effects on this population for a lifetime.
Air Pollution Exposures and Health Effects
Air pollution exposure during cycling and car driving. Since the 1990s various studies have measured air pollution exposure levels associated with different modes of transport (Kaur et al. 2007). In recent studies, the emphasis has been on fine and ultrafine particulate matter [aerodynamic diameter < 2.5 µm (PM2.5) and < 0.1 µm (UFP), respectively], because these are the main pollutants related to human health effects. Driving or cycling in traffic may result in air pollution exposures that are substantially higher than overall urban background concentrations (Kaur et al. 2007). Consequently, even relatively short times spent in traffic may contribute significantly to daily exposures (Beckx et al 2009a, 2009b; Fruin et al. 2004; Marshall et al. 2006; Van Roosbroeck et al. 2007). Table 1 summarizes studies that specifically compared exposures during car driving and cycling within the same study.
Overall, air pollution exposures experienced by car drivers were modestly higher than those experienced by cyclists, with mean ratios of 1.16 for PM2.5, 1.01 for UFP, and 1.65 for elemental carbon or soot. However, increased physical activity results in higher minute ventilation (volume of air inhaled in one minute) for cyclists than for car drivers, with estimates from two Dutch studies reporting that the minute ventilation of cyclists was 2.3 times (van Wijnen et al. 1995) and 2.1 times (Zuurbier et al. 2009) higher than that of car drivers. Therefore, inhaled doses of PM2.5 and, to a lesser extent, elemental carbon may be higher in cyclists. The difference in exposure between cyclists and car drivers depends on a large number of factors, such as selected route, car speed, trip duration, car type, ventilation status (open windows, mechanical ventilation), driving behavior, street configuration, and weather conditions (Kaur et al. 2007). Trip duration might also be higher for cyclists, although this may be highly dependent on the setting. For example, in a study conducted in 11 Dutch cities, there was no difference in the time required to bicycle versus drive short distances (Boogaard et al. 2009), but for longer trips cars were faster than cyclists (Zuurbier et al. 2010).
Health effects of in-traffic exposures. The short exposures typical for commuting have not been studied extensively in air pollution epidemiology, in contrast to 24-hr average exposures or long-term (annual average) exposures [World Health Organization (WHO) 2006]. Several studies have documented that long-term exposure to traffic-related air pollution is associated with adverse health effects, including increased mortality (WHO 2006).
Table 2 summarizes the few epidemiologic studies of in-traffic air pollution exposures, suggesting that these exposures result in physiologic changes (including airway and systemic inflammation and lung function decrements) in healthy adults and asthmatics and possibly more severe adverse effects (myocardial infarction).
Furthermore, there is a fairly substantial body of evidence of human controlled exposure studies in which volunteers have been exposed for 1-2 hr to diesel exhaust and to filtered air for comparison [see Supplemental Material, Table 1 (doi:10.1289/ehp.0901747)]. Typically, the evaluated exposures (100-300 ìg/m3) are higher than those encountered in ambient air, although not excessively. Because of ethical concerns, only physiologic effects have been studied with this study design. These studies have documented airway and systemic inflammation after exposure to diesel exhaust in patients and in healthy subjects.
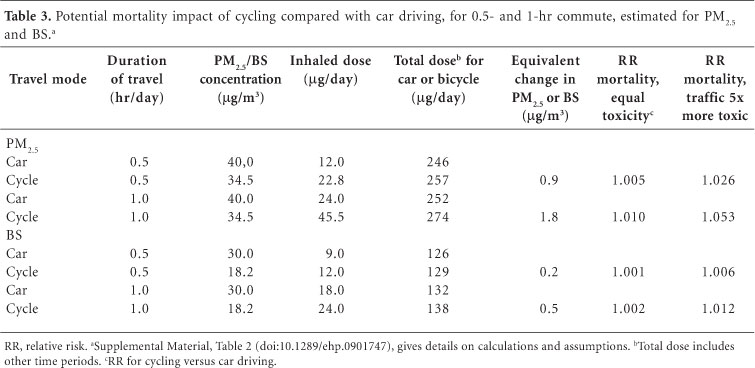
Assessment of the modal shift impact on mortality related to air pollution exposure. Individual effects. Because the physiologic changes observed in epidemiologic and controlled exposure studies likely play a role in the pathway to cardiac events of long-term exposure, it is plausible that these more adverse effects may occur in susceptible subjects. We calculated the potential impact on mortality of a transition from using a car to a bicycle for a 30-min (7.5-km) or 1-hr (15-km) commute based upon relative risk estimates from long-term exposure studies of mortality in association with PM2.5 (Pope et al. 2002) and black smoke (BS) (Beelen et al. 2008).
The derivation of these risk estimates is provided in the Supplemental Material, Table 2 (doi:10.1289/ehp.0901747); Table 3 shows the results. We assumed that the actual risk related to long-term air pollution exposure is determined by the inhaled daily dose of PM2.5 or BS. First, we calculated the inhaled pollution dose during commuting (car driving or cycling) and noncommuting hours based on prior information concerning minute ventilation rates (liters per minute) and PM2.5 and BS exposures (micrograms per cubic meter) during sleep, rest, driving, or cycling. Next, we estimated the total daily dose for PM2.5 and BS (micrograms per day) for driving or cycling. We then used the ratio of the total daily doses for the two travel modes to derive an "equivalent" change in PM2.5 or BS concentration (micrograms per cubic meter) that could be normalized to the 10 ìg/m3 increase in long-term exposures used by Pope et al. (2002) and Beelen et al. (2008) to estimate the relative risk associated with the estimated change in long-term PM2.5 and BS exposures that would result from a shift to commuting by bicycle instead of by car.
Assuming equal toxicity of particles, the estimated relative risk associated with the change in PM2.5 inhalation due to cycling instead of car driving ranges from 1.005 to 1.010. If we assume that traffic PM is more toxic than ambient PM2.5 in general, these relative risk estimates range from 1.026 to 1.053. This assumption is supported by an analysis of PM from different sources, indicating the strongest associations with mortality from traffic particles (Laden et al. 2000). If the assessment is based on BS, relative risk estimates are smaller (between 1.001 and 1.012).
Societal effects. The modal shift will reduce overall air pollution levels, which may result in health benefits of the general city population. An indication of the potential reduction in air pollution was obtained by using the Dutch dispersion model CAR (Calculation of Air pollution from Road traffic) (Eerens et al. 1993). For a typical major urban street with a traffic intensity of 10,000 vehicles/day, for a 12.5% reduction in traffic intensity, concentration reductions were 1.3 µg/m3 for nitrogen dioxide (NO2) and 0.4 µg/m3 for particles with aerodynamic diameter < 10 µm (PM10). The relative risk of long-term exposure to NO2 expressed per 10 µg/m3 increase on all-cause mortality is 1.10 (Tonne et al. 2008). This implies that for the approximately 800,000-1,600,000 subjects living in major streets in the Netherlands, mortality rates could be 1.012 times lower. This relative risk is of the same order of magnitude as the estimated increased risk to the cyclist described in the previous section and applies to a larger population.
Accidents
According to the WHO (2004), road traffic injuries accounted for approximately 2% of all global deaths, making them the 11th leading cause of global deaths. The rates of road traffic death vary considerably among countries, transport mode, type of area (urban or rural), and person. Among several European countries, the highest fatality rates are about 3.5 times higher than the lowest figures [see Supplemental Material, Figure 1 (doi:10.1289/ehp.0901747)] (International Transport Forum 2010).
How safe is cycling compared with car driving for an individual?Table 4 shows the estimated numbers of traffic deaths per age category per billion passenger kilometers traveled by bicycle and by car (driver and passenger) in the Netherlands for 2008 (CBS 2008). These data suggest that there are about 5.5 times more traffic deaths per kilometer traveled by bicycle than by car for all ages, and that cycling is riskier than travel by car for all age groups except young adults (15-30 years of age), with about 9 times more deaths among those < 15 years of age, and 17 times more deaths among those > 80 years of age. The comparison in Table 4 probably overestimates the difference between cyclists and car drivers for short trips, because the relatively safe long car trips driven on highways are included. Across Europe, 8% of traffic deaths occur on the motorways, whereas 25% of the kilometers driven are on motorways (European Road Transport Safety 2008). Risks for nonfatal accidents are higher for cyclists than for car drivers, as well [Supplemental Material, Table 3 (doi:10.1289/ehp.0901747)].
How safe is cycling compared with car driving for society? For society, the risk that car drivers present to cyclists and pedestrians must also be taken into account. For the Netherlands, an analysis has compared the risks of a fatal accident for car drivers and cyclists, including the risk to other road users (Dekoster and Schollaert 1999). The analysis excluded motorways, because cyclists cannot use these roads. Mortality rates were similar for car drivers and cyclists (20.8 vs. 21.0 deaths per million kilometers traveled). People older than 50 years are less frequently involved in fatal accidents when driving a car than when driving a bicycle, but the opposite is true for people 18-49 years of age [Supplemental Material, Table 4 (doi:10.1289/ehp.0901747)]. Jacobsen (2003) showed that in different European countries, the number of traffic deaths of cyclists is inversely related to the amount of cycling [Supplemental Material, Figure 2 (doi:10.1289/ehp.0901747)], suggesting a "safety-in-numbers" effect.
Assessment of the modal shift impact on traffic accidents related mortality. For 18- to 64-year-old individuals, the risk of a fatal accident while cycling is about 4.3 times higher compared with the same distance by car (Table 4). The fatal traffic accident rate for cyclists 20-70 years of age is about 8.2 deaths per billion passenger kilometers traveled, whereas the risk for car drivers and passengers the rate is 1.9 deaths per billion passenger kilometers traveled (Table 4). A population of 500,000 commuting 7.5 km/day will commute 1.36785 billion km/year (7.5 km/day × 365 days/year × 500,000). From the data shown in Table 4, we estimate that this amount of car travel would result in approximately 2.6 deaths/year (1.9 × 1.36785). An equivalent amount of bicycle travel would result in approximately 11.2 deaths/year (8.2 × 1.36785). In the Netherlands, the all-cause mortality rate for 18- to 64-year-old persons is 235.1 per 100,000 per year (CBS 2008) or 1,176 persons per 500,000 per year. Hence, among 18- to 64-year-olds, the relative risk of all-cause mortality associated with a 7.5 km/day shift from driving to cycling would be [1,176 + (11.2 - 2.6)]/1,176 = 1.007. When we use age-specific data, relative risks ranged from 0.996 to 1.010. For the 15-km scenario, age specific relative risks ranged from 0.993 to 1.020.
The societal impact of a modal switch on the number of fatal accidents largely depends on which people switch from car to bicycle. If it is the average population, the impact (including risk presented to other road users) would be practically zero [Supplemental Material, Table 4 (doi:10.1289/ehp.0901747)], but if young car drivers switched to a bicycle, it would decrease the number of fatal accidents. The opposite is true for elderly car drivers.
Physical Activity
Levels of inactivity are high in virtually all developed and developing countries. The WHO (2007a) estimates that 60-80% of the world's population does not meet the recommendations required to induce health benefits. For Europe 62.4% inactive adults are estimated ranging from 43.3% (Sweden) to 87.7% (Portugal) (Varo et al. 2003). In the Netherlands about 62% of the population is sedentary (Varo et al. 2003). The WHO estimates that the prevalence of physical inactivity accounts for 22% of cardiovascular disease prevalence globally (WHO 2007a). There is sufficient evidence for an association between physical activity and mortality, cardiovascular disease (hypertension), diabetes, obesity, cancer (colon and breast), osteoporosis, and depression (Bauman 2004; Warburton et al. 2006). Because only a few studies specifically reported on the beneficial health effects of cycling, we also summarized the quantitative evidence of beneficial health effects of physical activity, making use of review papers.
Cycling and physical activity recommendation. Recently, the American College of Sports Medicine and the American Heart Association published an updated recommendation for physical activity (Haskell et al. 2007). To promote and maintain health, all healthy adults 18-65 years of age need moderate-intensity aerobic physical activity for a minimum of 30 min on 5 days each week or vigorous-intensity aerobic activity for a minimum of 20 min on 3 days each week. Also, combinations of moderate- and vigorous-intensity activity can be performed to meet this recommendation. For young people, 60 min of moderate to vigorous physical activity on a daily basis is recommended (Strong et al. 2005). In several physical activity studies, metabolic equivalent of task (MET) is used as an indicator of physical activity, and the minimum goal should be in the range of 500-1,000 MET min/week. Leisure cycling or cycling to work (15 km/hr) has a MET value of 4 and is characterized as a moderate activity (Ainsworth et al. 2000). Hence, a person shifting from car to bicycle for a daily short distance of 7.5 km would meet the minimum recommendation (7.5 km at 15 km/hr = 30 min) for physical activity in 5 days (4 MET × 30 min × 5 days = 600 MET min/week).
Health effects and assessment of the modal shift impact on mortality. Table 5 provides summary estimates from reviews for the impact of physical activity on all-cause mortality, and includes only estimates that are relevant to compare the risks for cyclists and car drivers. It is difficult to synthesize information across studies because investigators have measured physical activity in different ways and classified physical activity according to different dose schemes that often are difficult to compare directly (Lee and Skerrett 2001). Several reviews have suggested that the relative risk of mortality for those who meet the recommended levels of physical activity compared with the inactive group is between 0.65 and 0.80 (Bauman 2004; Lee and Skerrett 2001; Warburton et al. 2006).
Three studies have directly assessed mortality related to cycling to work. In a prospective study in Copenhagen, the relative risk of the group bicycling to work was 0.72 [95% confidence interval (CI), 0.57-0.91] compared with other modes of transport after multivariate adjustment, including leisure-time physical activity (Andersen et al. 2000). The relative risk for physically active groups compared with the sedentary group decreased with activity level: 0.68, 0.61, and 0.53 (Andersen et al. 2000). In the Shanghai Women's Health Study, exercise and cycling for transportation were both inversely and independently associated with all-cause mortality (Matthews et al. 2007). Hazard ratios were 0.79 (95% CI, 0.61-1.01) for the group cycling 0.1-3.4 metabolic equivalent hours per day and 0.66 (95% CI, 0.40-1.07) for the group cycling > 3.4 metabolic equivalent hours per day, compared with the noncycling group. A Finnish study that combined cycling and walking to work versus nonactive commuting also showed significantly lower relative risks for active commuters in the range of 0.71 and 0.79 (Hu et al. 2004). According to the reviews and the three cycling studies, the relative risk for all-cause mortality is in the range of 0.50-0.90 (Table 5).
An expert panel determined a generally linear relationship between physical activity level and the rates of all-cause mortality, total cardiovascular disease, and coronary heart disease incidence and mortality (Kesaniemi et al. 2001). There is thus evidence that health gains occur for physically active and nonactive persons, although the magnitude of these benefits may differ.
To calculate the potential impact of the modal shift on mortality, we directly used the range of relative risk estimates (0.50-0.90) presented in Table 5.
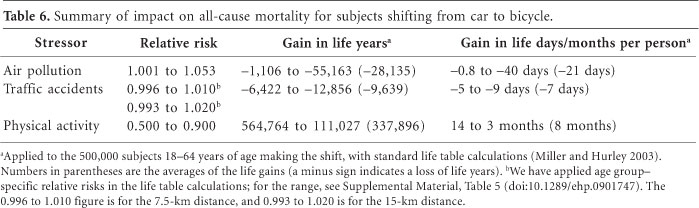
Comparison of Life Years Gained or Lost
For the people who shift from car to bicycle use for short trips, we estimated that the beneficial effect on all-cause mortality rates of the increased physical activity due to cycling is substantially larger (relative risk, 0.50-0.90) than the potential mortality effect of increased inhaled air pollution doses (relative risk, 1.001-1.053) and the effect on traffic accidents (age-specific relative risk, 0.993-1.020). The estimated gain in life expectancy per person from an increase in physical activity ranged from 3 to 14 months (Table 6). The estimated life expectancy lost because of air pollution (0.8-40 days) and traffic accidents (5-9 days) was much smaller. On average, the benefits of cycling were about 9 times larger than the risks of cycling, compared with car driving for the individuals making the shift, calculated as 337,896/(28,135 + 9,639). The estimated number of life years gained still exceeded the losses when the lowest estimate for physical activity was compared with the highest estimate for air pollution and traffic accidents (benefits/risks ratio of 2).
The largest estimated gain in life years was for the elderly [Supplemental Material, Table 6 (doi:10.1289/ehp.0901747)]. The ratio of life years gained to lost was 8.4 for persons < 40 years of age, 8.6 for persons 40-64 years of age, and 10.8 for persons > 65 years of age.
The relative benefits of a 7.5-km versus 15-km distance are probably similar. A 15-km distance (1-hr commute) increases the life-years lost for air pollution from 20 to 40 days based on PM2.5 and increases the life-years lost for traffic accidents from 5 to 9 days. The total estimated number of days lost per person is thus 49 for a 15-km distance and 25 for a 7.5-km distance. The relative risk of physical activity is difficult to quantify with the approach employed here. Using the data from Matthews et al. (2007), the relative risk would be 0.79 for the 7.5-km distance and 0.66 for the 15-km distance, assuming 4 MET associated with cycling. These relative risks translate in 280 and 173 days gained, respectively.
Overall Discussion
Principal findings. We quantitatively compared the health benefits from physical activity with the risks related to air pollution and traffic accidents between cycling and car driving for short trips, distinguishing the individuals who shift modes of travel from society as a whole. Estimated inhaled air pollution doses were higher in cyclists. The risk of a fatal traffic accident is higher for cyclists than for car drivers. Substantial benefits of physical activity have been demonstrated, including decreased cardiovascular disease and mortality.
For the people who shift from car to bicycle, we estimated that the well-documented beneficial effect of increased physical activity due to cycling resulted in about 9 times more gains in life-years than the losses in life years due to increased inhaled air pollution doses and traffic accidents. For the society as a whole this can be even larger because of reduced air pollution emissions. If the risk presented to other road users is included, the risk of a fatal traffic accident is virtually the same for cyclists and car drivers.
Strengths and weaknesses. The strength of our assessment is especially the quantitative comparison of benefits and risks, in a common scenario for the three stressors evaluated. It could be argued that the Copenhagen (Andersen et al. 2000) and Chinese studies (Matthews et al. 2007) of the effects of bicycling on mortality have already demonstrated the net effect of physical activity on all-cause mortality, including the negative effects of fatal traffic accidents and air pollution. However, the size of the potential negative health effects was not quantified separately in those studies. Therefore it is difficult to transfer the net effect of these studies to other locations, where traffic accident rates and air pollution may be different. Because in our assessment the separate risks have been disentangled, it is possible to make assessments for different settings, by using other input data (e.g., traffic mortality rates).
We performed our calculations for the Netherlands, where an extensive cycling infrastructure exists and priority is given to cyclists over other traffic-factors that contribute to regular cycling. Restrictions to car use through traffic calming in residential areas and car-free zones influence cycling behavior as well (Pucher and Dijkstra 2003). Apart from the highest average distance cycled per person, the Netherlands is also one of the safest countries in terms of fatal traffic accidents. In such countries as the United Kingdom, Spain, and France, the risk of a fatal traffic accident for cyclists is substantially higher, probably also relative to car driving [Supplemental Material, Figure 2 (doi:10.1289/ehp.0901747)]. When we repeated the traffic accident calculations for the United Kingdom, where the risk of dying per 100 million km for a cyclist is about 2.5 times higher [Supplemental Material, Figure 2 (doi:10.1289/ehp.0901747)] and assuming the same fatality risk for car drivers as in the Netherlands, resulting life expectancy losses were approximately 14 days/person, based on 2005 population data from the United Kingdom and Wales. Overall, benefits of cycling are still 7 times larger than the risks.
Calculations on mortality impacts were performed for people 18-64 years of age, because people in that age range are more likely to make the modal shift. Age-specific analysis showed that the relative benefits of cycling are highest in the older age categories. This may have been even more pronounced if we had taken into account that the relative risks of physical activity may be larger for the elderly (Vogel et al. 2009). The empirical evidence for higher relative risks in elderly related to long-term exposure to air pollution is weak; for example, in the large American Cancer Society study there were no differences in relative risk for PM2.5 (Pope et al. 2002). We did not include children in our assessment because they are unable to drive a car, so a modal shift is not possible. Because of our focus on mortality effects (being extremely rare in children), we could not quantitatively compare risks for children as car passengers or as cyclists for physical activity and air pollution. The benefits of physical activity in children are considered important, however, both for current and for future health.
Overall relative risks may largely reflect the response from sensitive subgroups. For all stressors, the elderly are likely more susceptible, and we documented in an additional analysis that the ratio of benefits and risks was highest for e" 65-year-olds. For air pollution, subjects with preexisting cardiorespiratory disease may be more susceptible, and for physical activity, sedentary people may be more susceptible; these are subgroups that may partly overlap. Hence, both the risks and benefits may be higher than in the population average analysis.
In summary, it is unlikely that the conclusion of substantially larger benefits from cycling than risks is strongly affected by the assumptions made in the scenario, including the use of data from the Netherlands. Because concentration-response functions are mostly based on studies in Europe and North America, they may not apply in developing countries. For air pollution, there are no studies on long-term mortality effects in developing countries. The generally higher ambient air pollution concentrations could lead to higher losses in life-years comparing cycling and car driving. Traffic accident statistics for the Netherlands are probably not transferable to developing countries. For physical activity, there is evidence from a Chinese study (Matthews et al. 2007), with very similar benefits. Hence, very large differences in concentration-response functions for air pollution and traffic accidents from the functions we used would be necessary to tip the balance between benefits and risks.
For air pollution, there is considerable evidence that long-term and short-term exposures are related to increased cardiopulmonary mortality (Brunekreef and Holgate 2002). There are no studies of mortality effects specifically related to in-traffic exposures. We estimated the effect of shifting mode using two major long-term mortality cohort studies (Beelen et al. 2008; Pope et al. 2002), making assumptions about the contribution of traffic participation to the total inhaled dose of PM2.5 and (diesel) soot. Relative risks comparing cycling and car driving were small for both approaches, with the lower estimates based upon BS probably most realistic, because this component is more specific for traffic emissions.
The actual risk may be smaller because cyclists could more easily choose a low-traffic route. The substantial influence of route has been documented in various monitoring and modeling studies (Adams et al. 2001; Hertel et al. 2008; Kingham et al. 1998; Strak et al. 2010). A study in Utrecht found 59% higher UFP exposure for cyclists along a high-traffic route compared with a low-traffic route (Strak et al. 2010). Walking close to the curb in London greatly increased personal exposures (Kaur et al. 2005). For cyclists, position on the road is likely important as well, because it determines distance to motorized traffic emissions. Urban planning may also contribute by separating cycle lanes from heavily trafficked roads (Thai et al. 2008).
For society, reduced overall air pollution levels may result in lower mortality from long-term exposure of city dwellers. The potential benefits we estimated based on NO2 reductions were in the same order of magnitude as the potential risks for the individuals shifting. Table 4 shows that the modal shift will lead to an increase in traffic accident deaths. The relative risk may be lower than we used because of the "safety-in-numbers" effect [Supplemental Material, Figure 2 (doi:10.1289/ehp.0901747)]. Car drivers may take more account of cyclists, resulting in fewer accidents per car-kilometer, when cyclists form a bigger part of the traffic (Jacobsen 2003). Traffic fatality and injury rates in Germany and the Netherlands (with relatively high levels of cycling and walking) were relatively low compared with those of the United States (Pucher and Dijkstra 2003). However, whether this reduction is attributable to a safety-in-numbers effect or a result of more biking lanes cannot easily be disentangled. The WHO concluded that if promotion of active commuting is accompanied by suitable transport planning and safety measures, active commuters are likely to benefit from the safety-in-numbers effect (WHO 2007b). The relative risks could also be higher because the less experienced cyclists making the shift could be more vulnerable to accidents. We cannot quantify this effect.
Even when origin and destination are the same, cars and bicycles often take different routes (Witlox 2007). The same short trip for a car may be 20-50% longer than for a bicycle (our calculations are based on comparisons per kilometer). If we could make a trip-based comparison, a lower relative risk for fatal accidents for cyclists compared with car drivers would be found. Furthermore, we did not take into account the concept of constant travel time budgets (van Wee et al. 2006): A change of travel time will be compensated by a change of destination. When taking the bicycle, the shop next door is preferred over the shop with greater choices farther away. These factors would lead to lower relative risks than we used.
Relative risks for different physical activity definitions (total physical activity, meeting the physical activity guideline, active commuting) were quite consistent. An important issue is whether the comparison between subjects with lower and higher physical activity can be used to assess the health effects of a change in physical activity related to a shift toward active commuting. Bauman (2004) showed that persons who were already in the highest quartile of fitness at baseline had a significantly lower mortality when they became even more active. In another study, people who went from unfit to fit over a 5-year period had 44% relative risk reduction compared with people who remained unfit (Blair et al. 1995). The largest improvements in health status are seen in inactive persons who change their lifestyle and become physically active (Warburton et al. 2006). A review by Erikssen et al. (1998) suggested similar health benefits from an increase in physical activity for active and sedentary persons. Already active persons could have lower benefits of the extra physical activity, leading to relative risks up to 0.90. If only active persons shift mode of transport, lower overall benefits of cycling compared with car driving will be found (ratio of life-years gained vs. lost, 4 instead of 9).
An increase in cycling does not necessarily lead to an increase in total physical activity, if it is associated with reduced activity in another domain (Forsyth et al. 2008; Thomson et al. 2008). The empirical evidence for substitution is weak, and increased fitness could also lead to more physical activity in leisure time. If we assume that for 25% of the population no health gains occur because of substitution, the ratio of benefits to risks (central estimates from Table 6) would be reduced from 8.9 to 6.7. Only if for 89% of the population no increase in total physical activity occurs because of substitution would benefits and risk become equal.
We have not considered the negative effects of physical activity on health-namely, musculoskeletal injury and fatal and nonfatal cardiac events (Institute of Medicine 2007). Cycling can be considered a moderate type and duration of sport and has lower injury risk than do more vigorous types (running, scholastic athletics) and longer durations of physical activity (Hootman et al. 2001; Parkkari et al. 2004). Exercise has acute cardiac risks as well, but the absolute risk of a cardiac event during exercise seems to be low (Institute of Medicine 2007). Regular physical activity also reduces the acute risk of a cardiovascular event (Tofler and Muller 2006).
Restriction to mortality. We limited the quantitative assessment to mortality. It is difficult to evaluate the comparison between cycling and car driving if morbidity is included because of the lack of solid concentration-response relationships for air pollution and physical activity for morbidity outcomes. A meta-analysis reported a consistent positive association between physical activity and health-related quality of life (Bize et al. 2007). The largest cross-sectional study showed that people meeting the recommended levels of physical activity had an adjusted odds ratio of "having 14 or more unhealthy days during the previous months" of 0.4 (95% CI, 0.36-0.45) over the inactive subjects (Bize et al. 2007). Quality of life may even further improve apart from the increases in life-years. Concentration-response functions for air pollutants and morbidity outcomes such as hospital admissions are lower than for mortality: in the range of 1% compared with 6% per 10-ìg/m3 increase in PM2.5 (WHO 2006). Traffic injuries may differ even more between cyclists and car drivers than fatal accidents [Supplemental Material, Table 4 (doi:10.1289/ehp.0901747)], if underreporting of especially cyclist accidents is accounted for. This would reduce the ratio between benefits and risks.
We did not include all stressors in the quantitative evaluation. Cycling contributes to other benefits, including reduced emissions of carbon dioxide relevant for reducing climate change, reduced use of physical space (e.g., related to parking), and reduced traffic noise for city dwellers, which may result in less annoyance. We are not aware of exposure studies or health effects studies that have compared traffic noise during transport for cyclists and car drivers.
Suggestions for policy. Our study suggests that policies stimulating cycling likely have net beneficial effects on public health. Policies should be accompanied by safety measures and efforts to limit hazards, for example, by infrastructural choices (building cycling lanes away from major roads to limit cyclists' air pollution exposures) or limitations such as a ban on car traffic during school start and end hours near schools. Policies may take the age dependence of the traffic accident relative risks into account-for example, by stimulating especially the young to increase cycling. However, this may not be the optimal choice for the beneficial effects of cycling.
Assessing what traffic policies are effective in promoting a population shift from using cars toward cycling (and walking) is beyond the scope of this review. A recent review showed that targeted behavior change programs can change the behavior of motivated subgroups, resulting in a 5% shift of all trips at the population level in the largest study (Ogilvie et al. 2004). However, effects of similar programs on the general, less motivated population are unclear. Those programs may benefit from taking the public's views into account and learning from good practices (e.g., THE PEP 2009). In particular, perceptions of walking and cycling as dangerous activities are an important barrier to the promotion of active transport (Lorenc et al. 2008).
Conclusions
On average, the estimated health benefits of cycling were substantially larger than the risks of cycling relative to car driving. For the society as a whole, this can be even larger because there will be a reduction in air pollution emissions and eventually fewer traffic accidents. Policies stimulating cycling are likely to have net beneficial effects on public health, especially if accompanied by suitable transport planning and safety measures.
Received 30 November 2009
Accepted 11 June 2010.
- 1. Adams HS, Nieuwenhuijsen MJ, Colvile RN, McMullen MAS, Khandelwal P. 2001. Fine particle (PM2.5) personal exposure levels in transport microenvironments, London, UK. Sci Total Environ 279:29-44.
- 2. Adams HS, Nieuwenhuijsen MJ, Colvile RN, Older MJ, Kendall M. 2002. Assessment of road users' elemental carbon personal exposure levels, London, UK. Atmos Environ 36:5335-5342.
- 3. Ainsworth BE, Haskell WL, Whitt MC, Irwin ML, Swartz AM, Strath SJ, et al 2000. Compendium of physical activities: an update of activity codes and MET intensities. Med Sci Sports Exerc 32:S498-504.
- 4. Andersen LB, Schnohr P, Schroll M, Hein HO. 2000. All-cause mortality associated with physical activity during leisure time, work, sports, and cycling to work. Arch Intern Med 160:1621-1628.
- 5. Bauman AE. 2004. Updating the evidence that physical activity is good for health: an epidemiological review 2000-2003. J Sci Med Sport 7:6-19.
- 6. Beckx C, Arentze T, Int Panis L, Janssens D, Vankerkom J, Wets G. 2009a. An integrated activity-based modelling framework to assess vehicle emissions: approach and application. Environ Plann B Plann Des 36:1086-1102.
- 7. Beckx C, Int Panis L, Arentze T, Janssens D, Wets G. 2009b. Disaggregation of nation-wide dynamic population exposure estimates in the Netherlands: applications of activity-based transport models. Atmos Environ 43:5454-5462.
- 8. Beelen R, Hoek G, van den Brandt PA, Goldbohm RA, Fischer P, Schouten LJ, et al 2008. Long-term effects of traffic-related air pollution on mortality in a Dutch cohort (NLCS-AIR study). Environ Health Perspect 116:196-202.
- 9. Bize R, Johnson JA, Plotnikoff RC. 2007. Physical activity level and health-related quality of life in the general adult population: a systematic review. Prev Med 45:401-415.
- 10. Blair SN, Kohl HW 3rd, Barlow CE, Paffenbarger RS Jr, Gibbons LW, Macera CA. 1995. Changes in physical fitness and all-cause mortality. A prospective study of healthy and unhealthy men. JAMA 273:1093-1098.
- 11. Boogaard H, Borgman F, Kamminga J, Hoek G. 2009. Exposure to ultrafine and fine particles and noise during cycling and driving in 11 Dutch cities. Atmos Environ 43:4234-4242.
- 12. Brunekreef B, Holgate ST. 2002. Air pollution and health. Lancet 360:1233-1242.
- 13. Bucksch J, Schlicht W. 2006. Health-enhancing physical activity and the prevention of chronic diseases-an epidemiological review. Soz Praventivmed 51:281-301.
- 14. CBS (Statistics Netherlands). 2008. Traffic and Transport. Available: http://www.cbs.nl/en-GB/menu/themas/verkeer-vervoer/cijfers/default.htm [accessed 1 October 2009]
- 15. Commission of the European Communities. 2005. Green Paper. Promoting Healthy Diets and Physical Activity: A European Dimension for the Prevention of Overweight, Obesity and Chronic Diseases. Available: http://ec.europa.eu/health/ph_determinants/life_style/nutrition/documents/nutrition_gp_en.pdf [accessed 1 October 2009]
- 16. Dekoster J, Schollaert U. 1999. Cycling: The Way Ahead for Towns and Cities. European Commission. Available: http://ec.europa.eu/environment/archives/cycling/cycling_en.pdf [accessed 1 October 2009]
- 17. Eerens HC, Sliggers CJ, van den Hout KD. 1993. The CAR model: the Dutch method to determine city street air quality. Atmos Environ 27B:389-399.
- 18. Erikssen G, Liestol K, Bjornholt J, Thaulow E, Sandvik L, Erikssen J. 1998. Changes in physical fitness and changes in mortality. Lancet 352:759-762.
- 19. European Road Transport Safety. 2008. Home page. Available: http://www.etsc.eu/home.php [accessed 1 June 2010]
- 20. Forsyth A, Hearst M, Oakes JM, Schmitz KH. 2008. Design and destinations: factors influencing walking and total physical activity. Urban Stud 45:1973-1996.
- 21. Fruin SA, Winer AM, Rodes CE. 2004. Black carbon concentrations in California vehicles and estimation of in-vehicle diesel exhaust particulate matter exposures. Atmos Environ 38:4123-4133.
- 22. Gegisian I. 2003. Personal Exposure to Elemental Carbon at an Intersection in London [thesis]. London: Imperial College.
- 23. Haskell WL, Lee IM, Pate RR, Powell KE, Blair SN, Franklin BA, et al 2007. Physical activity and public health: updated recommendation for adults from the American College of Sports Medicine and the American Heart Association. Med Sci Sports Exerc 39:1423-1434.
- 24. Hertel O, Hvidberg M, Ketzel M, Storm L, Stausgaard L. 2008. A proper choice of route significantly reduces air pollution exposure - a study on bicycle and bus trips in urban streets. Sci Total Environ 389:58-70.
- 25. Hootman JM, Macera CA, Ainsworth BE, Martin M, Addy CL, Blair SN. 2001. Association among physical activity level, cardiorespiratory fitness, and risk of musculoskeletal injury. Am J Epidemiol 154:251-258.
- 26. Hu G, Eriksson J, Barengo NC, Lakka TA, Valle TT, Nissinen A, et al 2004. Occupational, commuting, and leisure-time physical activity in relation to total and cardiovascular mortality among Finnish subjects with type 2 diabetes. Circulation 110:666-673.
-
27Institute of Medicine. 2007. Adequacy of Evidence for Physical Activity Guidelines Development: Workshop Summary Washington, DC: National Academies Press.
- 28. International Transport Forum. 2010. Home page. Available: http://www.internationaltransportforum.org/ [accessed 1 October 2009]
- 29. Jacobsen PL. 2003. Safety in numbers: more walkers and bicyclists, safer walking and bicycling. Inj Prev 9:205-209.
- 30. Kaur S, Nieuwenhuijsen MJ, Colvile RN. 2005. Pedestrian exposure to air pollution along a major road in Central London, UK. Atmos Environ 39:7307-7320.
- 31. Kaur S, Nieuwenhuijsen MJ, Colvile RN. 2007. Fine particulate matter and carbon monoxide exposure concentrations in urban street transport microenvironments. Atmos Environ 41:4781-4810.
- 32. Kesaniemi YK, Danforth E Jr, Jensen MD, Kopelman PG, Lefebvre P, Reeder BA. 2001. Dose-response issues concerning physical activity and health: an evidence-based symposium. Med Sci Sports Exerc 33:S351-S358.
- 33. Kingham S, Meaton J, Sheard A, Lawrenson O. 1998. Assessment of exposure to traffic-related fumes during the journey to work. Transp Res D Transp Environ 3:271-274.
- 34. Laden F, Neas LM, Dockery DW, Schwartz J. 2000. Association of fine particulate matter from different sources with daily mortality in six U.S. cities. Environ Health Perspect 108:941-947.
- 35. Lee IM, Skerrett PJ. 2001. Physical activity and all-cause mortality: what is the dose-response relation? Med Sci Sports Exerc 33:S459-S471, S493-S494.
- 36. Lorenc T, Brunton G, Oliver S, Oliver K, Oakley A. 2008. Attitudes to walking and cycling among children, young people and parents: a systematic review. J Epidemiol Community Health 62:852-857.
- 37. Marshall JD, Brauer M, Frank LD. 2009. Healthy neighborhoods: walkability and air pollution. Environ Health Perspect 117:1752-1759.
- 38. Marshall JD, Granvold PW, Hoats AS, McKone TE, Deakin E, Nazaroff WW. 2006. Inhalation intake of ambient air pollution in California's South Coast Air Basin. Atmos Environ 40:4381-4392.
- 39. Matthews CE, Jurj AL, Shu XO, Li HL, Yang G, Li Q, et al 2007. Influence of exercise, walking, cycling, and overall nonexercise physical activity on mortality in Chinese women. Am J Epidemiol 165:1343-1350.
- 40. McCreanor J, Cullinan P, Nieuwenhuijsen MJ, Stewart-Evans J, Malliarou E, Jarup L, et al 2007. Respiratory effects of exposure to diesel traffic in persons with asthma. N Engl J Med 357:2348-2358.
- 41. Miller BG, Hurley JF. 2003. Life table methods for quantitative impact assessments in chronic mortality. J Epidemiol Community Health 57:200-206.
- 42. Mobiliteitsonderzoek Nederland. 2007. Tabellenboek [in Dutch]. Available: http://www.rws.nl/dvs/Images/Tabellenboek%20MON% 202007%20v1.0_tcm 178-177711.pdf [accessed 1 March 2010]
- 43. Ogilvie D, Egan M, Hamilton V, Petticrew M. 2004. Promoting walking and cycling as an alternative to using cars: systematic review. Br Med J 329:763-766.
- 44. Parkkari J, Kannus P, Natri A, Lapinleimu I, Palvanen M, Heiskanen M, et al 2004. Active living and injury risk. Int J Sports Med 25:209-216.
- 45. Peters A, von Klot S, Heier M, Trentinaglia I, Hormann A, Wichmann HE, et al 2004. Exposure to traffic and the onset of myocardial infarction. N Engl J Med 351:1721-1730.
- 46. Pope CA III, Burnett RT, Thun MJ, Calle EE, Krewski D, Ito K, et al 2002. Lung cancer, cardiopulmonary mortality, and long-term exposure to fine particulate air pollution. JAMA 287:1132-1141.
- 47. Pucher J, Dijkstra L. 2003. Promoting safe walking and cycling to improve public health: lessons from the Netherlands and Germany. Am J Public Health 93:1509-1516.
- 48. Rank J, Folke J, Jespersen PH. 2001. Differences in cyclists and car drivers exposure to air pollution from traffic in the city of Copenhagen. Sci Total Environ 279:131-136.
- 49. Riediker M, Cascio WE, Griggs TR, Herbst MC, Bromberg PA, Neas L, et al 2004. Particulate matter exposure in cars is associated with cardiovascular effects in healthy young men. Am J Respir Crit Care Med 169:934-940.
- 50. Strak M, Boogaard H, Meliefste K, Oldenwening M, Zuurbier M, Brunekreef B, et al 2010. Respiratory health effects of ultrafine and fine particle exposure in cyclists. Occup Environ Med 67:118-124.
- 51. Strong WB, Malina RM, Blimkie CJ, Daniels SR, Dishman RK, Gutin B, et al 2005. Evidence based physical activity for school-age youth. J Pediatr 146:732-737.
- 52. Thai A, McKendry I, Brauer M. 2008. Particulate matter exposure along designated bicycle routes in Vancouver, British Columbia. Sci Total Environ 405:26-35.
- 53. THE PEP (Transport, Health and Environment Pan-European Programme). 2009. Welcome to Healthy Transport. Available: http://www.healthytransport. com/ [accessed 1 October 2009]
- 54. Thomson H, Jepson R, Hurley F, Douglas M. 2008. Assessing the unintended health impacts of road transport policies and interventions: translating research evidence for use in policy and practice. BMC Public Health 8:339; doi: 10.1186/1471-2458-8-339 [Online 30 September 2008]
- 55. Tofler GH, Muller JE. 2006. Triggering of acute cardiovascular disease and potential preventive strategies. Circulation 114:1863-1872.
- 56. Tonne C, Beevers S, Armstrong B, Kelly F, Wilkinson P. 2008. Air pollution and mortality benefits of the London Congestion Charge: spatial and socioeconomic inequalities. Occup Environ Med 65:620-627.
- 57. Van Roosbroeck S, Jacobs J, Janssen NA, Oldenwening M, Hoek G, Brunekreef B. 2007. Long-term personal exposure to PM2.5, soot and NOx in children attending schools located near busy roads, a validation study. Atmos Environ 41:3381-3394.
- 58. Van Wee B, Rietveld P, Meurs H. 2006. Is average daily travel time expenditure constant? In search of explanations for an increase in average travel time. J Transport Geogr 14:109-122.
- 59. van Wijnen JH, Verhoeff AP, Jans HW, van Bruggen M. 1995. The exposure of cyclists, car drivers and pedestrians to traffic-related air pollutants. Int Arch Occup Environ Health 67:187-193.
- 60. Varo JJ, Martinez-Gonzalez MA, De Irala-Estevez J, Kearney J, Gibney M, Martinez JA. 2003. Distribution and determinants of sedentary lifestyles in the European Union. Int J Epidemiol 32:138-146.
- 61. Vogel T, Brechat PH, Lepretre PM, Kaltenbach G, Berthel M, Lonsdorfer J. 2009. Health benefits of physical activity in older patients: a review. Int J Clin Pract 63:303-320.
- 62. Warburton DE, Nicol CW, Bredin SS. 2006. Health benefits of physical activity: the evidence. CMAJ 174:801-809.
- 63. World Health Organization (WHO). 2004. World Health Report on Road Traffic Injury Prevention. Geneva: WHO.
-
64World Health Organization (WHO). 2006. WHO Air Quality Guidelines. Global Update 2005. Copenhagen:WHO Regional Office for Europe.
-
65World Health Organization (WHO). 2007a. Increasing Physical Activity Reduces Risk of Heart Disease and Diabetes. Geneva:WHO.
-
66World Health Organization (WHO). 2007b. Economic Assessment of Transport Infrastructure and Policies. Methodological Guidance on the Economic Appraisal of Health Effects Related to Walking and Cycling. Geneva:WHO.
- 67. Witlox F. 2007. Evaluating the reliability of reported distance data in urban travel behaviour analysis. J Transport Geogr 15:172-183.
- 68. Zuurbier M, Hoek G, Oldenwening M, Lenters V, Meliefste K, van den Hazel P, et al 2010. Commuters' exposure to particulate matter air pollution is affected by mode of transport, fuel type and route. Environ Health Perspect 118:783-789.
- 69. Zuurbier M, Hoek G, Van den Hazel P, Brunekreef B. 2009. Minute ventilation of cyclists, car and bus passengers: an experimental study. Environ Health 8:48; doi:10.1186/1476-069X-8-48 [Online 27 October 2009]
Do the health benefits of cycling outweigh the risks?
Publication Dates
-
Publication in this collection
07 Dec 2011 -
Date of issue
Dec 2011
History
-
Received
30 Nov 2009 -
Accepted
11 June 2010