 Acquisition of food from family farming for the National School Food Program in the state of Rio de Janeiro, Brazil
The study aimed to analyze the acquisition of food from family farming (AF) for the National School Food Program (PNAE) in the state of Rio de Janeiro (ERJ). This was a temporal, exploratory, and analytical study based on secondary data from the National Fund for the Development of Education (FNDE) on AF between 2011 and 2022. The amounts transferred by FNDE and the percentage used in the purchase of food from AF intended for school feeding were investigated, as well as the percentage of budget reprogramming, the number of Declarations of Eligibility for the National Program to Strengthen Family Farming (DAPs), and changes in municipal managers of ERJ. There was an increase in food acquisition until 2019, and the Center-South, Serrana, Northwest, and North regions of ERJ obtained the highest percentage. Between 2020 and 2021 (pandemic period), a significant number of executing entity (EEx) reprogrammed the amount received, reaching 40-50%. Although there was a gradual increase in the acquisition of AF for the PNAE, the ERJ still needs incentives and efforts to formulate strategies for the production, supply and purchase of these foods, as well as articulations between producers and the EEx.
Key words:
Agriculture; School feeding; Public policies; Brazil
 Thumbnail
 Thumbnail
 Thumbnail
 Thumbnail
 Thumbnail
 Thumbnail
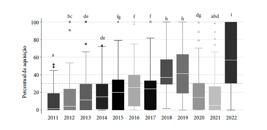
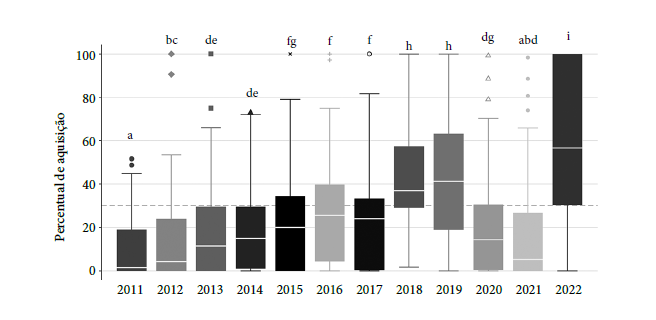 Legenda: a linha horizontal interna de cada box indica mediana, enquanto que as linhas horizontais das extremidades do box, correspondem ao intervalo interquartil (percentil 75% - linha horizontal superior; percentil 25% - linha horizontal inferior). Teste aplicado: Wilcoxon test. Letras diferentes indicam p < 0.05 na comparação de pares. Fonte: Autores.
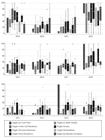
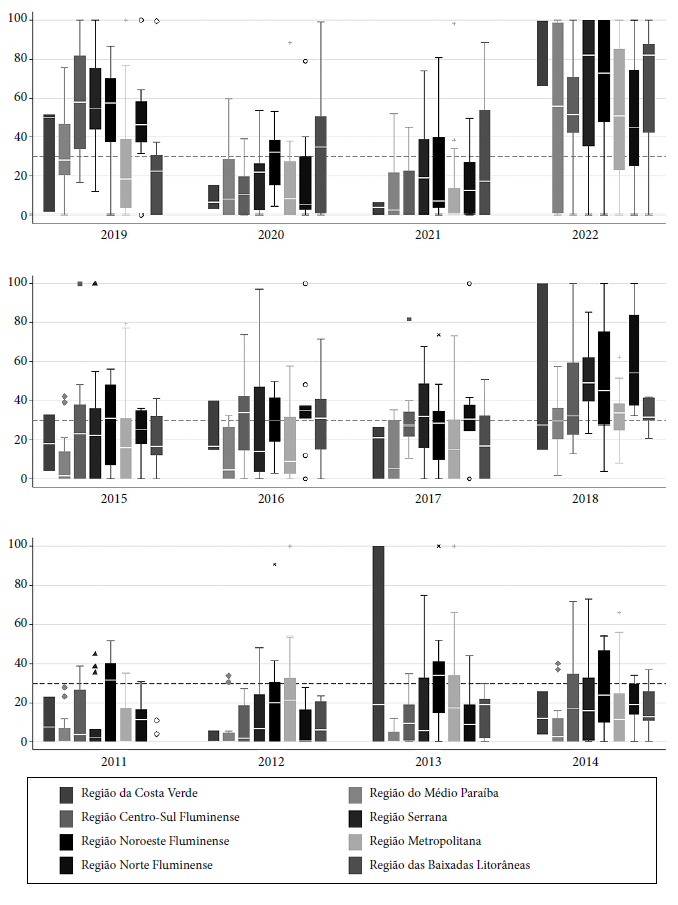 Legenda: a linha horizontal interna de cada box indica mediana, enquanto as linhas horizontais das extremidades do box, correspondem ao intervalo interquartil (percentil 75% - linha horizontal superior; percentil 25% - linha horizontal inferior). Teste aplicado: Kruskal Wallis. Valor p do teste de Kruskal Wallis: 2022 = 0.0263; 2021 = 0.0496; 2020 = 0.0223; 2019 = 0,0087; 2018 = 0,0360; 2017 = 0.1117; 2016 = 0.1161; 2015 = 0.5844; 2014 = 0.6217; 2013 = 0.6074; 2012 = 0.3103; 2011 = 0.5209. Fonte: Autores.
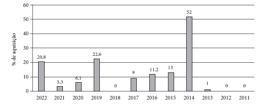
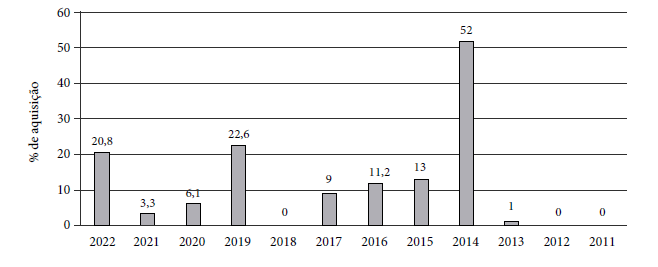 Fonte: FNDE e SIGPC, 2011-2022.
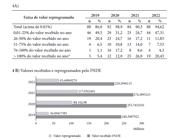
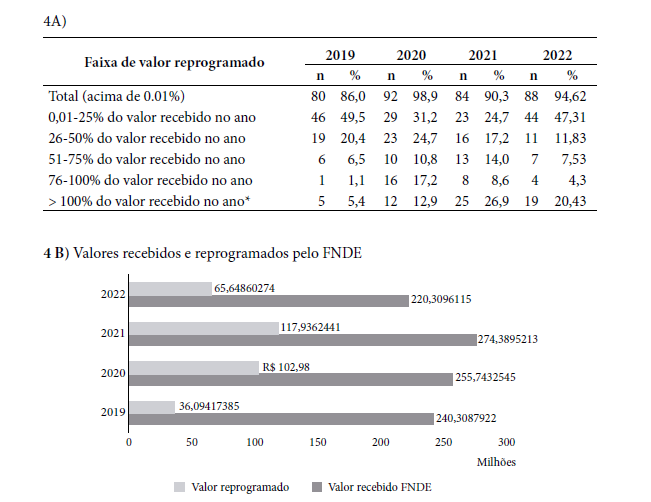 Montante real repassado pelo FNDE às 93 EEx do estado do RJ (92 municípios + SEEDUC) para o atendimento do PNAE nos anos de 2019 a 2022 e montante reprogramado para o ano seguinte em cada ano administrativo da análise (gráfico inferior). Frequências absolutas e relativas de EEx do Estado do RJ de acordo com o a faixa de reprogramação de recursos recebidos do FNDE destinados ao atendimento do PNAE nos 4 anos de análise (tabela superior). * Valores maiores que 100% do recebido no ano correspondem a múltiplas reprogramações. FNDE: Fundo Nacional de Desenvolvimento da Educação. Fonte: Autores.
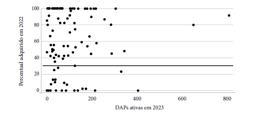
 R = -0,093. Teste de correlação de Spearman. Fonte: Autores.
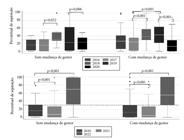
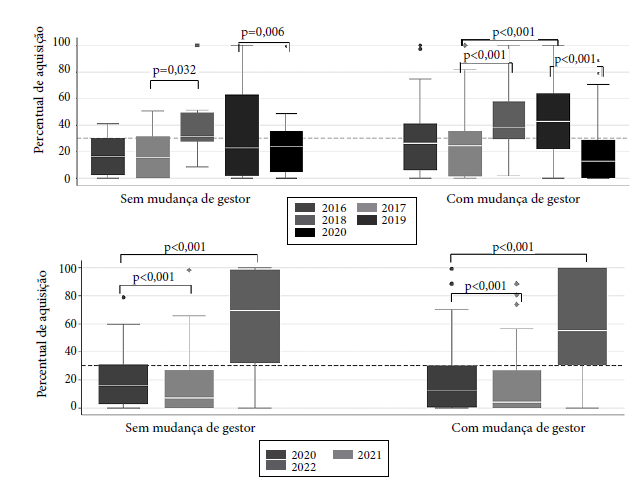 Legenda: a linha horizontal interna de cada box indica mediana, enquanto que as linhas horizontais das extremidades do box, correspondem ao intervalo interquartil (percentil 75% - linha horizontal superior; percentil 25% - linha horizontal inferior). Testes aplicados: teste entre grupos para o mesmo ano: Mann Whitney. Teste intra-grupo comparado a anos diferentes para o mesmo grupo: Wilcoxon test. Apenas os valores p < 0,05 estão apresentados nos gráficos em todas as comparações inter e intragrupos. Fonte: Autores.