
 Ultra-processed food consumption and body mass index from adolescence to early adulthood: multi-trajectory analysis using data from the 1993 Pelotas (Brazil) birth cohort
Abstract
Given the evidence linking ultra-processed food consumption to adverse health outcomes and the lack of longitudinal studies jointly addressing ultra-processed food consumption and body mass index (BMI), this study identified multi-trajectory groups from adolescence to early adulthood and described their demographic and behavioral characteristics. Data from the 1993 Pelotas (Brazil) birth cohort at ages 15, 18, and 22 (n = 2,890) were analyzed. Sex-stratified multi-trajectory groups of daily ultra-processed food consumption and BMI (z-scores for age and sex) were estimated using Group-Based Trajectory Modelling. Daily ultra-processed food consumption was defined as the number of ultra-processed food items consumed at least once per day. Sixteen NOVA-classified foods were grouped into six categories. Groups were described according to ultra-processed food types, poverty level, physical activity, screen time, smoking, alcohol use, and risk behaviors. Three multi-trajectory groups were identified: two with low ultra-processed food (group 1 and group 2) and one with increasing ultra-processed food intake (group 3). In group 1 (38.7% males; 34% females), BMI increased over time, while in group 2 (39.4% males; 44.5% females) it remained stable. In group 3 (21.9% males; 21.5% females), ultra-processed food consumption increased over time, particularly fast food, soft drinks, and processed meats, while BMI z-scores remained close to zero in males and increased in females. Risk behaviors increased over time in group 3, whereas poverty was less prevalent in group 1. Individuals in group 3 generally exhibited higher ultra-processed food intake and a greater prevalence of risk behaviors across follow-ups, despite BMI remaining within the normal range. Monitoring ultra-processed food consumption may help identify at-risk groups before excess weight becomes evident during adolescence and early adulthood.
Keywords:
Processed Food; Body Mass Index; Adolescent; Risk Behavior; Birth Cohort
 Thumbnail
 Thumbnail
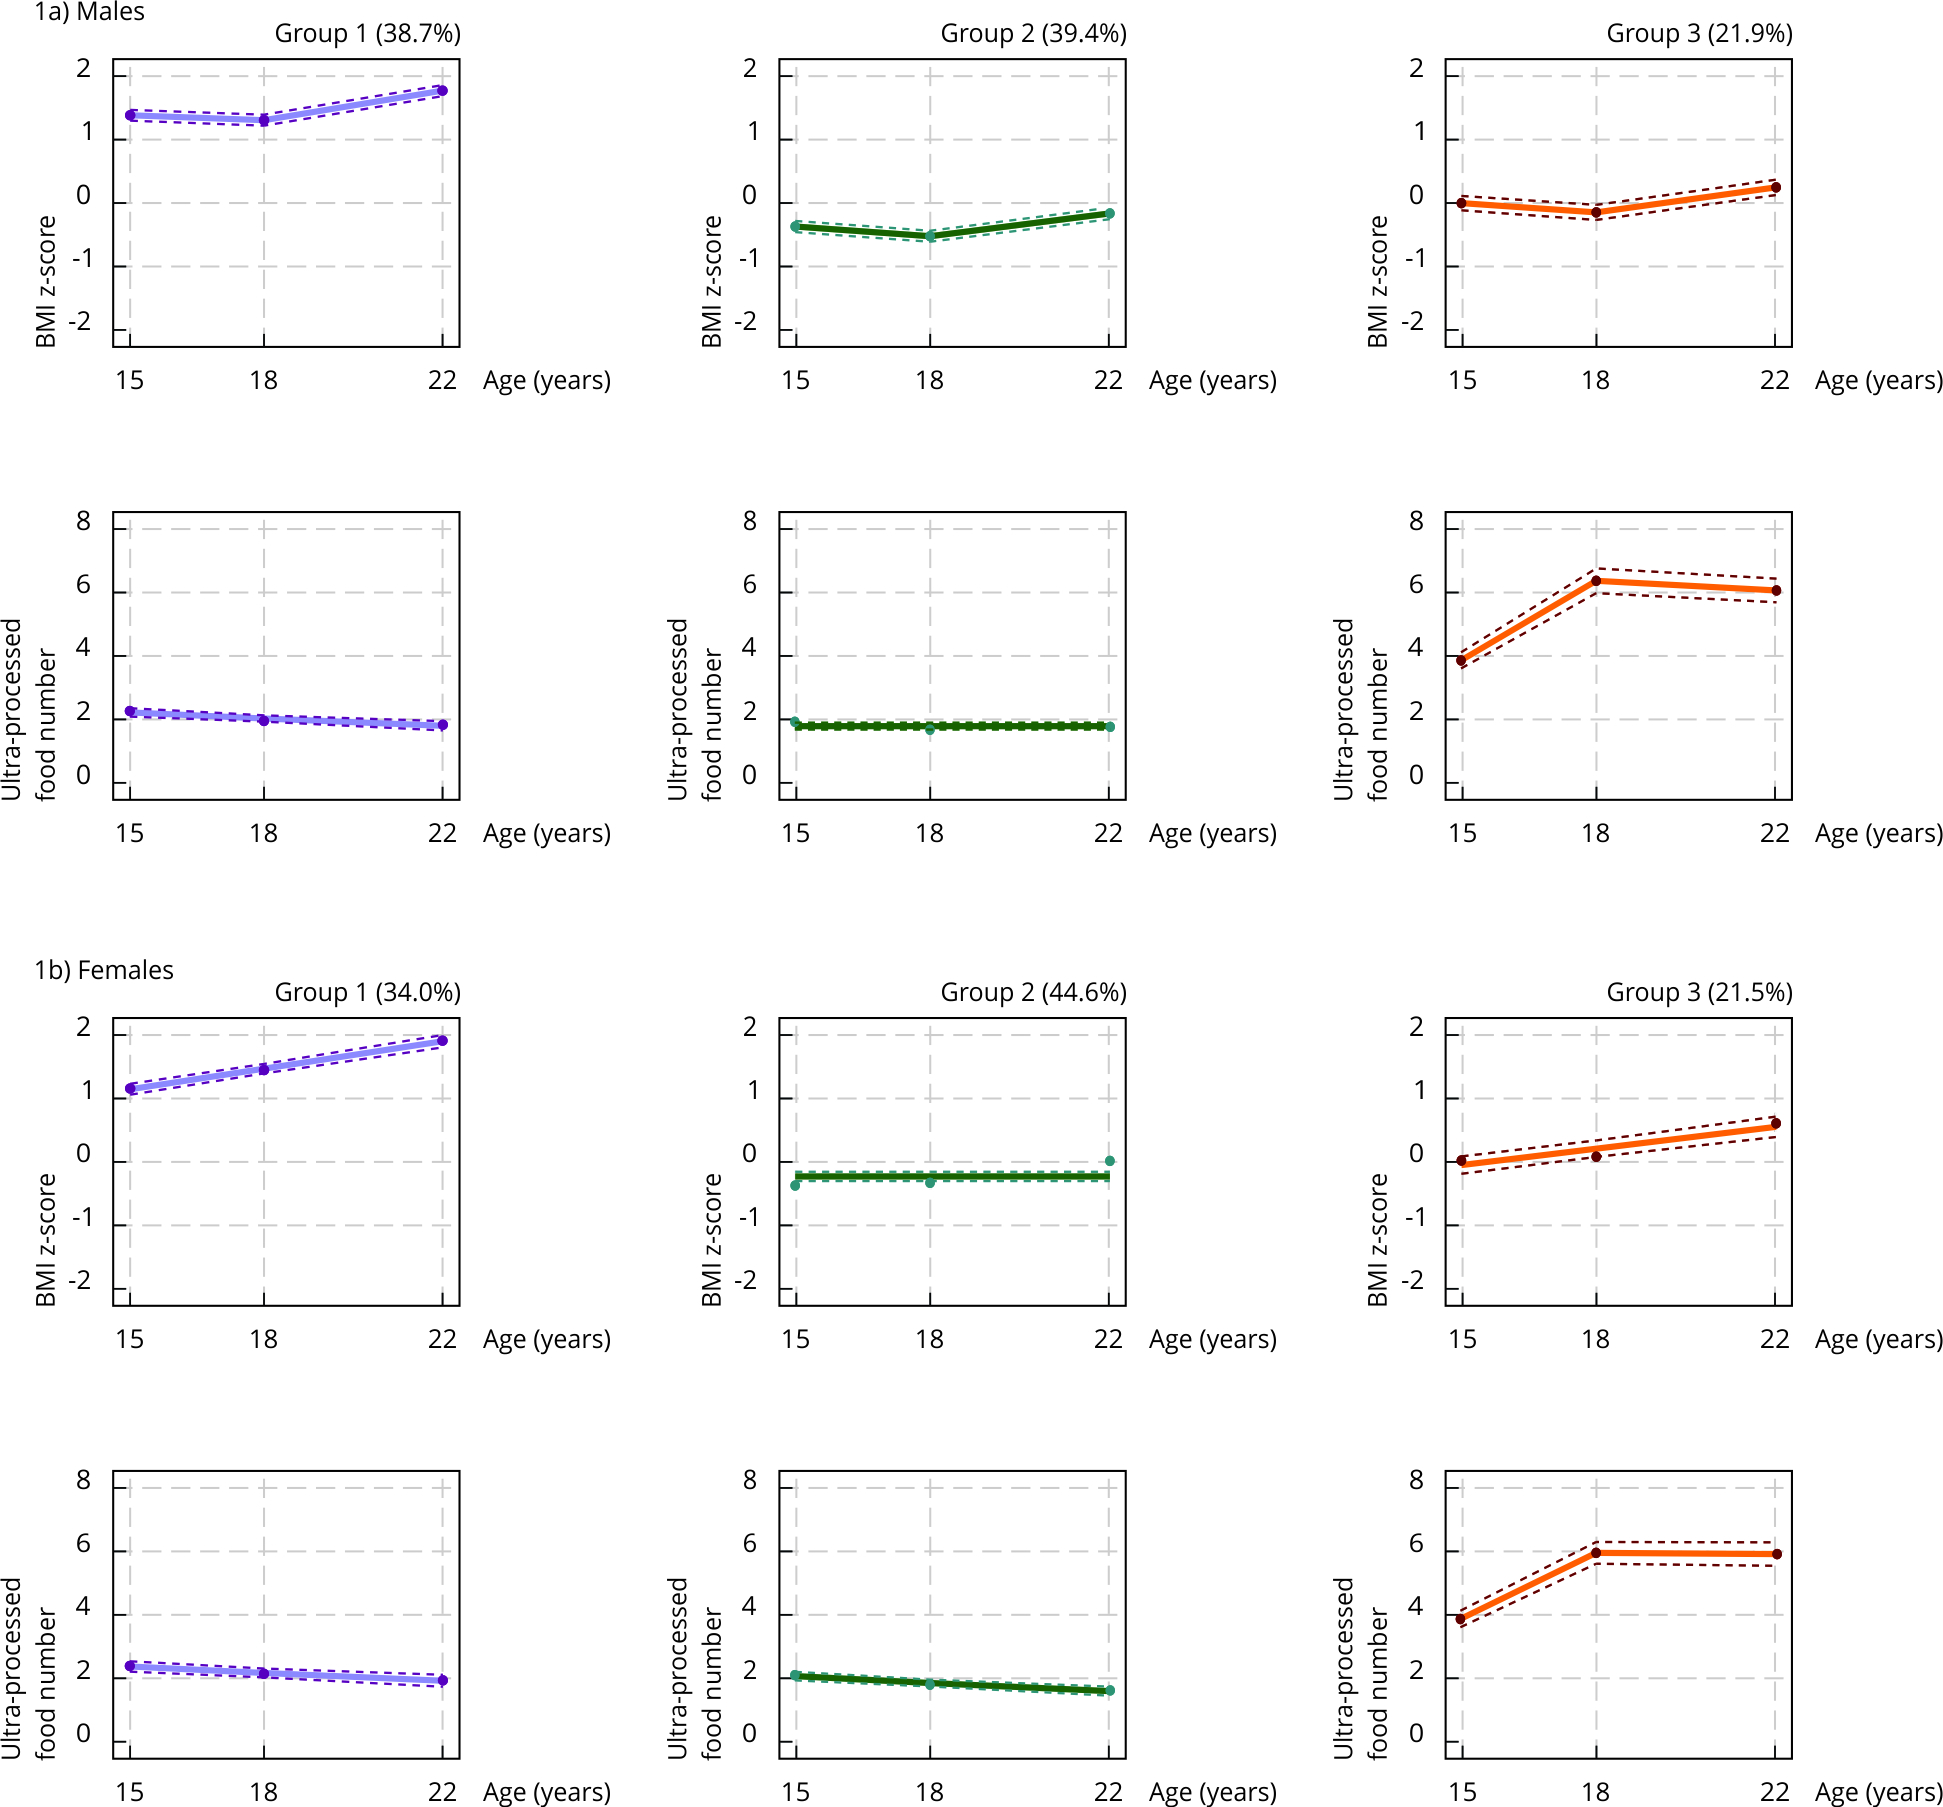 Note: daily ultra-processed food consumption was defined as frequencies equal to or greater than once per day. Males − group 1: initially high and moderately increasing BMI, with low and decreasing ultra-processed food consumption; group 2: average and moderately increasing BMI, with consistently low ultra-processed food consumption; group 3: average and moderately increasing BMI, with increasing and persistently high ultra-processed food consumption. Females − group 1: high and steadily increasing BMI, with low and decreasing ultra-processed food consumption; group 2: stable average BMI, with low and decreasing ultra-processed food consumption; group 3: average and steadily increasing BMI, with increasing and persistently high ultra-processed food consumption.
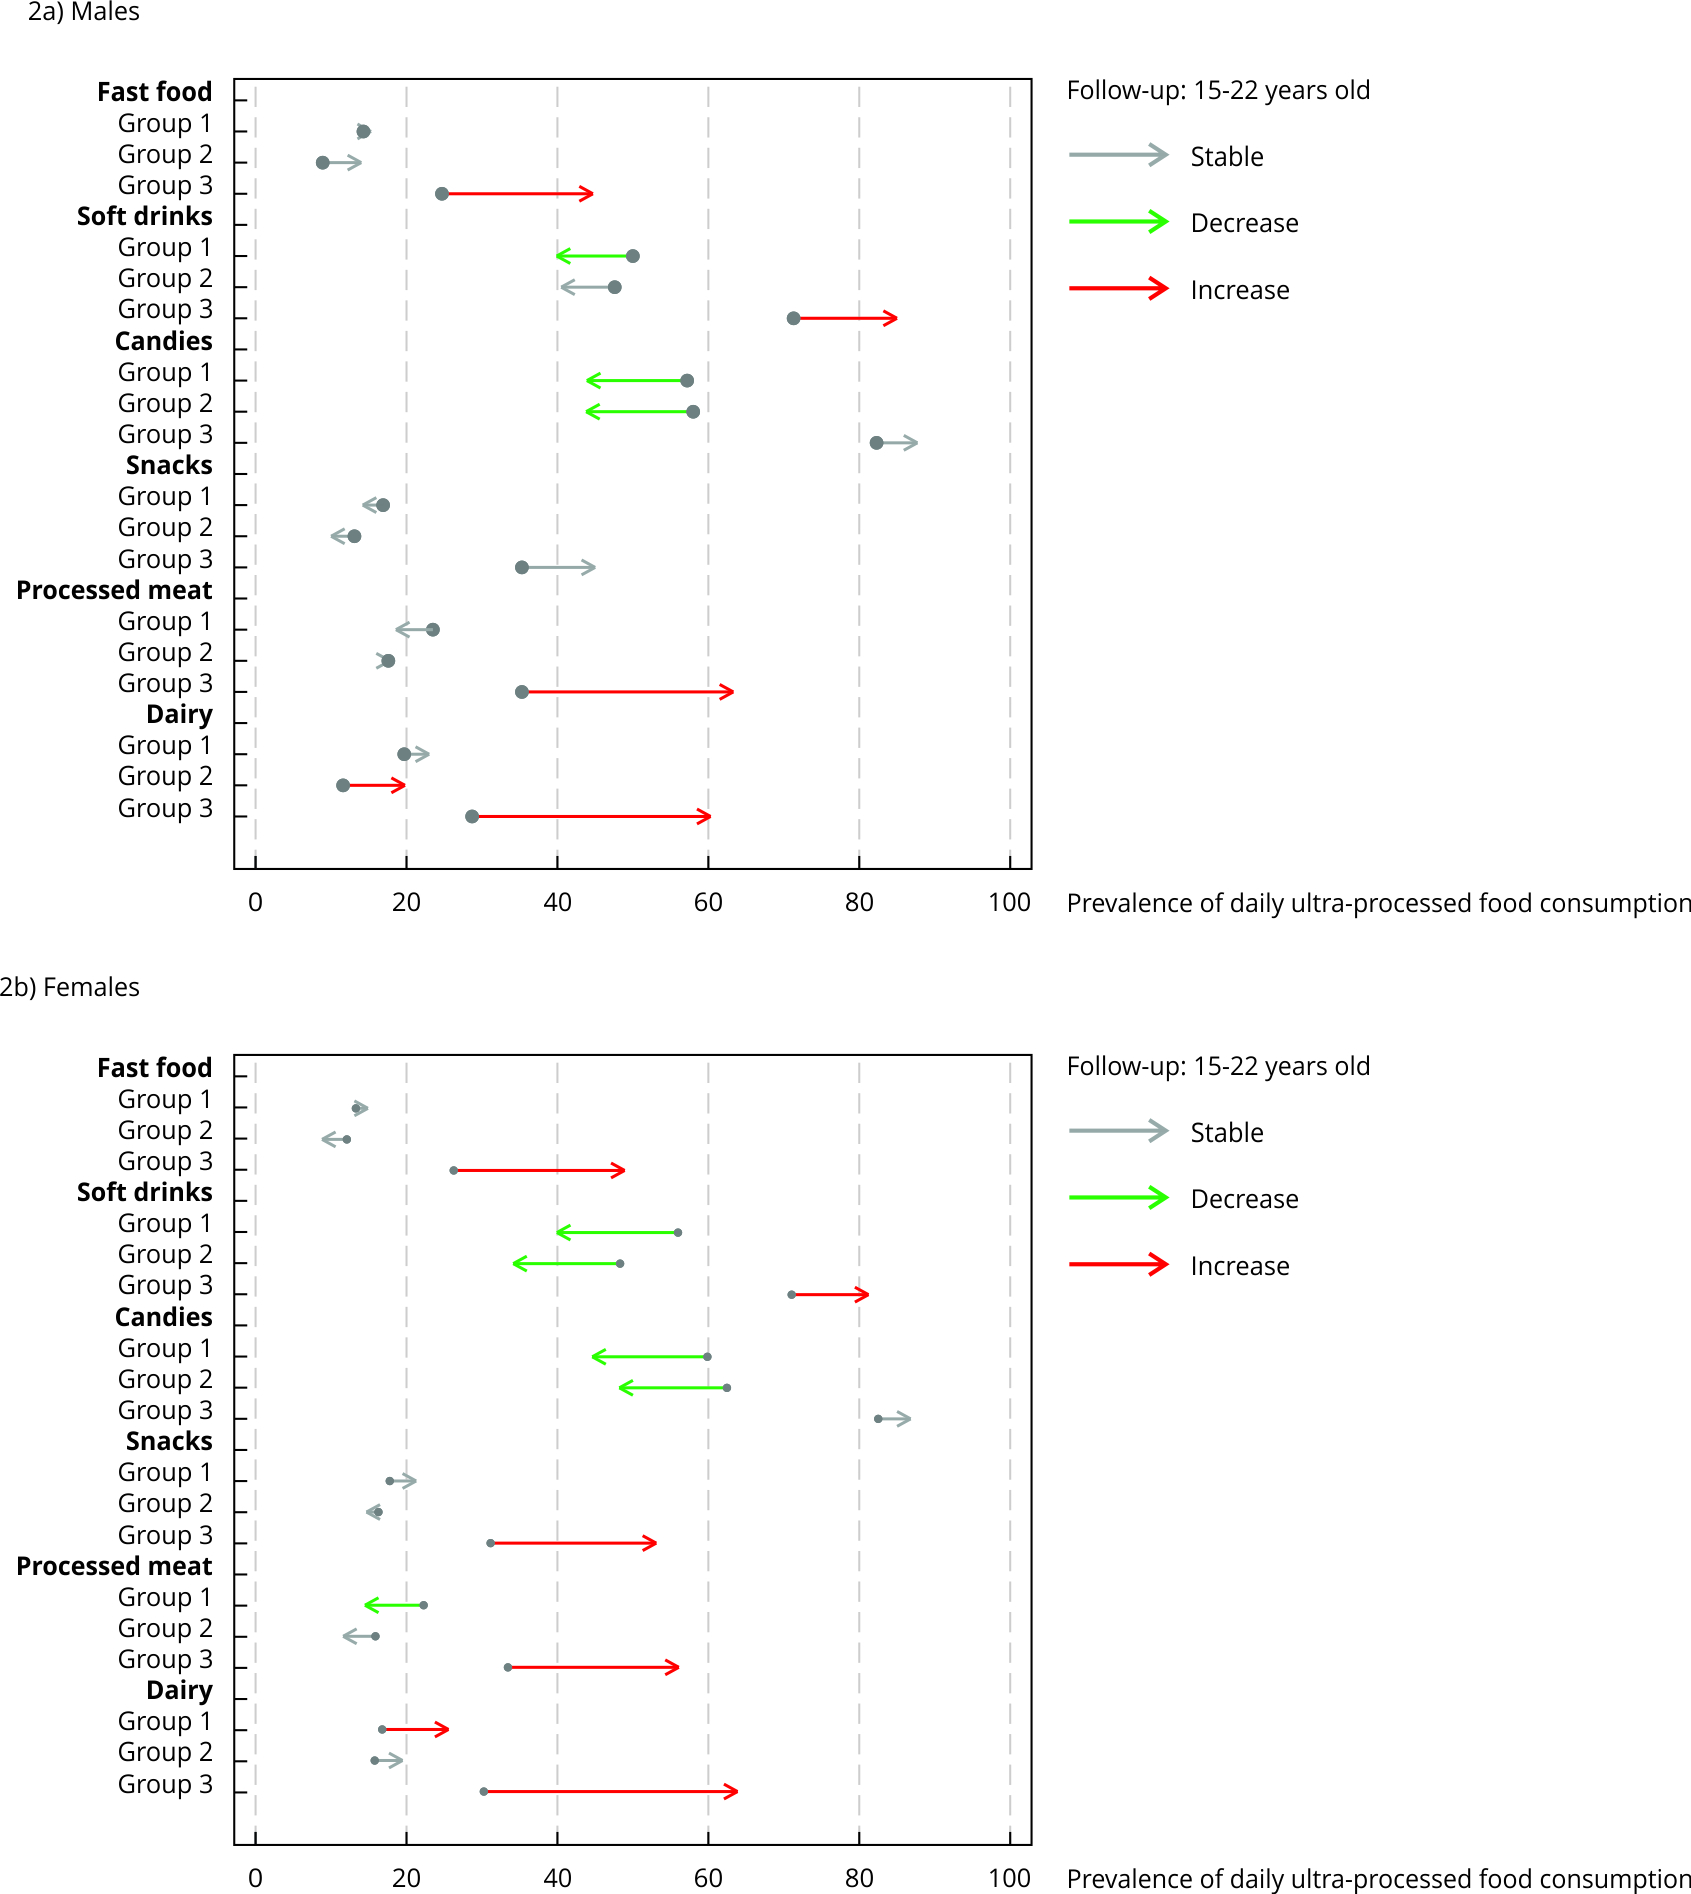 Note: daily ultra-processed food consumption was defined as frequencies equal to or greater than once per day. Males - group 1: initially high and moderately increasing body mass index (BMI), with low and decreasing ultra-processed food consumption; group 2: average and moderately increasing BMI, with consistently low ultra-processed food consumption; group 3: average and moderately increasing BMI, with increasing and persistently high ultra-processed food consumption. Females - group 1: high and steadily increasing BMI, with low and decreasing ultra-processed food consumption; group 2: stable average BMI, with low and decreasing ultra-processed food consumption; group 3: average and steadily increasing BMI, with increasing and consistently high ultra-processed food consumption. “Increase” and “decrease” indicate non-overlapping 95% confidence interval; otherwise, trends were considered stable.