Abstract
Celery (Apium graveolens L. var. secalinum Alef) leaves with 50±0.07 g weight and 91.75±0.15% humidity (~11.21 db) were dried using 8 different microwave power densities ranging between 1.8-20 W g-1, until the humidity fell down to 8.95±0.23% (~0.1 db). Microwave drying processes were completed between 5.5 and 77 min depending on the microwave power densities. In this study, measured values were compared with predicted values obtained from twenty thin layer drying theoretical, semi-empirical and empirical equations with a new thin layer drying equation. Within applied microwave power density; models whose coefficient and correlation (R²) values are highest were chosen as the best models. Weibull distribution model gave the most suitable predictions at all power density. At increasing microwave power densities, the effective moisture diffusivity values ranged from 1.595 10-10 to 6.377 10-12 m2 s-1. The activation energy was calculated using an exponential expression based on Arrhenius equation. The linear relationship between the drying rate constant and effective moisture diffusivity gave the best fit.
activation energy; effective moisture diffusivity; microwave drying; celery; thin- layer drying models
Mathematical modeling of microwave dried celery leaves and determination of the effective moisture diffusivities and activation energy
Ilknur Alibas* * Corresponding author
Department of Biosystems Engineering, Faculty of Agriculture, Uludag University,16059 Bursa, Turkey, e-mail: ialibas@uludag.edu.tr
ABSTRACT
Celery (Apium graveolens L. var. secalinum Alef) leaves with 50±0.07 g weight and 91.75±0.15% humidity (~11.21 db) were dried using 8 different microwave power densities ranging between 1.8-20 W g–1, until the humidity fell down to 8.95±0.23% (~0.1 db). Microwave drying processes were completed between 5.5 and 77 min depending on the microwave power densities. In this study, measured values were compared with predicted values obtained from twenty thin layer drying theoretical, semi-empirical and empirical equations with a new thin layer drying equation. Within applied microwave power density; models whose coefficient and correlation (R2) values are highest were chosen as the best models. Weibull distribution model gave the most suitable predictions at all power density. At increasing microwave power densities, the effective moisture diffusivity values ranged from 1.595 10–10 to 6.377 10–12 m2 s–1. The activation energy was calculated using an exponential expression based on Arrhenius equation. The linear relationship between the drying rate constant and effective moisture diffusivity gave the best fit.
Keywords: activation energy; effective moisture diffusivity; microwave drying; celery; thin- layer drying models.
Introduction
Drying is one of the most widespread methods for post-harvest preservation of agricultural products since it allows for the quick conservation (Dadali et al., 2008; Doymaz & Kocayigit, 2011; Discala et al., 2013). Vegetables, fruits and crops normally contain a high level of moisture and microorganism. For this reason, immediate drying is a requirement in postharvest processing to avoid quality losses of these perishable agricultural products (Balbay et al., 2012; Al-Harahsheh et al., 2009; Soysal, 2004).
Several drying methods are used in the drying of plants and foodstuff. The use of microwave technique in the drying of products has become common because it minimizes the quality loss and provides rapid and effective heat distribution in the product as well (Li et al., 2009; Alibas et al., 2010; Dong et al., 2011). Besides, high quality dried product is acquired via microwave drying in addition to the reducing in drying period and energy conservation while drying (Balbay et al., 2011; Zhang et al., 2006; Li et al., 2010; Evin et al., 2012; Alibas-Ozkan et al., 2007).
Thin layer drying is the process of drying in one layer of sample particles or leaves. Many mathematical models are used in order to describe the thin layer drying process. Mathematical modeling of thin layer drying is important for performance improvements of drying systems (Kardum et al., 2011). Thin layer drying models can be categorized as theoretical, semi-empirical an empirical models (McMinn, 2006; Alibas, 2014).
The aim of this study was to (i) investigate the kinetics of the thin layer drying of orange leaves, (ii) compare the developed several theoretical, empirical and semi-empirical mathematical models and estimate the constant of several models, (iii) determine the best fit using statistical analysis, (iv) determine the effect of microwave power density on constants and coefficients in the selected models according to Arrhenius type equation, (v) calculate the activation energy and effective moisture diffusivity, vi) derive a relationship between the drying rate constant and the effective moisture diffusivity.
Materials and methods
Material and drying process
Celery leaves (Apium graveolens L. var. secalinum Alef) which were selected from healthy and uniform plants used for the drying experiments were bought from a manufacturer in Geyve country of Sakarya in 2013. They were stored at 4±0.5°C until the drying process. Five different 50 g samples were kept in a drying oven at 105°C for 24 h, after which the initial moisture content of celery leaves was 91.75% ±0.15.
Microwave drying trials was performed in domestic digital microwave oven (Arcelik MD 592, Turkey). The microwave oven has eight different microwave stages among 90 and 1000 W. The area on which microwave drying is carried out was 327 mm × 370 mm × 207 mm in size, and consisted of a rotating glass plate with 280 mm diameter at the base of the oven. It has a digital clock.
Microwave drying trials were carried out at six different microwave generation powers being 1000, 850, 750, 650, 500, 350, 160 and 90 W for weight of 50 g. Dried celery leaves were 50±0.07 g in weight and selected from the uniform, and healthy plants. They were removed from the microwave oven periodically (every 30 seconds) during the drying period, and the moisture loss was determined by weighing the plate using a digital balance (Sartorious EX 2000A, Germany) with 0.01g precision. All weighing processes were completed in 10 s during the drying process. Drying process continued until the moisture content of mallow fell down to 8.95%±0.23 (Alibas-Ozkan et al., 2007.
Mathematical formulations
The regression coefficient (R2) was primary criterion for selecting the most suitable equation to describe the microwave drying curves of celery leaves. The correlation can be used to test the linear relation between measured and estimated values, which can be calculated from the following Equation 1:
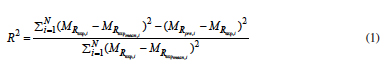
where R2 is called the coefficient of correlation, MRexp,i stands for the experimental moisture ratio found in any measurement, MRpre,i is the predicted moisture ratio fort his measurement and N is the total number of observations.
Standard error of estimated (SEE) provides information on the long term performance of the correlations by allowing a comparison of the actual deviation between predicted and measured values term by term. The ideal value of SEE is "zero". The SEE is given as (Equation 2):
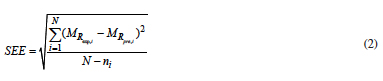
where niis called number of constants.
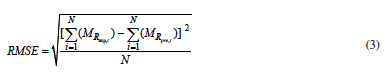
The root mean square error (RMSE) may be computed from the following equation which provides information on the short term performance (Equation 3).
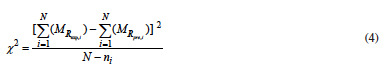
Chi square (χ2) is the mean square of the deviations between the experimental and predicted moisture levels. The lower the value of the reduced χ2, the better is the goodness of fit (Equation 4).
Effective moisture diffusivity and activation energy
Experimental results can be interpreted by using Fick's diffusion equation. Fick's second law of unsteady state diffusion given in Equation 5 (Al-Harahsheh et al., 2005; Evin, 2012; Alibas, 2014; Sarimeseli, 2011).
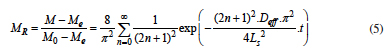
where: MR is the moisture ratio; M is the moisture content at a specific time [kg(moisture) kg–1(drymatter)]; Mo is the initial moisture content [kg(moisture) kg–1(drymatter)], Me is the equilibrium moisture content [kg(moisture) kg–1(drymatter)], Deff is the effective moisture diffusivity (m2 min–1), Ls is the half thickness (drying from both sides) of celery leaves (m) (Ls=0.18±0.010 mm), and t is drying time (min). For long drying times, n=1, Equation 6 can be written as:
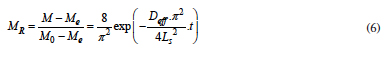
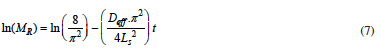
Diffusivities are typically determined by plotting experimental drying data in terms of lnMR versus drying time t in Equation 7, because the plot gives a straight line with a slope as (π2Deff)/(4Ls2).
In this study, the Arrhenius equation was used in a modified form to illustrate the relationship between the kinetic rate constant and ratio of the microwave output power density to sample amount instead of the temperature for calculation of the activation energy as the temperature is not measurable variable in standard microwave oven used for drying process. The activation energy was calculated using the Equation 8 and Equation 9 (Demirhan & Ozbek, 2011; Sarimeseli, 2011; Dadali et al., 2007a).
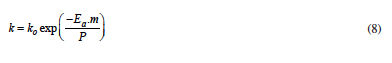
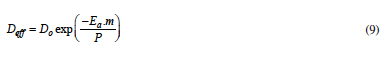
where: k is the drying rate constant obtained by using Weibull distribution's thin-layer drying model (min–1), ko is the pre-exponential constant (min–1), Deff is effective diffusivity (m2 min–1), D0 is the pre-exponential factor (m2 min–1), Ea is the activation energy (W g–1), Pis microwave output power (W) and m is the mass of raw sample (g).
The predicted values of drying rate constant (kth), obtained from Equation 8 and the theoretical values of effective moisture diffusivity ((Deff)th) obtained from Equation 9 for this study were fitted sufficiently to Equation 10.
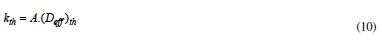
where: kth is the theoretical drying rate constant (min–1), D(eff)th is theoretical effective diffusivity (m2 s–1), Ais the stabilization constant (min–1 m2s) (Özbek & Dadali, 2007).
Data analysis
Twenty empirical and semi empirical thin-layer drying models given in Table 1 have been taken into account in this study. Non-Linear regression analyses of these equations [Eq(11) – Eq(30)] were made by using SPSS statistics 17.0. Non-linear regression analysis was performed to estimate the parameters k, k0, k1, k2, a, a0, b, c, g, h, L and n of theoretical, empirical and semi empirical equations in Table 1.
Result and discussion
Curves and mathematical modeling
In this study, apart from 20 thin-layer drying models [Eq. (11) – Eq. (30)] defined by various researchers in Table 1. Values of moisture ratio (MR) depending on time (t) of celery leaves were given in Figure 1. The drying periods of celery leaves from an initial moisture content of 91.75% ± 0.15 to 8.95% ± 0.12 were 5.5, 6, 7, 8, 9, 11, 30 and 77 min in microwave power densities of 20, 17, 15, 13, 10, 7, 3.2 and 1.8 W g–1, respectively. As the microwave power density increase drying time decreases profoundly. Similar findings were found by several researchers (Al-Harahsheh et al., 2009; Evin 2012; Alibas 2014; Demirhan & Ozbek 2011; Sarimeseli 2011; Alibas, 2012; Karaaslan & Tunçer 2008). Moreover data obtained experimentally in Figure 1 and data of estimation obtained with "Weibull distribution model" whose coefficient of correlation (R2) is highest within 20 models defined in Table 2 were also given. Since the value of the coefficient of correlation (R2) in drying tests is too close to value "1", data of model and estimation on Figure 1 seemed to coincide with each other. The value of "1" for coefficient of correlation (R2) means that estimation data corresponded well with the experimental data.
Apart from Weibull distribution model which is defined for the first time in this study, values of standard error of estimate (SEE), coefficient of correlation (R2), root mean square error (RMSE) and chi-square (χ2) about thin-layer drying models that were defined in the literature were also given in Table 2. In the study thin-layer drying model in which (R2) value is closest to "1" and RMSE, (χ2) and (SEE) values are smallest was chosen to be the most optimum model. Within microwave drying values dried of 20, 17, 15, 13, 10, 7 and 3.2 W g–1 microwave power density, coefficient of correlation (R2) of Weibull distribution model is more close to values "1 compared with other thin-layer drying model. Therefore, Weibull distribution Model was the most optimal model in which estimation values were closest to experimental data for microwave power density levels. In the microwave drying test at 1.8 W g–1 microwave power density dosage, coefficient of correlation (R2) of Weibull distribution's equation was equal to the coefficient of correlation (R2) of Jena and Das Model 0.9998 (98%). Drying constant and coefficient values (n, k, a and b) calculated for each microwave power density of Weibull distribution's equation were given in Table 3. The highest coefficient of correlation (R2) was at the level of 17 and 1.8 W g–1 microwave power density with a value of 0.9998, whereas the lowest value recorded at 20 W g–1 microwave power density level with a value of 0.9992. Weibull distribution model's coefficient of correlations (R2) were found to 0.9985, 0.9996, 0.9996, 0.9997 according to microwave power density levels 15, 13, 10, 7 and 3.2 W g–1 respectively. Moreover k, n, a and b coefficients of Weibull distribution's equation were given in Table 3 for all microwave power density.
Demirhan & Ozbek (2011) determined that the semi-empirical Midilli et al. model gave a better fit for all drying conditions applied of microwave dried celery leaves among the eight thin-layer drying models proposed. Evin (2012) found that the experimental moisture loss data were fitted to the 14 thin layer drying models. Among the models proposed, the Midilli model precisely represented the microwave drying behavior of G. tournefortii. Sarimeseli (2011) found that the coriander leaves were dried with microwave radiation and the semi-empirical Midilli et al. model was the best model of six thin-layer drying models. Dadali et al. (2007b) determined that Page's model gave a better fit for all drying conditions applied of microwave dried spinach leaves among of the eight thin-layer drying models proposed.
Estimation of effective moisture diffusivity and activation energy
The effective moisture diffusivity of celery leaves was described using the drying data. Non-linear regression technique was used to estimate the effective moisture diffusivity (Deff) of Fick's diffusion equation Equation 9. Depending on the drying conditions, effective moisture diffusivities of celery leaves ranged from 1.595 10–10 to 6.377 10–12 m2 s–1 for the microwave output power density between 20 and 1.8 W g–1, respectively. According to Eq.(9) which is calculated, the effective moisture diffusivities, the corresponding values of the coefficient of determination (R2) were presented in Table 4 for various microwave output power densities.
In this study, as the temperature is not measurable variable in standard microwave oven used for drying process, the Arrhenius equation was used in a modified form to illustrate the relationship between the kinetic rate constant and the ratio of the microwave output power density to sample amount instead of the temperature for calculation of the activation energy. After evaluation of the data, the dependence of kinetic rate constant on the ratio of microwave output power densities to sample amount was represented with Dadali et al. exponential Equation 8 (Evin, 2012; Sarimeseli, 2011; Dadali et al., 2007a, b; Özbek & Dadali, 2007). The drying rate constant (k) is obtained by using Weibull distribution equation. The values of k versus m/P shown in Figure 2 accurately fit Eq.(8) with a coefficient of determination (R2) of 0.9221 and the standard error of estimated (SEE) of 0.0148725. Then pre-exponential constant (k0) and activation energy (Ea) values were estimated as 0.2933 min-1 and 14.1978 W.g-1.
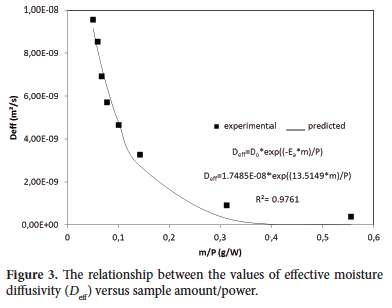
The activation energy were also calculated using Equation 9 derived by Dadali et al. (2007a, b) and Özbek & Dadali (2007). The relationship between the values of effective moisture diffusivity versus sample amount/power (m/P) is given in Figure 3 accurately fit Equation 9 with a coefficient of determination (R2) of 0.9761 and the standard error of estimated (SEE) of 5.599 10–10. The values of pre-exponential factor (Do) and activation energy (Ea) were estimated as 1.7485 10–8 m2 min–1 (1.2828 10–10 m2s–1) and 13.5149 W.g–1. In conclusion, the value of Ea found from this study was quite similar to the value (14.1978 W.g–1) obtained from the previous paragraph by using Equation 8.
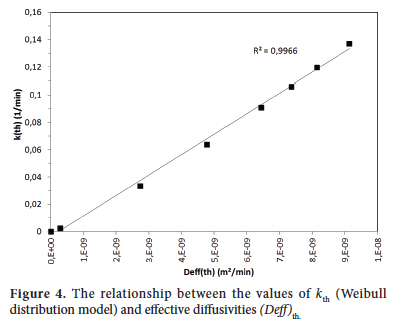
The theoretical values of drying rate constant (kth), obtained from Equation 8 and the theoretical values of effective moisture diffusivity ((Deff)th) obtained from Equation 9 for this study were fitted sufficiently to Equation 10 with the coefficient of determination (R2) of 0.9948 and the standard error of estimated value of 0.003814. The value of constant (A) was obtained as 14468064.1 107 min–1m–2s. The relationship between the theoretical effective moisture diffusivity ((Deff)th) and the drying rate constant (kth) is given in Figure 4.
Demirhan & Ozbek (2011) found that the effective moisture diffusivities increased from 0.343 × 10⁻¹⁰ to 1.714 × 10⁻¹⁰ m2 .s–1 with an increase in microwave output power of 25 g and the activation energy of celery leaves was found similar as 7.89 and 6.92 W.g–1 , respectively. Evin (2012) determined that the effective moisture diffusivities of G. tournefortii under microwave range of 90-800 W were in the range of 5.5 × 10⁻⁸ to 3.5 × 10⁻⁷ m2/s. Dadali et al. (2007b) found that the effective moisture diffusivities increased from 1.99 × 10⁻¹⁰ to 5.27 × 10⁻¹⁰ m2.s–1 with an increase in microwave output power of 25 g and the activation energy of spinach dried was found almost similar as 10.84 and 9.62 W.g–1. Sarimeseli (2011) determined that the effective moisture diffusivities were found to be 6.3 × 10⁻¹¹-2.19 × 10⁻¹⁰ m2/s of microwave dried coriander leaves within the range of microwave power values, 180-360 W.
Conclusions
The effects of different microwave power density on the drying of celery leaves were evaluated based on the drying parameters such as the drying time, the moisture on a wet basis and the drying rate. Drying period was completed between 5.5 and 77 min at the microwave power densities between 20 W and 1.8 Wg–1.
Drying tests were done at the microwave power density values of 1.8, 3.2, 7, 10, 13, 15, 17 and 20 W g–1.Twenty different drying models were used in the study and chi-square and coefficient of correlation (R2) values and constant and coefficients of these models were calculated. Weibull distribution's model was found as the best model within all drying trials.
The effective moisture diffusivity was also calculated to understand the mass transfer mechanism of celery leaves at various microwave output power densities and sample amounts. For a constant amount of 50 g sample, the effective moisture diffusivities increased from 1.595 10–10 to 6.377 10–12 m2 s–1 with an increase in microwave output power density.
The activation energy of celery leaves was calculated by using the exponential expression based on Arrhenius equation and found similar as 13.515 and 14.198 W g–1, respectively.
Notation
M initial moisture content, [kg(moisture) kg–1(drymatter)]
W0 initial weight of sample, kg
W amount of evaporated water, kg
W1 dry matter content of sample, kg
MR moisture ratio
Me equilibrium moisture content, [kg(moisture) kg–1(drymatter)]
k, k0, k1, k2 drying constant, min–1
a,a0,b,c, g, h coefficients, dimensionless
n exponent, dimensionless
t drying time, min
L sample thickness, m
R2 coefficient of correlation, decimal
χ2 chi square
RMSE root mean square error
MRexp,i stands fort the experimental moisture ratio found in any measurement
MRpre,i predicted moisture ratio for this measurement
N total number of observations
ninumber of constants
SEE standard error of estimated
Deff effective moisture diffusivity, m2 min–1
Ls half thickness of celery leave, m
ko the pre-exponential constant, min–1
D0 the pre-exponential factor, m2 min–1
Ea the activation energy, W g–1
Pmicrowave output power, W
m the mass of raw sample, g
Athe stabilization constant, min–1 m2 s
kth the theoretical drying rate constant, min–1
D(eff)th theoretical effective diffusivity, m2 s–1
Received 11 Mar., 2014
Accepted 15 Apr., 2014 (006320)
- Aghlasho, M., Kianmehr, M. H., Khani, S., & Ghasemi, M. (2009). Mathematical modeling of carrot thin-layer drying using new model. International Agrophysics, 23, 313-317.
- Akpinar, E. K. (2006). Mathematical modeling of thin layer drying process under open sun of some aromatic plants. Journal of Food Engineering, 77, 864-870. http://dx.doi.org/10.1016/j.jfoodeng.2005.08.014
- Al-Harahsheh, M., Al-Muhtaseb, A. H., & Magee, T. R. A. (2009). Microwave drying kinetics of tomato pomace: Effect of osmotic dehydration. Chemical Engineering and Processing; 48, 524-531. http://dx.doi.org/10.1016/j.cep.2008.06.010
- Alibas, I. (2010). Correlation of drying parameters, ascorbic acid and color characteristics of nettle leaves during microwave-, air- and combined microwave-air-drying. Journal of Food Process Engineering, 33(2), 213-233. http://dx.doi.org/10.1111/j.1745-4530.2008.00268.x
- Alibas, I. (2012). Microwave drying of grapevine (Vitis vinifera L.) leaves and determination of some quality parameters. Journal of Agricultural Sciences, 18, 43-53.
- Alibas, I. (2014). Microwave, Air and Combined Microwave-Air Drying of Grape Leaves (Vitis vinifera L.) and the Determination of Some Quality Parameters. International Journal of Food Engineering, 10(1), 69-88. http://dx.doi.org/10.1515/ijfe-2012-0037
- Alibas-Ozkan, I., Akbudak, B., & Akbudak, N. (2007). Microwave drying characteristics of spinach. Journal of Food Engineering, 78(2), 577-583. http://dx.doi.org/10.1016/j.jfoodeng.2005.10.026
- Babalis, S. J., Papanicolaou, E., Kyriakis, N., & Belessiotis, V. G. (2006). Evaluation of thin-layer drying models for describing drying kinetics of figs (Ficus carica). Journal of Food Engineering, 75, 205-214. http://dx.doi.org/10.1016/j.jfoodeng.2005.04.008
- Balbay, A., Kaya, Y., & Sahin, O. (2012). Drying of black cumin (Nigella sativa) in a microwave assisted drying system and modeling using extreme learning machine. Energy, 44, 352-357. http://dx.doi.org/10.1016/j.energy.2012.06.022
- Balbay, A., Sahin, Ö., & Karabatak, M. (2011). An investigation of drying process of shelled pistachio in a newly designed fixed bed dryer system by using artificial neural network. Drying Technology, 29, 1685-1696. http://dx.doi.org/10.1080/07373937.2011.600843
- Dadali, G., Apar DK., & Ozbek B. (2007). Microwave drying kinetics of okra. Drying Technology, 25(5), 917-924. http://dx.doi.org/10.1080/07373930701372254
- Dadali, G., Demirhan, E., & Özbek, B. (2007). Effect of drying conditions on rehydration kinetics of microwave dried spinach. Food and Bioproducts Processing, 86, 235-241. http://dx.doi.org/10.1016/j.fbp.2008.01.006
- Dadali, G., Demirhan, E., & Ozbek, B. (2007). Microwave heat treatment of spinach: drying kinetics and Effective Moisture Diffusivity. Drying Technology, 25(10), 1703-1712. http://dx.doi.org/10.1080/07373930701590954
- Demir, V., Gunhan, T., & Yagcioglu, A. K. (2007). Mathematical modelling of convection drying of green table olives. Biosystems Engineering, 98(1), 47-53. http://dx.doi.org/10.1016/j.biosystemseng.2007.06.011
- Demirhan, E., & Ozbek, B. (2011). Thin-layer drying characteristics and modeling of celery leaves undergoing microwave treatment. Chemical Engineering Communications, 7(198), 957-975. http://dx.doi.org/10.1080/00986445.2011.545298
- Diamante, L. M., & Munro, P. A. (1991). Mathematical modeling of hot air drying of sweet potato slices. International Journal of Food Science and Technology, 26, 99. http://dx.doi.org/10.1111/j.1365-2621.1991.tb01145.x
- Diamante, L. M., & Munro, P. A. (1993). Mathematical modeling of the thin layer solar drying of sweet potato slices. Solar Energy, 51, 271-276. http://dx.doi.org/10.1016/0038-092X(93)90122-5
- Discala, K., Meschino, G., Vega-Galvez, A., Lemus-Mondaca, R., Roura, S., & Mascheroni, R. (2013). An artificial neural network model for prediction of quality characteristics of apples during convective dehydration. Food Science and Technology, 33(3), 411-416.
- Dong, J., Ma, X., Fu, Z., & Guo, Y. (2011). Effects of microwave drying on the contents of functional constituents of Eucommia ulmoides flower tea. Industrial Crops and Products, 34, 1102-1110. http://dx.doi.org/10.1016/j.indcrop.2011.03.026
- Doymaz, I., & Ismail, O. (2011). Drying characteristics of sweet cherry. Food and Bioproducts Processing, 89, 31-38. http://dx.doi.org/10.1016/j.fbp.2010.03.006
- Doymaz, Í., & Kocayigit, F. (2011). Drying and Rehydration Behaviors of Convection Drying of Green Peas. Drying Technology, 29, 1273-1282. http://dx.doi.org/10.1080/07373937.2011.591713
- Evin, D. (2012). Thin layer drying kinetics of Gundelia tournefortii L. Food and Bioproducts Processing, 90, 323-332. http://dx.doi.org/10.1016/j.fbp.2011.07.002
- Jangam, S. V., Joshi, V. S., Mujumdar, A. S., & Thorat, B. N. (2008). Studies of dehydration of sapota (Achras zapota). Drying Technology, 26, 369-377. http://dx.doi.org/10.1080/07373930801898190
- Jena, S., & Das, H. (2007). Modelling for vacuum drying characteristics of coconut presscake. Journal of Food Engineering, 79, 92-99. http://dx.doi.org/10.1016/j.jfoodeng.2006.01.032
- Karaaslan, S. N., & Tunçer, Í. K. (2008). Development of a drying model for combined microwave-fan assisted convection drying of spinach. Biosystems Engineering, 100, 44-52. http://dx.doi.org/10.1016/j.biosystemseng.2007.12.012
- Karathanos, V. T. (1999). Correlation of water content of dried fruits by drying kinetics. Journal of Food Engineering, 39, 337-344. http://dx.doi.org/10.1016/S0260-8774(98)00132-0
- Kardum, J. P., Sander, A., & Skansi, D. (2011). Comparison of convective, vacuum, and microwave drying chlorpropamide. Drying Technology, 19(1), 167-183. http://dx.doi.org/10.1081/DRT-100001359
- Kassem, A. S. (1998). Comparative studies on thin layer drying models for wheat. In Proceedings of the 13th International Congress on Agricultural Engineering, Morocco.
- Kingsly, R. P., Goyal, R. K., Manikantan, M. R., & Ilyas, S. M. (2007). Effects of pretreatments and drying air temperature on drying behavior of peach slice. International Journal of Food Science and Technology, 42, 65-69. http://dx.doi.org/10.1111/j.1365-2621.2006.01210.x
- Li, Z., Raghavan, G. S. V., & Orsat, V. (2010). Optimal power control strategies in microwave drying. Journal of Food Engineering, 99, 263-268. http://dx.doi.org/10.1016/j.jfoodeng.2010.02.024
- Li, Z., Raghavan, G. S. V., Wang, N., & Gariepy, Y. (2009). Real-time, volatile-detection-assisted control for microwave drying. Computers and Electronics in Agriculture, 69, 177-184. http://dx.doi.org/10.1016/j.compag.2009.08.002
- McMinn, W. A. M. (2006). Thin-layer modelling of the convective, microwave, microwave-convective and microwave-vacuum drying of lactose powder. Journal of Food Engineering, 72, 113-123 http://dx.doi.org/10.1016/j.jfoodeng.2004.11.025
- Midilli, A., Kucuk, H., & Yapar, Z. (2002). A new model for single layer drying. Drying Technology, 20(7), 1503-1513. http://dx.doi.org/10.1081/DRT-120005864
- Özbek B., & Dadali, G. (2007). Thin-layer drying characteristics and modeling of mint leaves undergoing microwave treatment. Journal of Food Engineering, 83, 541-549. http://dx.doi.org/10.1016/j.jfoodeng.2007.04.004
- Pehlivan, D., & Toğrul, I. T. (2004). Modelling of thin layer drying kinetics of some fruits under open-air sun drying process. Journal of Food Engineering, 65(3), 413-425. http://dx.doi.org/10.1016/j.jfoodeng.2004.02.001
- Sarimeseli, A. (2011). Microwave drying characteristics of coriander (Coriandrum sativum L.) leaves. Energy Conversion and Management, 52, 1449-1453. http://dx.doi.org/10.1016/j.enconman.2010.10.007
- Soysal, Y. (2004). Microwave drying characteristics of parsley. Biosystems Engineering, 89(2), 167-173. http://dx.doi.org/10.1016/j.biosystemseng.2004.07.008
- Zhang, M., Tang, J., Mujumdar, A. S., & Wang, S. (2006). Trends in microwave-related drying of fruits and vegetables. Trends in Food Science and Technology, 17(10), 524-534. http://dx.doi.org/10.1016/j.tifs.2006.04.011
Publication Dates
-
Publication in this collection
30 May 2014 -
Date of issue
June 2014
History
-
Received
11 Mar 2014 -
Accepted
15 Apr 2014