A Simplified Approach for Beat Frequency Oscillation Analysis in DC Microgrids
ABSTRACT
This paper investigates beat frequency oscillations in dc microgrids, which occur due to switching frequency mismatches between cascaded converters. These oscillations can be aggravated by non-synchronized sampling in control systems, leading to stability and performance issues. The study introduces a simplified transfer function model that relates beat frequency disturbances to output voltage oscillations. Unlike previous methods, this approach allows for systematic analysis using Bode diagrams, providing a clear understanding of the mechanisms behind these disturbances. The analysis evaluates three configurations—ranging from a baseline setup to one including EMI filters and long cable feeders—using a 4.75 kW experimental prototype. The proposed model demonstrates high accuracy, with a maximum magnitude deviation of less than 2 dB up to 20 kHz. Furthermore, the model successfully predicts a critical resonance at 19.4 kHz, which amplifies oscillations by 8 V peak-to-peak. The results confirm that beat-frequency gain remains near 0 dB for frequencies below 1 kHz, while high-frequency attenuation exceeds 40 dB. Ultimately, this work offers a computationally efficient tool for stability assessment and effective filter parameter tuning in dc microgrids.
KEYWORDS
beat frequency; dc microgrids; EMI filters; high-frequency model; long dc connections
I. INTRODUCTION
The global transition toward low-carbon energy systems has accelerated the development of Technologies to efficiently integrate renewable energy sources. In this context, hydrogen produced from renewable electricity (green hydrogen) has emerged as a key energy vector for large-scale decarbonization [1], while modern infrastructure, such as data centers, increasingly demands highly efficient and reliable power distribution architectures [2], [3]. DC microgrids have gained significant attention as an enabling technology for these applications, since they reduce conversion stages and improve efficiency of integration of renewable generation, energy storage systems, power electronic converters, and emerging loads [4], [5].
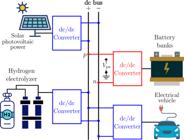
In its basic configuration, a dc microgrid consists of sources and loads connected to a common bus through dc-dc power electronic converters (PECs) [6], [7], as shown in Figure 1. These converters operate at high switching frequencies (20 to 150 kHz) [8], introducing high-frequency (HF) disturbances into the dc bus. Consequently, each converter acts as a source of HF disturbances for the others [9].
To comply with EMI/EMC (Electromagnetic Compatibility) requirements, filter stages are typically implemented at both the input and output of comercial PECs [10]. However, the interconnection of multiple reactive elements of these input/output filters creates propagation paths for HF disturbances [11]. Moreover, these paths may exhibit resonances that can be excited, potentially leading to overvoltages and overcurrents [8], [12].
Typically, the effects of these HF disturbances are not considered in controller design, as the control loop bandwidth is usually limited to frequencies below half the switching frequency. However, due to the nonlinear nature of PECs, the frequency mismatch between disturbances and the switching (or sampling) frequency generates aliased components at the difference frequency, known as beat frequency [13], [14].
When the beat frequency falls within the controller bandwidth, it can significantly degrade output voltage regulation. This is particularly critical for gridforming converters, as it may compromise microgrid stability. Furthermore, the propagation of HF voltage disturbances through the main bus can interfere with secondary control systems, especially those employing dc bus signaling techniques [15].
Previous studies have addressed this phenomenon by developing extended frequency-domain models for power converters that incorporate beat frequency effects [14], [16], [17] and by adopting harmonic state-space models [18]. However, these approaches typically result in computationally intensive models that may be impractical for system-level analysis. This paper proposes a simplified analytical approach to estimate the propagation of HF disturbances in dc microgrids. While recent studies, such as [19], have explored HF interactions using complex matrix models, which often require intensive computational effort and lack direct physical insight, the approach presented here introduces a reduced-order transfer function-based framework. This methodology provides microgrid designers with a straightforward, systematic tool for predicting beat frequency oscillations without the complexity of full-order state-space modeling.
In addition, this work clarifies the fundamental distinction between beat frequency oscillations and conventional high-frequency ripple. The experimental results show that beat frequency oscillations originate from the interaction between converters operating at slightly mismatched switching frequencies, whereas high-frequency ripple is associated with resonant phenomena involving passive elements, such as the interaction between cable impedance and EMI filter components.
The main contributions of this paper are summarized as follows: (i) A simplified analytical framework that relates beat frequency disturbances to voltage amplitude oscillations in dc microgrids through a transfer-functionbased representation. (ii) A systematic analysis of beat frequency propagation considering practical dc microgrid configurations, including EMI filters, low-pass filters, and cable interconnections. (iii) A comparative study of three operating scenarios, highlighting how reactive elements and cable impedance influence the amplification or attenuation of beat-frequency oscillations. (iv) Experimental validation using a 4.75 kW dc microgrid prototype, demonstrating the accuracy of the proposed analytical model and clarifying the distinction between beat-frequency oscillations and high-frequency resonance phenomena.
This paper extends the work previously presented at COBEP 2025 [20]. While the initial conference version focused on the preliminary characterization of the beat frequency phenomenon, the present manuscript provides a comprehensive analytical and experimental expansion. Specifically, this version includes: (i) an extensive sensitivity analysis regarding the impact of cable impedance and EMI filter parameters on system stability, which was not covered in the conference paper; (ii) a detailed derivation of the reduced-order transfer function model, now incorporating the interaction between the control bandwidth and the beat frequency components; and (iii) a scaled experimental validation using a 4.75 kW prototype, whereas the conference version was limited to theoretical analysis and lower-power simulation benchmarks. Furthermore, this version provides an explicit quantitative distinction between beat frequency oscillations and HF resonant phenomena, supported by the expanded experimental dataset. This paper is organized as follows. Section II describes the dc microgrid topology, Section III presents the proposed beat-frequency simplified analysis, Section IV shows the simulation results, Section V presents the experimental validation of the proposed approach, and Section VI concludes the paper.
II. DC MICROGRID TOPOLOGY
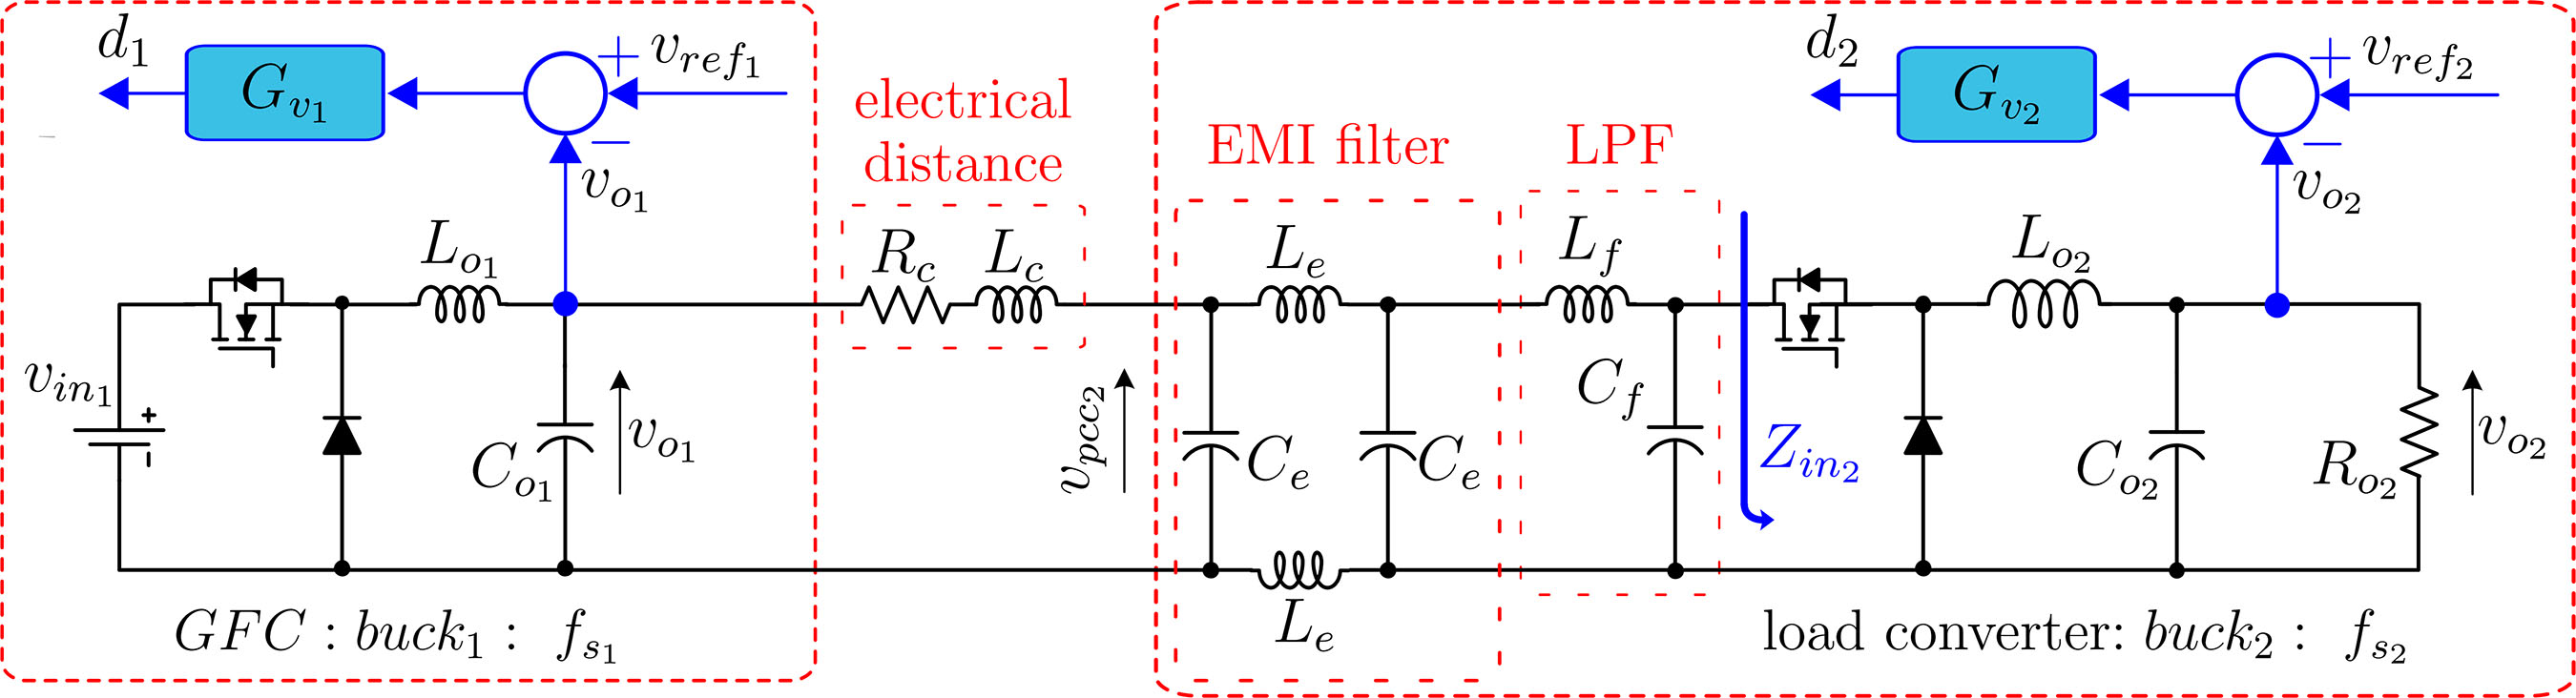
The test-case scenario involves a dc microgrid composed of two cascade-connected buck converters. The first buck converter acts as the dc grid-forming converter (GFC), while the second operates as a load converter. Figure 2 illustrates the dc microgrid, including a low-pass filter (LPF), an EMI filter, and the cable feeder, with the corresponding parameters detailed in Table 1. The parameters listed in Table 1 were selected based on standard design requirements for dc microgrid applications, ensuring a balanced trade-off between filter size, passive component ratings, and control bandwidth stability.

DC microgrid with two cascaded buck converters interconnected via a cable, an Electromagnetic Interference (EMI) filter, and a low-pass filter
Three distinct scenarios are explored: Ideal Case: Only the two cascade-connected buck converters are considered, with no filter or cabling effects. Filter-Included Case: The system incorporates both the low-pass filter (LPF) and the EMI filter. Full Model Case: The complete setup is analyzed, including the two buck converters, the LPF, the EMI filter, and the cable feeder. In this scenario, a resonance due to the interaction between the cable feeder and the EMI filter capacitors is explored; this resonance is tuned to ≈ 19.6 kHz, as derived in [8] and [21]. This approach enables a comprehensive evaluation of the system’s behavior under increasingly realistic conditions.
It is important to emphasize that the studied system serves as a representative dc microgrid architecture. In this context, the definition of a dc microgrid is supported by the physical coupling between a dc grid-forming converter and a load converter via a distributed cable feeder. This ’source-line-load’ configuration is the fundamental unit for analyzing high-frequency stability and resonant interactions, which are critical issues in dc microgrid deployment. By focusing on the dynamics of this interconnection, this work addresses the inherent challenges of integrating power converters in systems where the interaction between cable impedance and switching frequencies can compromise bus stability, regardless of the presence of more complex hierarchical control layers [8].
III. BEAT FREQUENCY SIMPLIFIED ANALYSIS
The analysis considers a scenario in which the converters operate at different switching frequencies. In this configuration, the GFC switching frequency (fs1) establishes the system reference frequency, while the load converter’s switching frequency (fs2) is intentionally varied as an independent perturbation parameter. The difference between their frequencies must fall within the Nyquist frequency range, that is, it should be less than half the switching frequency of the GFC, as shown in (1).
It is important to clarify that the beat frequency phenomenon is physically triggered by the interaction between power converters operating with mismatched switching frequencies. The resulting low-frequency oscillation is inherent to the power stage interconnection. However, in digital control systems, the sampling process plays a crucial role: because the beat frequency component often falls below the Nyquist frequency, it is aliased into the control bandwidth. Thus, while the oscillation originates in the power stage, the sampling process allows it to be processed, and potentially amplified, by the digital controller, significantly impacting system stability [14], [22].
Figure 3 shows the analyzed small-signal beat-frequency circuit model for the ideal scenario.

There is one beat frequency disturbance caused by the switching behavior of the load converter. Although the load converter is at fs2, during the sampling process, when vo1 is sampled by the first converter at fs1, the aliasing effect introduces a new component: the beating frequency, defined as:
The signal vADC(fb) is a sampled high-frequency component that acts as the source of the beating perturbation, so the transfer function that directly links the beat frequency disturbances, vˆADC(fb), to the voltage amplitude oscillations, vˆo1(fb), is given in (3). Here Gvd1 represents the duty-cycle-to-output-voltage transfer function of the GFC. Its formulation differs from conventional approaches by explicitly incorporating the influence of output-connected components.
The transfer function Gvd1 is derived through smallsignal analysis of the circuit shown in Figure 3, yielding to (4). Where: Zin2 is the closed-loop input impedance of the load converter, whose formulation depends on the load converter topology, filter stages, and controller. For the case of buck converters, the corresponding formulation is (5).
The term D2 represents the steady-state duty cycle of the load converter, defined as the ratio of the switch-on time to the total switching period.
The formulation of the transfer function Gvd1 is modified to reflect the specific configuration of each studied scenario, incorporating the respective system dynamics. Figure 4 shows the analyzed small-signal beat-frequency circuit model for the filter-included scenario.

For the filter-included scenario Gvd1 is given by (10).

Figure 5 shows the analyzed small-signal beatfrequency circuit model for the full model scenario.
And for the full model scenario Gvd1 is given by (11).
To analyze these transfer functions, i.e., eqs (4), (10) and (11), the Bode diagrams are plotted and systematically compare beat frequency responses across the three scenarios. Figure 6 shows the beat frequency response for the ideal scenario (blue plot), the filter-included scenario (red plot), and for the full model scenario (yellow plot).

This analysis underscores the model’s effectiveness in characterizing high-frequency disturbance propagation, particularly in visualizing the resonant phenomenon near 20 kHz. Examination of the phase responses indicates that, beyond f = 10 kHz, the phase no longer reflects the model behavior, as the system response is dominated by the digital controller.
The results highlight critical resonance frequencies and attenuation trends, demonstrating the influence of filters and cabling on system dynamics. The attenuation effect becomes evident around f = 300 Hz, where the filter noticeably modifies the response. Apart from the resonance near 20 kHz, attributed to the interaction between the cable feeder and the EMI filter capacitors, the filter-included and full-model cases exhibit nearly identical behavior
The analytical model is derived based on the Nyquist–Shannon sampling theorem. While the model is theoretically bounded by half the switching frequency (fs/2), its accuracy tends to exhibit a progressive degradation as frequencies approach this limit. Beyond this threshold, the frequency response is significantly impacted by aliasing and non-linear switching effects, which are excluded from the scope of this small-signal analysis.
IV. SIMULATION RESULTS
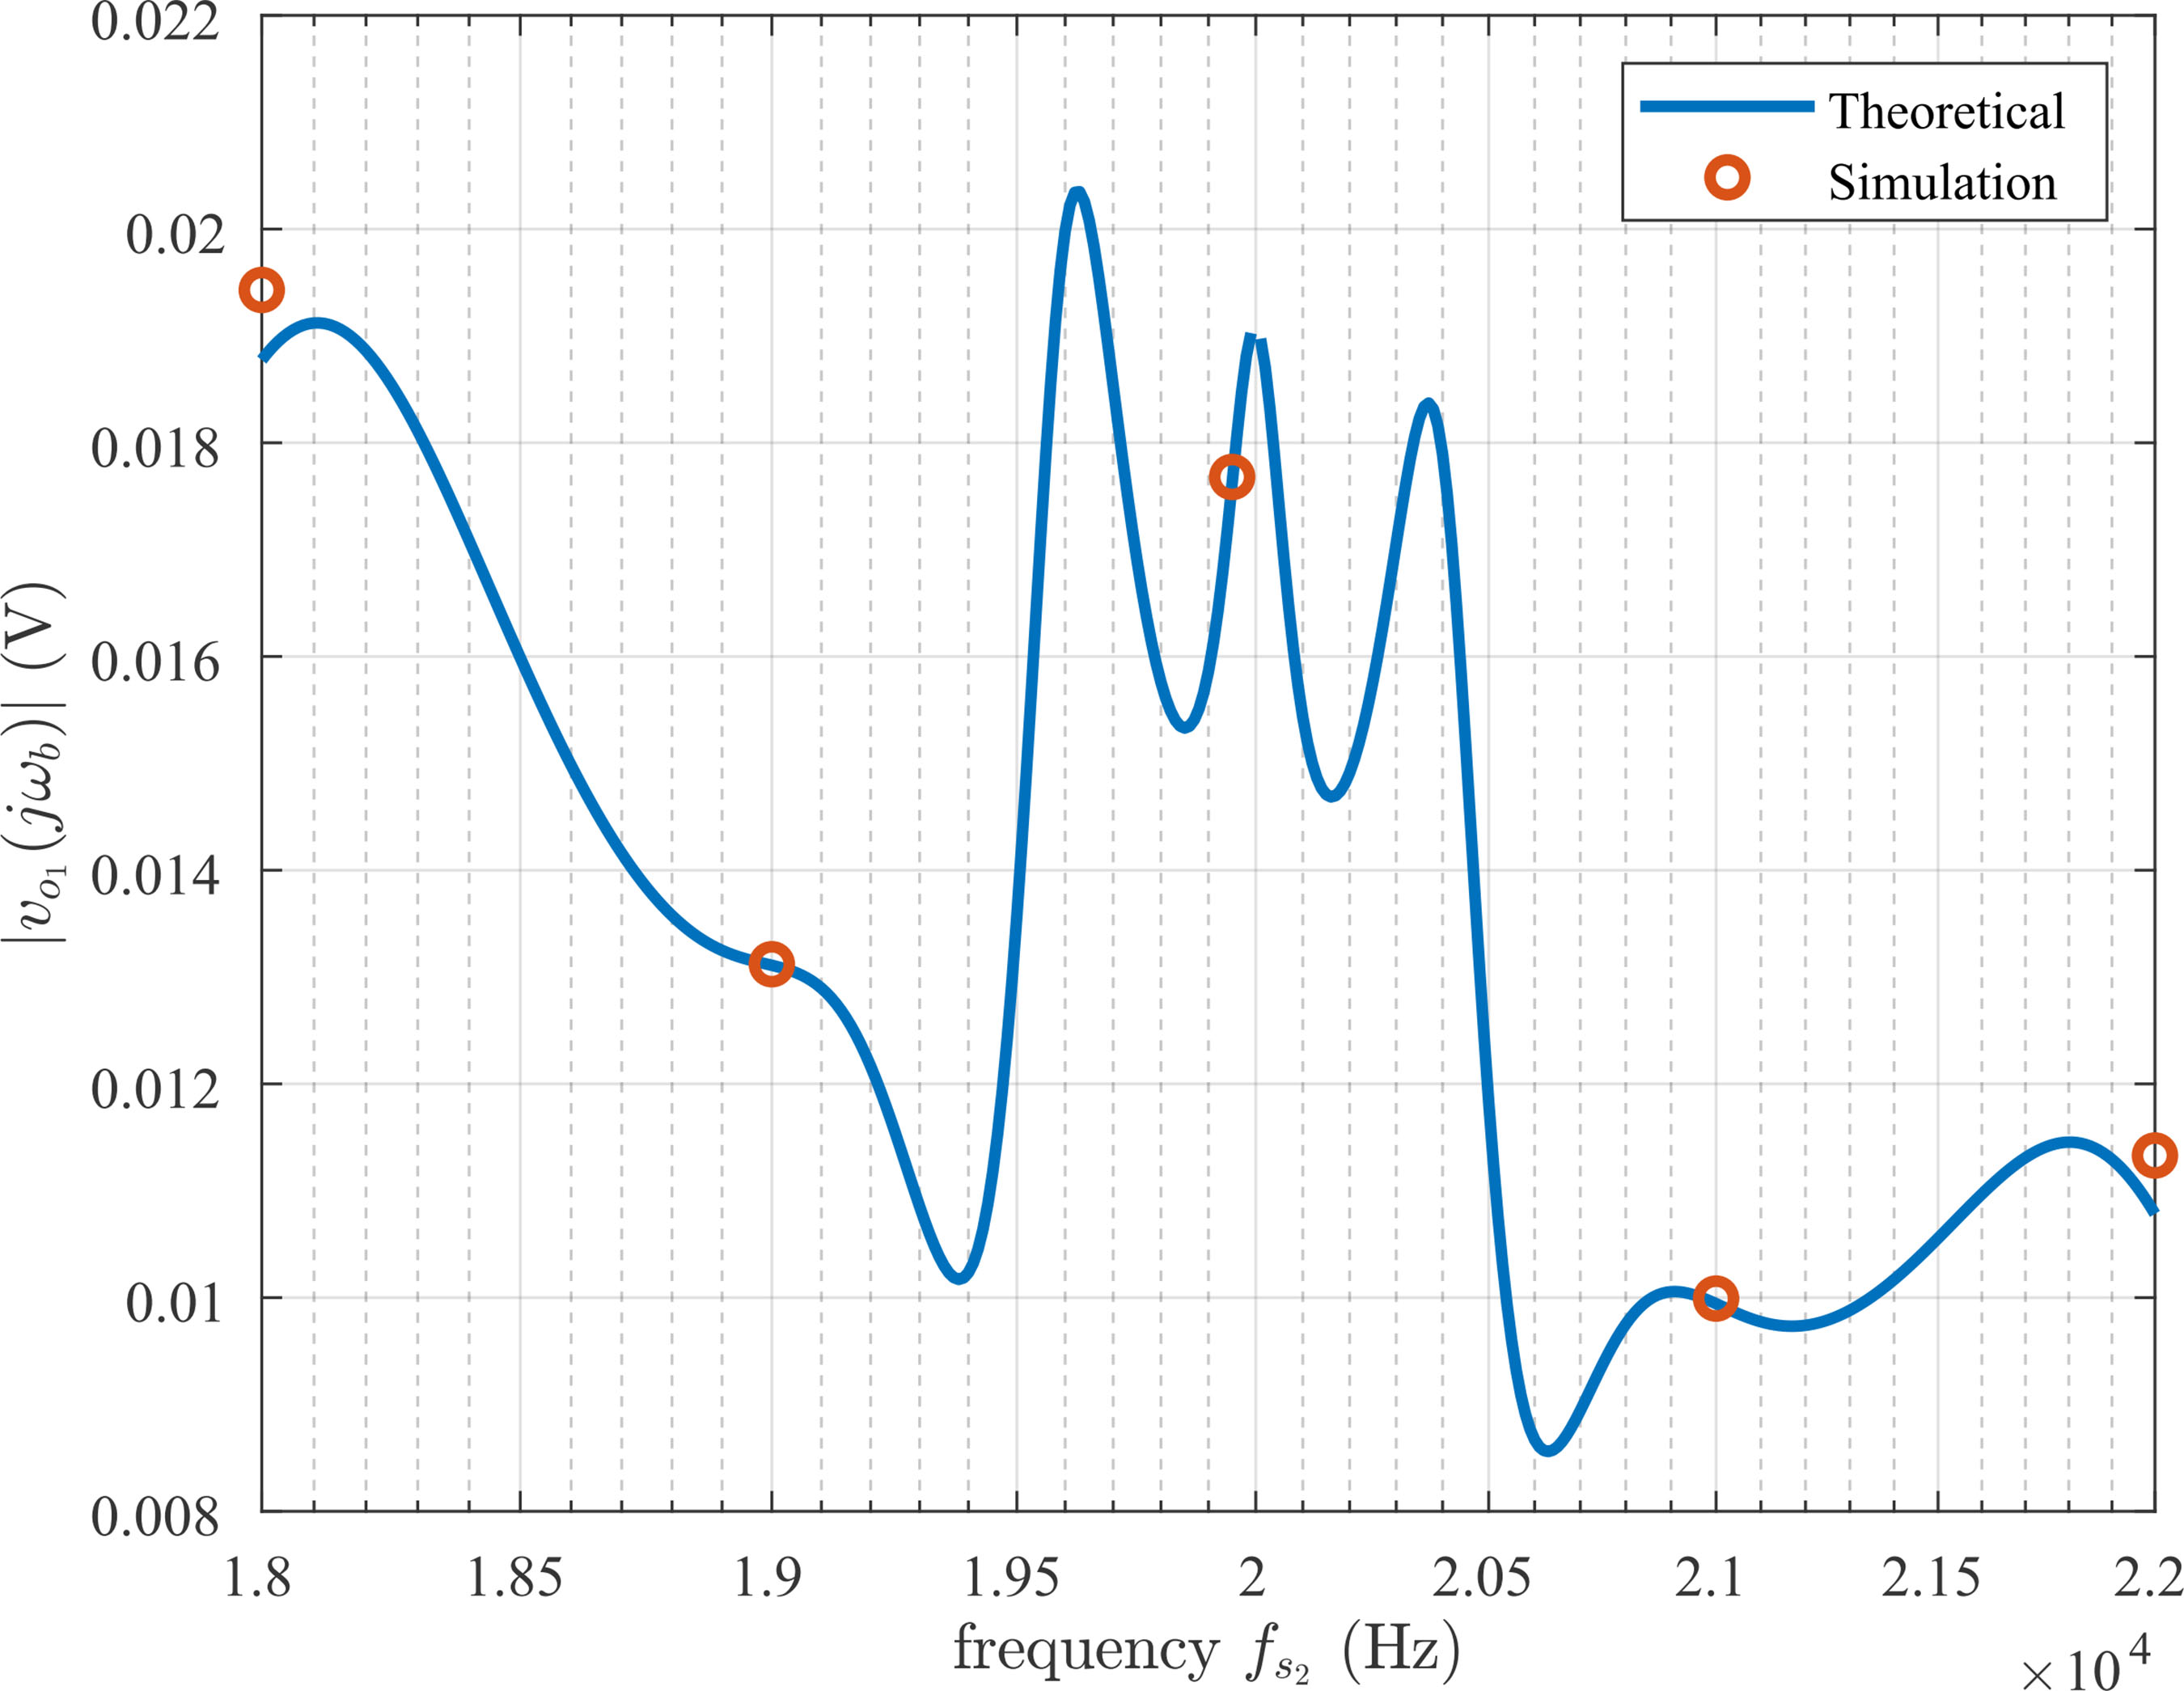
Based on the high-frequency beating model presented in [19], Figure 7 shows a comparative analysis between the theoretical and simulated amplitude of the GFC output voltage at the beat frequency vo1(fb) for the ideal scenario.

Theoretical and simulated results for the HF ripple at output voltage of the grid-forming converter vo1(fb), for the ideal scenario.
The evaluation spans a frequency sweep of the load converter’s switching frequency from fs2 = 18 kHz to fs2 = 22 kHz, while maintaining the GFC switching frequency constant at fs1 = 20 kHz. Figures 8 and 9 extend this comparison to the filter-included scenario and full system model, respectively, demonstrating the impact of additional components on beat frequency behavior.

Theoretical and simulated results for the HF ripple at output voltage of the grid-forming converter vo1(fb), for the filter-included scenario.

Theoretical and simulated results for the HF ripple at output voltage of the grid-forming converter vo1(fb), for the full model scenario.
This comparative analysis reveals significant differences in beat frequency behavior across the studied scenarios. When comparing the ideal case with the filterincluded configuration, the implemented filters demonstrate excellent mitigation performance, resulting in substantially reduced voltage amplitude oscillations. However, the full model scenario raises a critical concern: the resonant interaction between the cable feeder and the load converter’s EMI filter capacitors results in pronounced voltage amplification near the resonance frequency. This phenomenon may potentially compromise dc bus power quality and system stability.

V. EXPERIMENTAL RESULTS
To validate the high-frequency phenomena, a 4.75 kW experimental setup is implemented, as illustrated in Figure 10. The corresponding circuit diagram is presented in Figure 2, and the system parameters are summarized in Table 2.
Out of the three scenarios considered, only the ideal configuration and the full model were experimentally validated. Figure 11 presents the dc bus voltage ripple for the ideal scenario, in which the load converter is not switching and, therefore, no beat frequency is expected. In the oscilloscope traces, the GFC output voltage ripple is displayed on channel 4 (purple, 500 mV/div, offset 190), with the time base set to 10 ms.
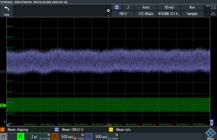
DC bus voltage ripple experimental result for the ideal scenario and load converter off. CH4(purple): dc bus voltage ripple; CH3(orange): load converter output voltage ripple.
As observed in Fig. 11, when the load converter is not switching, no additional influence appears at the GFC output voltage. Consequently, the observed ripple is determined solely by the intrinsic characteristics of the GFC components.
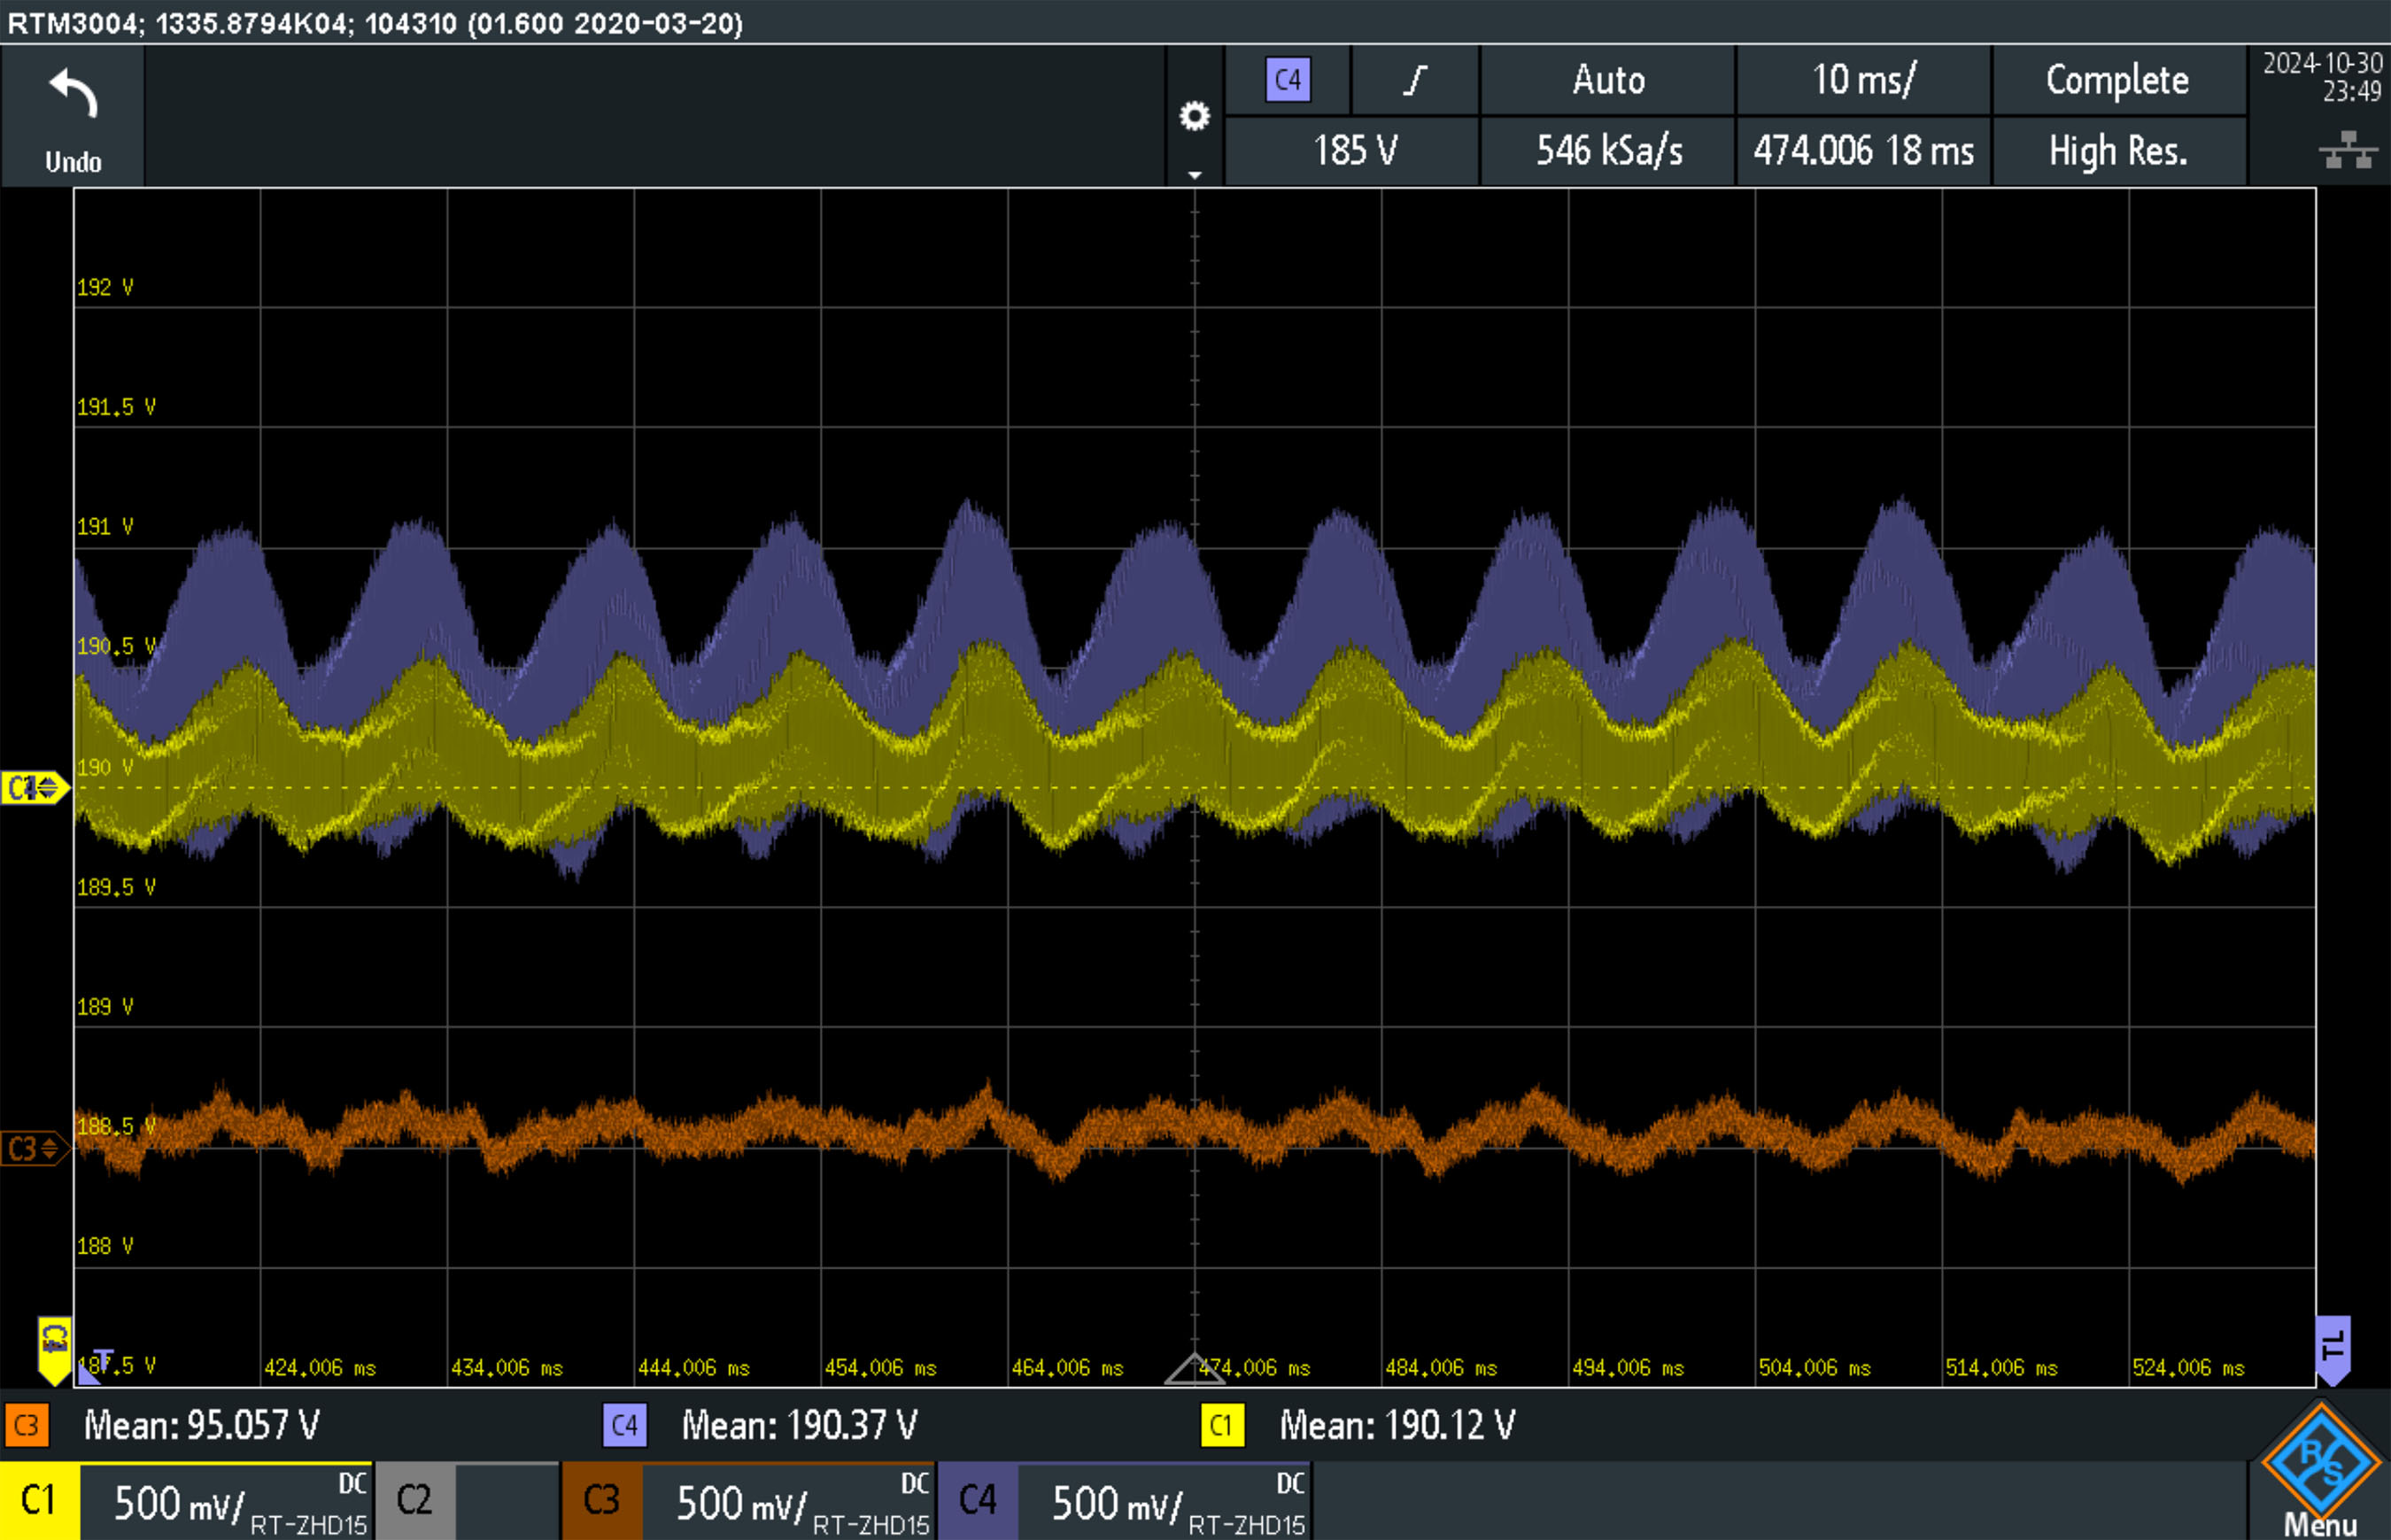
Figure 12 presents the dc bus voltage ripple for the ideal scenario, where the load converter operates with a switching frequency of fs2 = 19.9 kHz, resulting in a beat frequency of fb = 100 Hz. In the oscilloscope traces, the GFC output voltage ripple is shown on channel 4 (purple, 500 mV/div, offset of 190), the load converter input voltage ripple is shown on channel 1 (yellow, 500 mV/div, offset of 190), while the load converter output voltage ripple is shown on channel 3 (orange, 500 mV/div, offset of 95). The time base is set to 10 ms.

DC bus voltage ripple experimental result for the ideal scenario with fb = 100 Hz. CH4(purple): dc bus voltage ripple; CH3(orange): load converter output voltage ripple; CH1(yellow): load converter input voltage ripple.
Figure 12 shows the occurrence of a low-frequency component in the GFC output voltage. This component matches exactly the 100 Hz difference between the converters’ switching frequencies. The observation aligns with the predicted behavior of beat frequency phenomena in power electronic systems, as discussed earlier, in which minor discrepancies in switching frequencies can generate noticeable low-frequency oscillations.
To mitigate the beating effect, filters are implemented. Nonetheless, to investigate the high-frequency coupling between the cable feeder and EMI filter capacitors, the cable inductance is deliberately set so that the resulting resonance frequency aligns with the GFC switching frequency.
Figure 13 presents the experimental waveforms of the dc bus voltage ripple for the full model scenario and no switching of the load converter. The ripple at the GFC output voltage appears on channel 4 (purple, 2 V/div, offset of 185), while the ripple at PCC2 is displayed on channel 3 (orange, 2 V/div, offset of 185). The inductor current is on channel 2 (green, 5 A/div), with the time base set to 50 ms.

DC microgrid voltage ripple experimental result for the full model scenario and load converter off. CH4(purple): dc bus voltage ripple; CH3(orange): PCC2 voltage ripple; CH2(green):inductor current
Figure 13 shows the dc bus voltage waveforms under the influence of the HFR when the load converter is inactive. In the absence of load converter switching, it is evident that the observed resonance stems solely from the interaction between the filter and the cable, rather than from any switching behavior of the load. At PCC2, a noticeable voltage oscillation appears, which results from the resonance between the cable feeder and the EMI filter capacitors. The cable feeder inductance was adjusted to Lc = 108.4 µH, resulting in a resonance frequency of approximately 19.4 kHz, close to the GFC’s switching frequency. The peak-to-peak voltage at PCC2 reaches about 8 V.
Figure 14 shows the experimental waveforms of the dc bus voltage ripple for the full-model scenario with the load converter operating. The ripple at the GFC output voltage is observed on channel 4 (purple, 2 V/div, offset 185), while the ripple at PCC2 is displayed on channel 3 (orange, 2 V/div, offset 185). The inductor current is measured on channel 2 (green, 5 A/div). The time base is set to 50 µs.

DC microgrid voltage ripple experimental result for the full model scenario and load converter on. CH4(purple): dc bus voltage ripple; CH3(orange): PCC2 voltage ripple; CH2(green):inductor current
Figure 14 presents the dc bus voltage waveforms under the influence of the HFR when the load converter is operating. Despite the load converter’s switching activity, the resonance resulting from the interaction between the EMI filter and the cable is still clearly observed. Although a resistive load is expected to attenuate resonance, the phenomenon persists. Even with a load of approximately ≈ 360 W, the peak-to-peak voltage measured at PCC2 remains around 8 V.
VI. CONCLUSION
This paper presented a simplified transfer-function-based approach for analyzing beat frequency oscillations in dc microgrids. The proposed model provides a direct relationship between converter switching mismatches and dc bus voltage oscillations, enabling systematic frequencydomain stability assessment via Bode diagrams. The frequency response obtained with the proposed simplified model closely matched the full beat-frequency model, showing a maximum magnitude deviation below 2 dB within the frequency range of interest (up to 20 kHz). This high accuracy was verified by the 4.75 kW experimental prototype, where the model successfully predicted the dominant resonant peaks observed in the time-domain voltage waveforms. Bode analysis revealed that for frequencies below 1 kHz, the beat-frequency gain remains near 0 dB, confirming that disturbances propagate with minimal attenuation. Conversely, for higher frequencies, the system provides progressive attenuation reaching over 40 dB near the switching frequency. Furthermore, the analysis identified a critical resonant frequency at approximately 19.4 kHz, resulting from the interaction between the cable inductance (Lc = 108.4 µH) and the EMI filter capacitance, which amplifies the beat frequency oscillations by approximately 8 V peak-to-peak compared to the ideal case. The comparison among the three analyzed scenarios quantified the impact of passive elements on disturbance propagation. While the filter-included configuration provides a substantial reduction in low-frequency voltage ripple, the inherent coupling between cable inductance and filter elements introduces HF resonances that must be mitigated. Experimental results clearly distinguished the physical origins of beat-frequency oscillations from conventional resonance: the former originates from converter switching mismatches, whereas high-frequency resonance is primarily driven by passive component interactions. Overall, the proposed simplified approach offers a practical tool for evaluating the propagation of disturbances in dc microgrids, enabling designers to identify potential resonance conditions and to optimize filter design, cable sizing, and switching frequency coordination. This capability contributes to improving stability and power quality in modern converter-dominated dc energy systems. Finally, although this study focuses on primary converter-level interactions, future work will extend this framework to incorporate hierarchical control structures, such as droop control, to investigate the coupling between primary converter dynamics and secondary network-level control loops.
ACKNOWLEDGMENT
This work was funded by the São Paulo Research Foundation (FAPESP) under grants 2016/08645-9, 2021/11258-5 and 2024/17636-0, by the National Council for Scientific and Technological Development (CNPq) under grants #200990/2022-5, #303859/2020-2, financed in part by the Coordenação de Aperfeiçoamento de Pessoal de Nivel Superior – Brasil (CAPES) – Finance Code 001 and it was developed under the Electricity Sector Research and Development Program PD-000633058/2019 - PA3058: ”MERGE - Microgrids for Efficient, Reliable and Greener Energy”, regulated by the National Electricity Agency (ANEEL in Portuguese), in partnership with CPFL Energia (Local Electricity Distributor).
PLAGIARISM POLICY
DATA AVAILABILITY
The data used in this research is available in the body of the document.
REFERENCES
-
1 M. Nasser, T. F. Megahed, S. Ookawara, H. Hassan, “A review of water electrolysis–based systems for hydrogen production using hybrid/solar/wind energy systems”, Environmental Science and Pollution Research, vol. 29, no. 58, pp. 86994–87018, 2022, doi:10.1007/s11356-022-23323-y.
» https://doi.org/10.1007/s11356-022-23323-y -
2 W. Qi, J. Li, Y. Liu, C. Liu, “Planning of Distributed Internet Data Center Microgrids”, IEEE Transactions on Smart Grid, vol. 10, no. 1, pp. 762–771, 2019, doi:10.1109/TSG.2017.2751756.
» https://doi.org/10.1109/TSG.2017.2751756 -
3 C. C. Thompson, P. E. Konstantinos Oikonomou, A. H. Etemadi, V. J. Sorger, “Optimization of Data Center Battery Storage Investments for Microgrid Cost Savings, Emissions Reduction, and Reliability Enhancement”, IEEE Transactions on Industry Applications, vol. 52, no. 3, pp. 2053–2060, 2016, doi:10.1109/TIA.2016.2517149.
» https://doi.org/10.1109/TIA.2016.2517149 -
4 A. Micallef, J. M. Guerrero, J. C. Vasquez, “New Horizons for Microgrids: From Rural Electrification to Space Applications”, Energies, vol. 16, no. 4, 2023, doi:10.3390/en16041966.
» https://doi.org/10.3390/en16041966 -
5 M. Ali, J. C. Vasquez, J. M. Guerrero, Y. Guan, N. Bazmohammadi, “Microgrid an Energy Solution for Remote Islanded Communities in Indonesia”, in 2024 IEEE 10th International Power Electronics and Motion Control Conference (IPEMC2024-ECCE Asia), pp. 3799–3804, 2024, doi:10.1109/IPEMC-ECCEAsia60879.2024.10567531.
» https://doi.org/10.1109/IPEMC-ECCEAsia60879.2024.10567531 -
6 J. C. U. Pena, J. A. A. Silva, M. P. Dias, D. P. Damasceno, L. H. S. Santos, J. A. Pomilio, “Droop-based Control Strategy to operate a DC Nanogrid under the Net Zero Energy Concept”, Eletrônica de Potência, vol. 30, p. e202529, Mar. 2025, doi:10.18618/REP.e202529.
» https://doi.org/10.18618/REP.e202529 -
7 T. Dragičević, X. Lu, J. C. Vasquez, J. M. Guerrero, “DC Microgrids—Part II: A Review of Power Architectures, Applications, and Standardization Issues”, IEEE Transactions on Power Electronics, vol. 31, no. 5, pp. 3528–3549, 2016, doi:10.1109/TPEL.2015.2464277.
» https://doi.org/10.1109/TPEL.2015.2464277 -
8 J. A. Pomilio, A. F. Hernandes, D. P. Damasceno, M. P. Dias, J. I. Yutaka Ota, G. Ortenzi, R. K. Carneiro, “High-Frequency Interactions Among Power Converters in Built-in dc Networks”, in 2023 IEEE International Conference on Electrical Systems for Aircraft, Railway, Ship Propulsion and Road Vehicles International Transportation Electrification Conference (ESARS-ITEC), pp. 1–6, 2023, doi:10.1109/ESARSITEC57127.2023.10114908.
» https://doi.org/10.1109/ESARSITEC57127.2023.10114908 -
9 X. Yue, M. Högrud, “Beat Frequency Oscillation Analysis for Voltage Regulators in Telecom Power System”, in 2022 IEEE Applied Power Electronics Conference and Exposition (APEC), pp. 2135–2140, 2022, doi:10.1109/APEC43599.2022.9773498.
» https://doi.org/10.1109/APEC43599.2022.9773498 -
10 R. Erickson, D. Maksimovic, Fundamentals of Power Electronics, 01 2020, doi:10.1007/978-3-030-43881-4.
» https://doi.org/10.1007/978-3-030-43881-4 -
11 Y. Huangfu, S. Pang, B. Nahid-Mobarakeh, L. Guo, A. K. Rathore, F. Gao, “Stability Analysis and Active Stabilization of On-board DC Power Converter System with Input Filter”, IEEE Transactions on Industrial Electronics, vol. 65, no. 1, pp. 790–799, 2018, doi:10.1109/TIE.2017.2703663.
» https://doi.org/10.1109/TIE.2017.2703663 -
12 P. Sbabo, L. Stojanović, P. Mattavelli, G. Spiazzi, “Enhancing Stability of Dual Active Bridge Converters with a Long Input Cable”, in 2024 IEEE Applied Power Electronics Conference and Exposition (APEC), pp. 2697–2704, 2024, doi:10.1109/APEC48139.2024.10509055.
» https://doi.org/10.1109/APEC48139.2024.10509055 -
13 X. Yue, F. Zhuo, S. Yang, Y. Pei, H. Yi, “A MatrixBased Multifrequency Output Impedance Model for Beat Frequency Oscillation Analysis in Distributed Power Systems”, IEEE Journal of Emerging and Selected Topics in Power Electronics, vol. 4, no. 1, pp. 80–92, 2016, doi:10.1109/JESTPE.2015.2468051.
» https://doi.org/10.1109/JESTPE.2015.2468051 -
14 X. Yue, D. Boroyevich, F. C. Lee, F. Chen, R. Burgos, F. Zhuo, “Beat Frequency Oscillation Analysis for Power Electronic Converters in DC Nanogrid Based on Crossed Frequency Output Impedance Matrix Model”, IEEE Transactions on Power Electronics, vol. 33, no. 4, pp. 3052–3064, 2018, doi:10.1109/TPEL.2017.2710101.
» https://doi.org/10.1109/TPEL.2017.2710101 -
15 F. Li, Z. Lin, H. Xu, R. Wang, “A Review of DC Bus Signalling Control Methods in DC Microgrids”, in 2022 IEEE International Power Electronics and Application Conference and Exposition (PEAC), pp. 1286–1291, 2022, doi:10.1109/PEAC56338.2022.9959577.
» https://doi.org/10.1109/PEAC56338.2022.9959577 -
16 J. Lin, M. Su, Y. Sun, X. Li, S. Xie, G. Zhang, F. Blaabjerg, J. Feng, “Accurate Loop Gain Modeling of Digitally Controlled Buck Converters”, IEEE Transactions on Industrial Electronics, vol. 69, no. 1, pp. 725–739, 2022, doi:10.1109/TIE.2021.3050389.
» https://doi.org/10.1109/TIE.2021.3050389 -
17 Y. Jiang, Y. Sun, J. Lin, S. Xie, M. Su, Y. Liu, “Unified Extended-Frequency Model of Buck Converters Under Different Carriers”, IEEE Transactions on Industrial Electronics, vol. 70, no. 4, pp. 4108–4119, 2023, doi:10.1109/TIE.2022.3179561.
» https://doi.org/10.1109/TIE.2022.3179561 -
18 J. K. Motwani, Y. Xue, A. Nazari, D. Dong, I. Cvetkovic, D. Boroyevich, “Modeling of Power Electronics Systems and PWM Modulators in Harmonic-State Space”, IEEE Open Journal of Power Electronics, vol. 3, pp. 689–704, 2022, doi:10.1109/OJPEL.2022.3205893.
» https://doi.org/10.1109/OJPEL.2022.3205893 -
19 D. P. Damasceno, P. Sbabo, M. P. Dias, J. C. U. Peña, J. F. Guerreiro, P. Mattavelli, J. A. Pomilio, “DC Bus Voltage HighFrequency Disturbances Analysis for DC Microgrids With Long Connections”, IEEE Open Journal of Power Electronics, vol. 6, pp. 371–382, 2025, doi:10.1109/OJPEL.2025.3540347.
» https://doi.org/10.1109/OJPEL.2025.3540347 -
20 D. P. Damasceno, J. C. Ugaz Peña, M. P. Dias, D. I. Brandao, J. A. Pomilio, “A Simplified Approach for High-Frequency Disturbance Propagation in DC Microgrids”, in 2025 Brazilian Power Electronics Conference (COBEP), pp. 1–6, 2025, doi:10.1109/COBEP66423.2025.11231631.
» https://doi.org/10.1109/COBEP66423.2025.11231631 -
21 D. P. Damasceno, M. P. Dias, J. C. U. Peña, J. A. Pomilio, “Impedance-Based Stability Analysis of DC Microgrid Feedforward-Controlled Connected Converters”, in 2024 IEEE 9th Southern Power Electronics Conference (SPEC), pp. 1–6, 2024, doi:10.1109/SPEC62217.2024.10893257.
» https://doi.org/10.1109/SPEC62217.2024.10893257 - 22 S. Buso, P. Mattavelli, Digital Control in Power Electronics, 2 ed., Springer Cham, Padova, IT, 2015.