A study to renew water distribution networks and lines with the application of a structural vulnerability index in Joinville, Santa Catarina
ABSTRACT
Reducing losses in water distribution systems is a global objective. In Brazil, the new legal framework for sanitation sets a goal of 25% losses by 2033, while recent national data still indicate loss levels of around 40% in distribution systems. Joinville, in Santa Catarina, has total losses of 41.8% in its water supply system (28.5% were real losses and 13.3% were apparent losses in 2022). This highlights the need for structured investment planning focused on infrastructure renewal. This study applies performance indicators developed by the International Water Association to calculate an Infrastructure Vulnerability Index for water distribution infrastructure and rank operational sectors in Joinville’s R02 water supply system according to their structural vulnerability. The analysis is based on 510 maintenance records (139 network repairs and 371 service line repairs) between December 2022 and December 2023, combined with network and service line inventories for seven operational sectors. The resulting infrastructure vulnerability indices range from 8.1 (“Fair”) to 22.2 (“Very poor”), with the highest values observed in booster pumping sectors operating under elevated pressure conditions, which together account for only 6% of the total network but concentrate the worst vulnerability levels. These findings identify priority areas for the replacement and renewal of networks and service lines. The findings also show, in a real operational context, how infrastructure vulnerability index-based diagnoses, integrated with geospatial analysis, can support more efficient investment planning for reduced losses in Brazilian water utilities.
Keywords:
indicators; infrastructure; water loss; sanitation; operational sectors
RESUMO
A redução de perdas em sistemas de distribuição de água é um objetivo mundial. No Brasil, o novo marco legal do saneamento estabelece a meta de 25% de perdas até 2033, enquanto dados nacionais recentes ainda indicam níveis em torno de 40% nos sistemas de distribuição. Joinville, em Santa Catarina, apresenta perdas totais de 41,8% em seu sistema de abastecimento de água (28,5% de perdas reais e 13,3% de perdas aparentes em 2022), o que evidencia a necessidade de um planejamento estruturado de investimentos voltado à renovação da infraestrutura. Este trabalho aplicou indicadores de desempenho desenvolvidos pela International Water Association (IWA) para calcular o Índice de Vulnerabilidade da Infraestrutura (IVU) de distribuição de água e ordenar os setores operacionais do sistema R02 conforme sua vulnerabilidade estrutural. A análise baseou-se em 510 registros de manutenção (139 reparos em redes e 371 reparos em ramais) entre dezembro de 2022 e dezembro de 2023, associados ao cadastro de redes e ramais em sete setores operacionais. Os IVUs calculados variaram de 8,1 (“Regular”) a 22,2 (“Muito ruim”), com os maiores valores observados em setores com sistemas de bombeamento tipo booster operando em condições de pressão elevadas, que representam apenas 6% da extensão total de rede, mas concentram os piores níveis de vulnerabilidade. Os resultados permitem identificar áreas prioritárias para a substituição e renovação de redes e ramais e demonstram, em um contexto operacional real, como diagnósticos baseados no IVU, integrados à análise geoespacial, podem apoiar um planejamento mais eficiente de investimentos para a redução de perdas reais em companhias de saneamento brasileiras.
Palavras-chave:
indicadores; infraestrutura; perdas de água; saneamento; setores operacionais
INTRODUCTION
Sanitation challenges, especially the distribution of drinking water, continue to play a central role in discussions on infrastructure and public policy locally and worldwide. In Brazil, losses in water distribution systems are a continuing concern, not only because of the significant amount of resources wasted but also the associated economic and environmental impacts. Water losses are generally classified into two main categories: real losses, resulting from leaks in networks, water mains, and service lines; and apparent losses, resulting from fraud, illegal connections, and measurement errors (Brazil, 2021; Instituto Trata Brasil; GO Associados, 2024a; Philippi Jr. and Galvão Jr., 2012). Addressing and reducing these losses is essential to increasing the efficiency of distribution systems and ensuring a more sustainable use of water resources.
The new legal framework for sanitation, introduced by Federal Law No. 14,026/2020, sets ambitious targets for the sector, including reducing water losses to 25% by 2033 and providing drinking water to 99% of the population (Brazil, 2020; Brazil SNS, 2021; Costa, 2023; Instituto Trata Brasil; GO Associados, 2024b; Puschel et al., 2023). These targets reflect the urgent need for significant advances in water supply system management and operation. However, achieving these targets is a substantial challenge, especially in regions with high water loss rates and a history of underinvestment in infrastructure renewal.
According to the National Sanitation Secretariat (Brazil, 2021), the Loss in Water Distribution Index (IPD) in Brazil is around 40.1%. This percentage is considerably far from the standards observed in many developed and several developing countries, where the rates are significantly lower. In addition, the Connection Loss Index (IPL), which measures losses in liters per day per active connection, is also high, at approximately 343.4 L/connection/day (Brazil, 2021). More recent data from the National Sanitation Information System (SNIS/SINISA, 2025), using the International Water Association (IWA) 2013 methodology (indicator IAG 2013), indicate total losses in water distribution of 34.86%, confirming that loss levels in Brazilian systems remain high and far from regulatory targets. These figures highlight the complexity and magnitude of the problem and reinforce the need for effective strategies to control and reduce losses.
The municipality of Joinville, located in the state of Santa Catarina (SC), exemplifies these challenges. According to data from Companhia Águas de Joinville, the total loss rate in the water distribution system was 41.8% in 2022, with 28.5% representing real losses and 13.3% apparent losses (Companhia Águas de Joinville, 2022). This rate, which exceeds the national average, emphasizes the urgency of interventions to improve system efficiency. The water distribution infrastructure in Joinville covers approximately 3,585 km of networks with different diameters, supported by 81 pumping stations and 13 reservoirs (Prefeitura Municipal de Joinville, 2023).
In response to this scenario, Companhia Águas de Joinville launched a Loss Reduction Program to achieve a 25% target in water distribution by 2033. Planned actions include system sectorization, pressure reduction at critical points, replacement of networks and service lines with high leakage rates, and leak detection and repair of hidden leaks (Companhia Águas de Joinville, 2022). These strategies are consistent with national and international recommendations for real loss control (Al-Washali et al., 2020; FUNASA, 2014). Nevertheless, the effectiveness of these recommendations depends on reliable diagnostic tools to prioritize interventions and optimize investment allocation in the context of limited financial resources.
Previous studies have proposed performance indicators for failure rates in water distribution networks and service lines, such as Op31 and Op32, which correlate the number of failures with network length and with the number of connections, respectively (Alegre et al., 2004; Carvalho, 2013; FUNASA, 2014). Building on these indicators, Silva Junior and Cabral (2016) developed the Infrastructure Vulnerability Index (IVU) to assess operational sectors in São Paulo, demonstrating its potential to support the prioritization of renewal investments in water distribution systems. Other authors have highlighted the importance of geoprocessing tools, sectorization strategies and advanced loss management approaches for mapping critical areas and supporting real loss control in water distribution systems (Azevedo and Saurin, 2018; Mutikanga et al., 2013; Santos, 2021). However, there is still limited empirical evidence on how IVU-based diagnoses can be integrated with geospatial analyses and operational data (e.g., pressure regimes and sectorization patterns) to guide investment planning in water utilities, particularly under the constraints imposed by the new Brazilian sanitation legal framework.
In this context, this study investigates how IVU can help prioritize network and service line replacement in the R02 water supply system of Joinville, SC, Brazil. The specific objectives are:
-
(i) calculate failure indicators for networks (Op31) and service lines (Op32) in each operational sector;
-
(ii) compute and classify IVU for these sectors; and
-
(iii) identify and discuss priority areas for infrastructure renewal, associating the results with operational conditions such as pressure regimes and sectorization patterns.
The main contribution of this work is to demonstrate, in a real operational context, how IVU-based diagnoses, combined with geospatial analysis of maintenance records, can be used to objectively rank renewal priorities in a medium-sized Brazilian city with high levels of real losses. By doing so, the study provides applied evidence on the usefulness of IVU as a decision-support tool for investment planning in water loss management under the new sanitation regulatory framework.
METHODOLOGY
Field of Study
This study was conducted in the northern region of the municipality of Joinville, SC, Brazil, served by the Reservoir 02 (R02) water supply system. This system supplies approximately 45,420 inhabitants in 15,140 households. The R02 infrastructure comprises 124.5 km of distribution network and 7,570 service lines, served by the Cubatão Water Treatment Plant. The area is subdivided into Measurement and Control District (DMC) subsystems and booster pumping subsystems, totaling seven operational micro-sectors. The location of the study area (R02) and its operational sectors is shown in Figure 1, and the main characteristics of the subsystems and infrastructure are summarized in Table 1.

Location of the R02 Water Distribution System and operational sectors in the municipality of Joinville. DMC, Measurement and Control District
Methodological Procedures for Applying the Infrastructure Vulnerability Index
The methodological procedures followed a systematic sequence of steps that included data collection, information processing, calculation of performance and fragility indicators, and computation and spatial representation of IVU, as summarized in Figure 2. First, registration data were obtained from Companhia Águas de Joinville, including the length of distribution networks and the number of service lines in each operational subsystem of the R02 system.
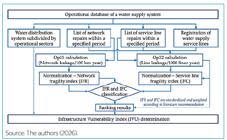
Flowchart for calculating the Infrastructure Vulnerability Index (IVU) for the R02 system.
Data Collection and Processing
Repair and maintenance data were extracted from reports generated by the Sansys corporate system, which records all service orders issued by the utility. The period analyzed extends from December 2022 to December 2023. Data collection involved identifying and compiling all service orders for leak repairs in distribution networks and service lines, categorized according to service codes defined by the system. These codes cover both proactive leak repairs and repairs caused by third-party damage.
The records were georeferenced using Quantum GIS (QGIS, version 3.422), enabling the spatial distribution of failures and their association with the operational subsystems of the R02 system. Inconsistent or duplicated records (e.g., missing coordinates, repeated order numbers) were checked against the utility’s database and either corrected or removed when validation was not possible.
Maintenance events exclusively caused by third-party damage (around 37 records in networks and service lines) were excluded from the analysis, as they do not represent intrinsic structural fragility of the water distribution infrastructure. Table 2 shows the service codes extracted from the Sansys system and their relation to the water distribution infrastructure components.
Application of Performance Indicators
After processing the data, the IWA methodology, developed in the mid-2000s, was applied. This methodology is widely recognized as a performance assessment tool for water distribution systems, allowing comparisons between systems and identification of improvement priorities (Alegre et al., 2004; Carvalho, 2013; FUNASA, 2014; Silva Junior and Cabral, 2016).
The indicators used in this study were Op31, which measures failures in distribution networks (in leaks per 100 km·year), and Op32, which measures failures in service lines (in leaks per 1,000 lines·year). These indicators are defined as follows (Equations 1 and 2), based on Alegre et al. (2004), Carvalho (2013) e FUNASA (2014):
The IWA methodology recommends reference values for Op31 and Op32, referred to as Unavoidable Real Losses or ideal loss values (Silva Junior and Cabral, 2016). The reference values adopted in this study are:
-
• Op31 ref: 13 leaks/100 km per year, with a unit flow rate of 18 m³/h (at 50 m pressure head);
-
• Op32 ref: 3 leaks/1,000 lines per year, with a unit flow rate of 3.2 m³/h (at 50 m pressure head);
Calculation of Fragility Indices
The network and service line fragility indices were calculated based on the equations proposed by Silva Junior and Cabral (2016), which express the relationship between the observed failure rates and reference values. These indices are defined as follows (Equations 3 and 4):
Network Fragility Index (IFR): reflects the structural condition of the distribution networks.
Service Line Fragility Index (IFC): reflects the structural condition of the service lines.
Calculation and Classification of the Infrastructure Vulnerability Index
The weighted combination of the IFR and IFC indices yielded IVU. IVU represents the overall structural vulnerability of the water distribution infrastructure in each operational sector. IVU was calculated according to the following Equation 5 (Silva Junior and Cabral, 2016):
Silva Junior and Cabral (2016) proposed an IVU classification to help prioritize investments and interventions in operational sectors, which was adopted in this study (Table 3).
Spatial Representation of the Infrastructure Vulnerability Index
IVU values obtained for each operational sector were represented using thematic maps and graphs generated in QGIS, highlighting the spatial distribution of maintenance events and incident density for different regions of the R02 system. This visual analysis provided additional insight into the areas most in need of intervention, evidencing sectors with the highest IVU values and helping prioritize renewal projects.
RESULTS AND DISCUSSION
Data collected from the operational sectors of the R02 system showed 139 repairs to distribution networks and 371 repairs to service lines, totaling 510 specific maintenance operations on the water supply infrastructure between December 2022 and December 2023. Damage to infrastructure caused exclusively by third parties, around 37 events in networks and service lines, was not considered in the analysis, as these occurrences do not reflect the intrinsic structural fragility of the system.
Table 4 details the distribution of maintenance activities in each operational sector. The sectors with the highest number of network repairs were DMC Carlos Willy Boehm, followed by the Non-sectorized sector and DMC Rui Barbosa. The highest numbers of service line repairs were observed in DMC Carlos Willy Boehm, DMC Vice-Mayor Luiz Carlos Garcia, and the Non-sectorized sector, reflecting significant demand for maintenance in these locations.
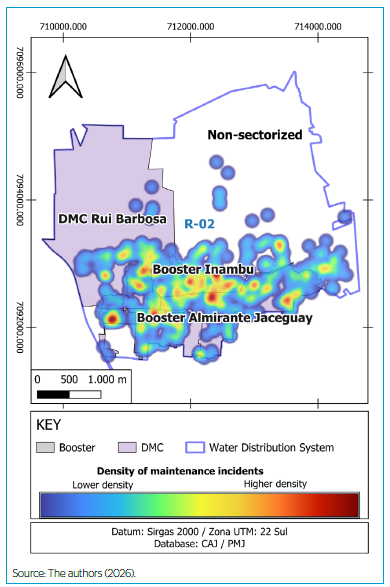
Figure 3 shows the geographical distribution of maintenance points recorded in the operational sectors of R02. Figure 4 presents a heat map of the density of maintenance incidents. Areas with the highest concentration of repairs are highlighted in dark red, with decreasing density represented in orange, yellow, green, light blue, and dark blue, within a 100-m radius. These maps indicate spatial clustering of failures in specific sectors, especially in areas under booster pumping.

Spatial distribution of maintenance points by operational sector in the R02 system. DMC; Measurement and Control District.

Heat map representing the density of maintenance incidents in the R02 system. DMC; Measurement and Control District.
The results of the performance and fragility indicators for each operational sector are presented in Table 5, including the failure indicators for networks (Op31, Equation 1) and service lines (Op32, Equation 2), IFR (Equation 3), IFC (Equation 4), and IVU (Equation 5), as well as the classification according to the categorization shown in Table 3.
Based on the data presented in Table 5, the operational sector corresponding to Booster Almirante Jaceguay had the highest IVU (22.2), classified as “Very poor”, indicating a critical structural condition and making it a priority region for network and service line renewal. The following sectors, in descending order of IVU, are Booster Inambu (18.4), DMC Albatroz (13.2), DMC Vice-Mayor Luiz Carlos Garcia (11.1), and DMC Carlos Willy Boehm (9.1). DMC Rui Barbosa (8.1) and the Non-sectorized sector (8.9) were classified as “Fair”.
Figure 5 synthesizes IVU classification in a thematic map, providing a spatial overview of vulnerability levels in the R02 system.

Spatial representation of the Infrastructure Vulnerability Index in the operational sectors of the R02 water distribution system.
Table 6 compiles registration data, number of repairs, and IVU values for each operational sector of R02, facilitating an integrated comparison among infrastructure scale, failure occurrence, and structural vulnerability.
Analysis of the water distribution infrastructure in Joinville revealed that the operational sectors of the R02 system face significant maintenance and structural vulnerability challenges. Booster Almirante Jaceguay and Booster Inambu exhibited the worst IVU values, with classifications of “Very poor” and “Poor”, respectively, indicating an urgent need for structural interventions. Together, these two sectors account for only 6% of the total network length and 10% of the service lines, but have the highest IVUs, highlighting excessive pressure and inadequate operating conditions as critical factors.
DMC Albatroz and DMC Vice-Mayor Luiz Carlos Garcia, both classified as “Poor”, also require attention, representing approximately 22% of the total network length and 26% of the service lines. In contrast, DMC Carlos Willy Boehm, DMC Rui Barbosa, and the Non-sectorized sector were rated “Fair”, reflecting an intermediate structural condition.
The results indicate that the operational sector with the least infrastructure, in terms of network extension, number of service lines, and population served (Booster Almirante Jaceguay), obtained the highest value in the proposed index. This means that a relatively small portion of the infrastructure concentrates a disproportionately high number of failures, which makes this sector a priority for renewal. From a planning perspective, this concentration suggests that a comparatively limited volume of network and service line replacement could generate significant improvements in structural condition and loss control.
In addition, the highest IVU values occurred in booster pumping networks, which operate at higher pressures to meet higher topographic elevations or to maintain adequate pressure over longer distribution distances. In such sectors, the existing infrastructure is often adapted to operate with pumping equipment specific to the region, implemented at different times and with different design criteria. This situation tends to generate recurrent leaks at specific points of the network, reinforcing the need to assess whether the network structure should be reinforced and pressure better controlled in these areas.
Similar studies in other regions confirm that sectors with high pressure and adapted infrastructure, such as those analyzed by Silva Junior and Cabral (2016) in São Paulo, SP, Brazil, tend to exhibit high IVUs, reflecting the fragility of networks under adverse operating conditions. In their study, the Vila Matilde Branch sector presented an IVU of 13.4, classified as “Poor”. In the present study, two booster sectors in R02 exceeded this level (IVU = 18.4 and 22.2), reaching “Poor” and “Very poor” vulnerability levels. This comparison highlights the severity of current operating conditions in Joinville and reinforces the importance of preventive interventions, such as installing pressure-reducing valves in critical sectors.
Santos (2021), in his analysis of a water distribution system in Jaraguá do Sul, SC, Brazil, emphasized that factors such as preventive maintenance and pipe materials directly influence failure rates. Although detailed information on pipe materials and age was not available in the present study, the correlation observed between elevated pressure regimes and high IVU values in Joinville confirms the need for careful pressure management and targeted replacement projects in the most vulnerable sectors.
The literature suggests several intervention measures to mitigate high IVU values in vulnerable sectors. Silva Junior and Cabral (2016) stress that pressure-reducing valves are effective in lowering failure rates because they reduce excessive pressure in the networks. In addition, sectorization works can limit high-pressure zones, preventing new leaks and facilitating operational control. Other recommended actions include renewing networks and service lines. Despite requiring higher investments, these interventions substantially reduce failure rates and ensure greater infrastructure lifespan. Santos (2021) reinforces the importance of preventive maintenance and the replacement of materials more susceptible to leaks, such as older or smaller-diameter pipes.
The structural fragility identified in Joinville, SC, Brazil, is also consistent with the findings of Al-Washali et al. (2020) in Yemen, who emphasized the need for multiple approaches to accurately assess the components of water losses in distribution networks to design more effective mitigation strategies. International studies have also highlighted the relevance of network structure and topology. Yazdani and Jeffrey (2011), analyzing systems in the United Kingdom, demonstrated that networks with greater connectivity and redundancy tend to be more robust in the face of failures. This suggests that interventions in critical sectors, such as Booster Almirante Jaceguay, should consider increasing structural redundancy and improving connectivity to mitigate vulnerabilities.
Laucelli and Giustolisi (2015) presented, in the Italian context, a methodology for assessing the seismic vulnerability of distribution networks, considering the probability of multiple failures and the importance of segmentation by isolation valves. Although the present study did not address seismic events, the underlying concept of identifying critical segments and using network segmentation to limit the impacts of failures is also relevant for Joinville, particularly in high-pressure sectors, which could benefit from similar approaches to improve structural resilience and avoid significant service interruptions.
The experience reported by Zhao et al. (2010) in China reinforces the importance of hydraulic modelling to identify high-risk regions in distribution networks. The use of simulations, such as EPANET and Monte Carlo methods, enabled the authors to map potential failure scenarios and assess network vulnerability under different conditions. Although hydraulic simulations were not performed in the present study, integrating IVU-based diagnoses with hydraulic models is a promising avenue for future research in Joinville, especially to explore the effects of pressure changes and sectorization on failure probabilities.
Finally, the study by Ociepa, Mrowiec and Deska (2019) in Poland showed that comprehensive monitoring, active leak control, and replacement of old pipes resulted in a substantial reduction in water losses. The authors highlighted the importance of GIS-based monitoring technologies and specialized devices for rapid leak detection. The application of similar measures in Joinville, combined with targeted renewal in high-IVU sectors, could enhance the effectiveness of interventions and optimize the use of financial resources.
In addition, studies highlight the relevance of using geotechnologies to map and analyze the vulnerability of water distribution networks. Rauen (2014) showed that geoprocessing tools help identify critical points and prioritize interventions. Tesse (2014) emphasized that sectorization is an effective practice for improving operational efficiency and reducing losses. The use of GIS in this study, to spatially represent IVU values and maintenance density, is consistent with these findings and reinforces the importance of integrating IVU-based diagnoses with geospatial analyses and sectorization strategies in real loss management programs.
CONCLUSIONS
This study applied IWA performance indicators (Op31 and Op32) and IVU to assess the structural vulnerability of water distribution networks and service lines in the R02 water supply system of Joinville, SC, Brazil. The analysis, based on 510 maintenance records between December 2022 and December 2023, revealed IVU values ranging from 8.1 (“Fair”) to 22.2 (“Very poor”), with the highest vulnerability levels concentrated in booster pumping sectors operating under elevated pressure conditions.
The results showed that Booster Almirante Jaceguay and Booster Inambu, which together account for only about 6% of total network length and 10% of service lines, concentrate the highest IVU values and therefore should be considered priority areas for network and service line replacement. Other sectors, such as DMC Albatroz and DMC Vice-Mayor Luiz Carlos Garcia, also classified as “Poor”, demand subsequent attention. DMC Carlos Willy Boehm, DMC Rui Barbosa, and the Non-sectorized area had “Fair” vulnerability levels. These findings demonstrate that structural vulnerability is not directly proportional to infrastructure size or the absolute number of repairs, but is strongly influenced by the interaction between operating conditions (especially pressure) and the structural characteristics of networks and service lines.
The study also showed that IVU is a useful tool for distinguishing sectors with similar numbers of failures but different structural vulnerability levels. It explicitly correlates the number of repairs with the extent of networks and service lines. When combined with geospatial analysis of maintenance records, IVU objectively ranked renewal priorities in the R02 system, supporting more efficient allocation of investments to reduce real losses in a context marked by ambitious regulatory targets under the new Brazilian sanitation legal framework.
This work has some limitations. The analysis was restricted to one year and did not explicitly incorporate information on pipe material, age, or detailed pressure measurements. These are known to influence failure rates. In addition, third-party damage was excluded from the calculations, which is appropriate for assessing intrinsic structural fragility but does not capture all causes of failures in the system. The study also did not include hydraulic modelling or simulation of failure scenarios, which could provide additional insights into the response of the network to changes in pressure and operating conditions.
Despite these limitations, the methodological approach of this study contributes to the applied literature on water loss management, with empirical evidence of the usefulness of IVU-based diagnoses in a real operational context and a medium-sized Brazilian city. The procedures described can be replicated in other municipalities and adapted to different regulatory and operational conditions, supporting more informed infrastructure renewal planning and real loss reduction programs.
Future research should integrate historical time series of failures, information on pipe materials and age, and detailed pressure data into IVU assessments. Hydraulic models should be created to simulate different operating scenarios and intervention strategies. By integrating IVU-based diagnoses with GIS-based monitoring, pressure management devices (such as pressure-reducing valves), and sectorization strategies, as suggested in the literature, water utilities can be better equipped to prioritize investments and evaluate the impact of actions on vulnerability levels over time.
REFERENCES
-
ALEGRE, Helena; HIRNER, Wolfram; BAPTISTA, Jaime Melo; PARENA, Renato. Indicadores de desempenho para serviços de abastecimento de água. Lisboa: Instituto Regulador de Águas e Resíduos, 2004. Available at: https://www.pseau.org/outils/ouvrages/ersar_indicadores_de_desempenho_para_servicos_de_abastecimento_de_agua_2004.pdf Accessed on: May 10, 2024.
» https://www.pseau.org/outils/ouvrages/ersar_indicadores_de_desempenho_para_servicos_de_abastecimento_de_agua_2004.pdf -
AL-WASHALI, Taha; SHARMA, Saroj; LUPOJA, Robert; AL-NOZAILY, Fadhl; HAIDERA, Mansour; KENNEDY, Maria. Assessment of water losses in distribution networks: methods, applications, uncertainties, and implications in intermittent supply. Resources, Conservation and Recycling, v. 152, 104515, 2020. https://doi.org/10.1016/j.resconrec.2019.104515
» https://doi.org/https://doi.org/10.1016/j.resconrec.2019.104515 -
AZEVEDO, Bárbara Brzezinski; SAURIN, Tarcísio Abreu. Losses in water distribution systems: a complexity theory perspective. Water Resources Management, v. 32, n. 9, p. 2919-2936, 2018. https://doi.org/10.1007/s11269-018-1976-7
» https://doi.org/https://doi.org/10.1007/s11269-018-1976-7 - BRAZIL. Ministério das Cidades. Sistema Nacional de Informações em Saneamento Básico (SINISA). Indicadores de água - resultados da coleta 2024 (anobase 2023). Brasília: Ministério das Cidades, 2025.
-
BRAZIL. Ministério da Saúde. Fundação Nacional de Saúde (FUNASA). Redução de perdas em sistemas de abastecimento de água. 2. ed. Brasília: FUNASA, 2014. Available at: https://www.gov.br/funasa/pt-br/centrais-de-conteudo/arquivos/reducao-de-perdas-em-sistemas-de-abastecimento-de-agua-2014.pdf/@@display-file/file Accessed on: May 10, 2024.
» https://www.gov.br/funasa/pt-br/centrais-de-conteudo/arquivos/reducao-de-perdas-em-sistemas-de-abastecimento-de-agua-2014.pdf/@@display-file/file -
BRAZIL. Presidência da República. Lei nº 14.0 26, de 15 de julho de 2020. Estabelece o novo marco do saneamento básico no Brasil. Available at: http://www.planalto.gov.br/ccivil_03/_ato2019-2022/2020/lei/l14026.htm Accessed on: May 10, 2024.
» http://www.planalto.gov.br/ccivil_03/_ato2019-2022/2020/lei/l14026.htm -
BRAZIL. Secretaria Nacional de Saneamento (SNS); Ministério do Desenvolvimento Regional (MDR). Panorama do saneamento básico no Brasil 2021. Brasília: MDR, 2021. Available at: https://www.gov.br/cidades/pt-br/acesso-a-informacao/acoes-e-programas/saneamento/snis/produtos-do-snis/PANORAMA_DO_SANEAMENTO_BASICO_NO_BRASIL_SNIS_2021compactado.pdf Accessed on: May 10, 2024.
» https://www.gov.br/cidades/pt-br/acesso-a-informacao/acoes-e-programas/saneamento/snis/produtos-do-snis/PANORAMA_DO_SANEAMENTO_BASICO_NO_BRASIL_SNIS_2021compactado.pdf - CARVALHO, Bruno Eustácio Ferreira Castro de. Avaliação de desempenho da prestação de serviços de abastecimento de água, independente da perspectiva do avaliador, se usuário ou prestador. 2013. Dissertação (Mestrado em Tecnologia Ambiental e Recursos Hídricos) - Universidade de Brasília, Brasília, 2013.
-
COMPANHIA ÁGUAS DE JOINVILLE (CAJ); Prefeitura Municipal de Joinville (PMJ). Plano Diretor de Água: estratégias de implantação. Joinville: Companhia das Águas de Joinville, 2022. Available at: https://www.joinville.sc.gov.br/wp-content/uploads/2022/03/Plano-Diretor-de-%C3%81gua-PDA.pdf Accessed on: May 10, 2024.
» https://www.joinville.sc.gov.br/wp-content/uploads/2022/03/Plano-Diretor-de-%C3%81gua-PDA.pdf -
COSTA, Nilson do Rosário. Política pública de saneamento básico no Brasil: ideias, instituições e desafios no século XXI. Ciência & Saúde Coletiva, v. 28, n. 9, p. 2595-2600, 2023. https://doi.org/10.1590/1413-81232023289.20432022
» https://doi.org/https://doi.org/10.1590/1413-81232023289.20432022 -
INSTITUTO TRATA BRASIL; GO ASSOCIADOS. Estudo de perdas de água de 2024 (SNIS, 2022): desafios na eficiência do saneamento básico no Brasil. São Paulo: Instituto Trata Brasil, 2024a. Available at: https://tratabrasil.org.br/wp-content/uploads/2024/06/Estudo-da-GO-Associados-Perdas-de-Agua-de-2024-V2.pdf Accessed on: May 10, 2024.
» https://tratabrasil.org.br/wp-content/uploads/2024/06/Estudo-da-GO-Associados-Perdas-de-Agua-de-2024-V2.pdf -
INSTITUTO TRATA BRASIL; GO ASSOCIADOS. Estudo sobre os avanços do novo marco legal do saneamento básico no Brasil de 2024 (SNIS, 2022). São Paulo: Instituto Trata Brasil, 2024b. Available at: https://tratabrasil.org.br/wp-content/uploads/2024/07/Estudo-da-GO-Associados-Novo-Marco-2024-Versao-Limpa.pdf Accessed on: May 10, 2024.
» https://tratabrasil.org.br/wp-content/uploads/2024/07/Estudo-da-GO-Associados-Novo-Marco-2024-Versao-Limpa.pdf -
LAUCELLI, Daniele; GIUSTOLISI, Orazio. Vulnerability assessment of water distribution networks under seismic actions. Journal of Water Resources Planning and Management, v. 141, 04014082, 2015. https://doi.org/10.1061/(ASCE)WR.1943-5452.0000478
» https://doi.org/https://doi.org/10.1061/(ASCE)WR.1943-5452.0000478 -
MUTIKANGA, Harrison; SHARMA, Saroj; VAIRAVAMOORTHY, Kalanithy. Methods and tools for managing losses in water distribution systems. Journal of Water Resources Planning and Management, v. 139, n. 2, p. 166-174, 2013. https://doi.org/10.1061/(ASCE)WR.1943-5452.0000245
» https://doi.org/https://doi.org/10.1061/(ASCE)WR.1943-5452.0000245 -
OCIEPA, Ewa; MROWIEC, Maciej; DESKA, Iwona. Analysis of water losses and assessment of initiatives aimed at their reduction in selected water supply systems. Water, v. 11, n. 5, 1037, 2019. https://doi.org/10.3390/W11051037
» https://doi.org/https://doi.org/10.3390/W11051037 - PHILLIPI JUNIOR, Arlindo; GALVÃO JUNIOR, Alceu de Castro. Gestão de perdas no saneamento básico. In: Gestão do saneamento básico: abastecimento de água e esgotamento sanitário. Barueri: Manole, 2012. p. 359-361.
-
PREFEITURA MUNICIPAL DE JOINVILLE (PMJ); MPB Engenharia; Nova Engevix Engenharia. Cartilha contendo síntese das etapas de diagnóstico e de prognóstico dos serviços de saneamento básico de Joinville. Joinville: Prefeitura de Joinville, 2023. Available at: https://www.joinville.sc.gov.br/wp-content/uploads/2023/11/Cartilha-Sintese-das-Etapas-de-Diagnostico-e-de-Prognostico-dos-Servicos-de-Saneamento-Basico-de-Joinville.pdf Accessed on: May 10, 2024.
» https://www.joinville.sc.gov.br/wp-content/uploads/2023/11/Cartilha-Sintese-das-Etapas-de-Diagnostico-e-de-Prognostico-dos-Servicos-de-Saneamento-Basico-de-Joinville.pdf - PUSCHEL, André Felipe Silva; MUNCK, Letícia Rodrigues; LAHOZ, Rodrigo Augusto Lazzari. As metas de universalização do novo marco do saneamento básico e os desafios para assegurar o equilíbrio econômico-financeiro dos contratos de programa. Revista de Direito Setorial e Regulatório, v. 9, n. 1, p. 283-312, 2023.
- SANTOS, Michel Felipe. Priorização de áreas para controle e redução de perdas reais em uma rede de distribuição de água, utilizando os métodos unicritério e multicritério para definição de riscos e mapeamento em GIS. 2021. Dissertação (Mestrado em Engenharia Ambiental) - Universidade Federal de Santa Catarina, Florianópolis, 2021.
- SILVA JUNIOR, Edison Garcia da; CABRAL, Rodrigo Chimenti. Indicador de vulnerabilidade da infraestrutura de redes de distribuição de água - uma proposta para a tomada de decisões no combate às perdas. In: SIMPÓSIO LUSO-BRASILEIRO DE ENGENHARIA SANITÁRIA E AMBIENTAL, 17., 2016, Florianópolis. Anais [...]. Florianópolis: ABES, 2016.
-
YAZDANI, Alireza; JEFFREY, Paul. Complex network analysis of water distribution systems. Chaos, v. 21, n. 1, 016111, 2011. https://doi.org/10.1063/1.3540339
» https://doi.org/https://doi.org/10.1063/1.3540339 -
ZHAO, Yuan; ZHUANG, Baoyu; ZHOU, Guangyu; ZHAO, Xinhua. Study on hydraulic vulnerability and risk assessment of water distribution system. In: CONFERENCE ON ENVIRONMENTAL SCIENCE AND INFORMATION APPLICATION TECHNOLOGY, 2., 2010, Wuhan. Anais [...]. Wuhan: IEEE, 2010. p. 576-579. Available at: https://doi.org/10.1109/ESIAT.2010.5568865 Accessed on: May 10, 2024.
» https://doi.org/10.1109/ESIAT.2010.5568865
Edited by
-
Editor:
Davi Gasparini Fernandes Cunha http://orcid.org/0000-0003-1876-3623
The datasets generated and/or analyzed during the current study are available from the corresponding author upon reasonable request.