 The Allometric Equations for Estimating the Leaf Area Index of Community Forest Tree Species
Abstract
LAI measurement using a direct method is time-consuming, while other instruments like Ceptometer, Hemispherical Photography, and LI-COR require high investment. This study aims to develop allometric equations for estimating the LAI of community forest tree species. Destructive sampling was conducted on 45 trees from three different species, i.e., Tectona grandis, Swietenia macrophylla, and Falcataria moluccana . The allometric equations were developed using regression analysis with two predictor variables, namely diameter at breast height ( D ) and tree height ( H ). LAI varied among species, wherein the highest average of LAI was recorded in S. macrophylla (1.03±0.03), followed by T. grandis (0.28±0.07) and F. moluccana (0.23±0.03). Our study found that the equation LAI = 0.01 D 1.15 was reliable as a generalized allometric equation to estimate the LAI of three species with an RMSE of 0.39. We concluded that the allometric equation could facilitate LAI estimation in community forests.
Keywords:
Efficiency;
LAI
; model; photosynthesis; reliability
INTRODUCTION AND OBJECTIVES
Leaf area index ( LAI ) is an essential parameter to assess the effectiveness of plant photosynthesis (Vyas et al., 2010 ). This parameter also strongly relates to transpiration and net primary productivity (Moualeu-Ngangue et al., 2017 ). Thus, LAI is essential in determining the growth rate and energy exchange between plants and the atmosphere. Higher LAI indicates a more extraordinary plant ability to absorb light intensity (De Mattos et al. 2020 ). LAI is also frequently measured to evaluate plant physiology over time.
In forest management, LAI can be measured using direct and indirect methods. The direct measurement is conducted by destructive sampling or using litter traps (Shin et al., 2020 ). However, the methods are challenging to implement on a large scale since they require high cost and time. Measuring LAI by destructive sampling may also reduce forest regeneration, although this method helps obtain the most accurate LAI value. Meanwhile, the indirect measurement can be done using tool kits like Hemispherical Photography, LAI-200, and Ceptometer (Hakamada et al., 2016 ). They also work more efficiently time for data acquisition (Mason et al., 2012 ) but require optimum light intensity for more precise results (Ariza-Carricondo et al., 2019 ). Unfortunately, the instruments are rarely available for farmers in community forests since they need high investment. Other alternative methods like remote sensing and terrestrial ecosystems model can also be implemented to estimate LAI (Richardson et al., 2009 ; Qu and Zhuang, 2018 ) but both methods require high analytical skill and are only applicable for a stand level. Therefore, another approach should be explored to tackle this problem, one of which is allometric equations.
Developing allometric equations becomes a realistic solution for LAI estimation since this approach has been widely used to estimate individual tree parameters (Zahabu et al. 2018 ; Istrefi et al. 2019 ; Wirabuana et al. 2020a ). The allometric equations have been widely applied in the forestry sector for quantifying biomass (Altanzagas et al., 2019 ; Romero et al., 2020 ; Sadono et al., 2021 ), carbon (Khan et al., 2018 ; Widagdo et al., 2020 ; Karyati et al., 2021 ), and crown characteristics across different forest ecosystems in the tropics and temperate (Riikonen et al., 2011 ; Coombes et al., 2019 ; Pretzsch, 2019 ). The previous study also reported that allometric equations are reliable in estimating the LAI of Tectona grandis and Dendrocalamus strictus in India (Vyas et al., 2010 ). However, developing allometric equations for LAI estimation in Indonesia has yet to be carried out, primarily in community forests with many tree species.
This study aims to develop the best allometric equations for estimating the LAI of community forest tree species. This research will address three essential questions: (i) What is the reliability of allometric equations in estimating LAI variation in the study site? (ii) what are the best allometric equations for estimating the LAI of each community forest tree species? Moreover, (iii) can these best equations be simplified into a single reliable model for all species? We hypothesize that (i) at least 60% LAI variation in every species can be explained using the selected equations, (ii) the best allometric equation for every species was relatively different, and (iii) the best-selected model for every species can not be simplified into a single reliable model. The result provides an instrument for community forest managers to estimate LAI more efficiently in time and cost.
MATERIALS AND METHODS
Study site
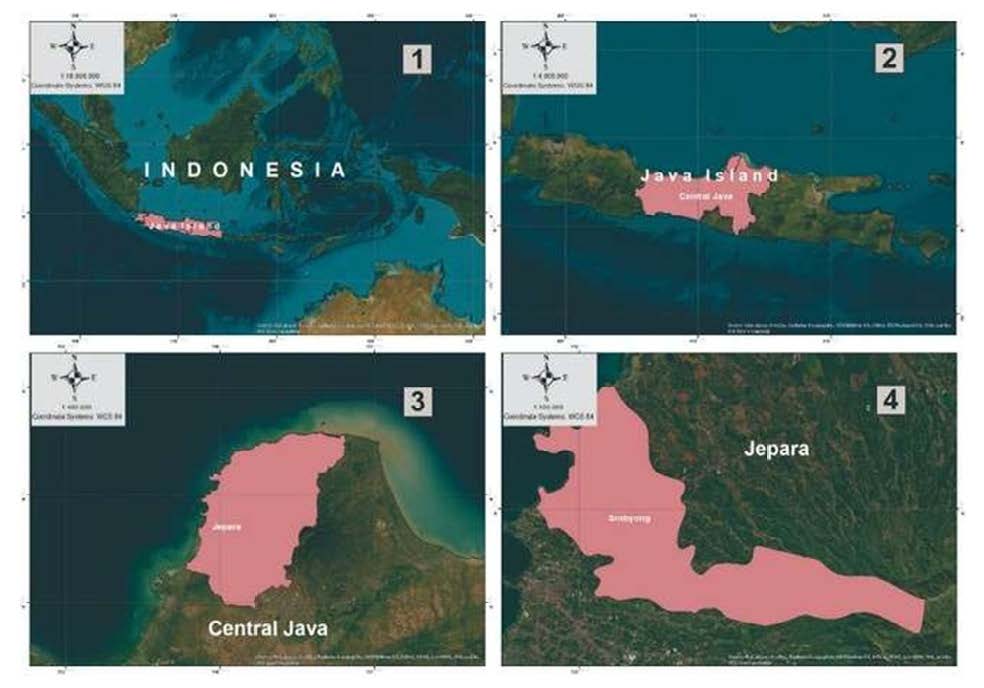
This study was conducted in community forests at Srobyong Village, Jepara District, Central Java, Indonesia. It had geographic position in S6°31’35”-6°31’37” and E110°41’39”-110°43’22” ( Figure 1 ). The site is classified into a lowland area with an altitude of 70 m above sea level. Topography is predominantly flat, with a slope level of 0−8%. Annual rainfall is 2,446 mm year -1 with a mean air humidity of 84%. The average daily temperature is 29°C with a minimum of 22°C and a maximum of 34°C. Alfisols dominate soil type with a pH of 5.5−6.0. Around 52% of this area is dominated by community forests, providing timber for local industries. Three commercial species are extensively cultivated by farmers in the study area, namely Swietenia macrophylla , Tectona grandis , and Falcataria moluccana (Wirabuana et al., 2021a ). These plants become species preferences since they have good market availability. However there are also other plant species in this location, but they have lower populations than these three species.

Data collection
Destructive sampling was conducted on 45 trees from three species, i.e., T. grandis , S. macrophylla , and F. moluccana . The number of tree samples was evenly distributed for each species, wherein 15 sample trees represented each species. These sample trees were selected by considering the diameter distribution to obtain representative samples from small to big trees (Setiahadi, 2021 ). This was classified into four classes, namely 0−10 cm, 11−20 cm, 21−30 cm, and ≥31 cm (Wirabuana et al., 2020b ). Every class consisted of at least three tree samples for each species. The sample size was relatively small due to the limited resources available. However, several studies also used a small sample size to develop allometric equations (Youkhana and Idol, 2011 ; Stas et al., 2017 ; Sadono et al., 2022 ).
Before the sample tree was felled, several parameters were recorded, like diameter at breast height ( D ), tree height ( H ), and crown radius ( CR ). Tree diameter was measured at 1.3 m aboveground using a diameter tape, while tree height was quantified from aboveground to top crown using a spiegel relascope. The crown radius was determined as the quadratic mean of crown radius from eight directions ( Figure 2 ) (Pretzsch et al., 2015 ). This parameter was used to calculate the crown projection area ( CPA ) for determining the occupation area of every tree crown (Wirabuana et al., 2021 ). The mathematical functions for computing both variables are presented below:
(1) (2)Where CR is a quadratic mean crown radius of every tree sample (m), R is the length of crown radius in a certain direction (m), and CPA is the crown projection area of an individual tree (m 2 ).

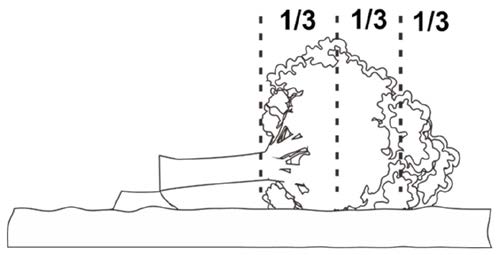
The destructive process was conducted using a chainsaw from small to large tree samples. After the sample tree was felled, crown length was measured from the base to the endpoint. Then, it was stratified into three layers with the same proportions, i.e., base, middle, and top ( Figure 3 ). Ten leaf samples were taken randomly from every layer to support the individual leaf area measurements (Wirabuana et al., 2019 ). Thereby, there were 30 leaf samples for each tree. Afterward, the foliage was harvested and weighed to determine the fresh weight using a hanging balance. The leaf samples were also included when determining the total foliage fresh weight. Then, around 500 g foliage subsamples were collected and brought to the laboratory for drying (Sadono et al., 2021 ).

Before drying, every leaf sample was scanned to get its picture. The step was undertaken to facilitate the measurement of individual leaf area ( LA ). We used the Image J software to support LA calculation. Then, the leaf samples and foliage subsamples were dried using an oven for 48 hours at 70°C before measuring their dry weight (Wirabuana et al., 2019 ). The foliage biomass ( WF ) was determined by multiplying the ratio of dry-fresh weight from the subsample with the total foliage fresh weight from every tree sample. The specific leaf area ( SLA ) was calculated by dividing LA by the individual leaf dry weight ( LW ) (Rosbakh et al., 2015 ). SLA indicates the level of leaf thickness of a plant species. Furthermore, LAI from every tree sample was determined based on the relationship among SLA , WF , and CPA (Hakamada et al., 2016 ). The equations for determining these parameters are described below.
(3) (4) (5)Where WF is foliage biomass (kg), DW is the dry weight of foliage subsample (kg), FW is the fresh weight of foliage subsample (kg), TFW is total foliage fresh weight (kg), SLA is a specific leaf area (m 2 kg -1 ), LA is the individual leaf area (m 2 ), LW is the individual leaf dry weight (kg), and CPA the crown projection area of an individual tree (m 2 ).
Data analysis
A descriptive test was conducted to identify the data attributes from the observed variables, including minimum, maximum, mean, standard deviation, and standard error. The normality of data was evaluated using the Shapiro-Wilk test. Correlation analysis was also applied to assess the relationship between independent and dependent variables. It was also supported by the scatter diagram to recognize the relationship between both variables. The diameter at breast height ( D ) and tree height ( H ) were placed on the X-axis, while LAI was put on the Y-axis. Both methods were commonly used in previous studies before developing the allometric equations (Vega-Nieva et al., 2015 ; Lisboa et al., 2018 ; Tetemke et al., 2019 ; Ogana and Ercanli, 2022 ).
Three allometric equations were evaluated in this study. The number of independent variables for both equations was relatively different. The first equation only used D as the single predictor, while the second model used squared diameter at breast height combined with tree height (D 2 H) as the predictors. For the third equation, D and H were used as the predictors separately. The allometric equations were developed using two paths, i.e., for certain species and all species combined. The form of equations is presented below:
(6) (7) (8)Where Y is the LAI value of the individual tree, D is the diameter at breast height (cm), H is tree height (m), while a, b, and c are fit coefficients.
Seven indicators were selected to evaluate the best allometric equations, namely the significant result of the ANOVA test for the model, the significant outcome of fitted parameters ( a,b,c ), coefficient of determination ( R 2 ), residual standard error ( RSE ), Akaike information criterion ( AIC ), mean absolute error (MAE), and root mean square error ( RMSE ). The ANOVA test, fitted parameters, R 2 , RSE , and AIC were used to evaluate the model fitting, while MAE and RMSE were selected to examine the validation (Wirabuana et al., 2020a ; Sadono et al., 2021 ). Our study used the leave-one-out cross-validation (LOOCV) method due to the small sample size. Other studies also applied LOOCV when developing models with a low sample size (Altanzagas et al. 2019 ; Tetemke et al. 2019 ). Detailed formulas for calculating these indicators are expressed below:
(9) (10) (11) (12) (13)Where Y is the observed LAI , is the average observed LAI , is the estimated LAI from the fitted model, n is the sample size, RSS is the residual sum of squares from the fitted model, k is the number of parameters, and p is the number of terms in the model. High R 2 values, small RSE , AIC , MAB , and RMSE indicate high model precision.
Furthermore, the Extra Sums of Square (ESS) method was also applied to determine the most efficient allometric equations for estimating the LAI of community forest tree species. ESS was done to quantify the marginal reductions in Error Sums of Squares when an additional set of predictors was added to the model (Hector et al., 2016 ; Wirabuana et al., 2021a ; Sadono et al., 2022 ). It aimed to evaluate whether the addition of H as the predictor variable provided a significant contribution to improving the model’s reliability. When the result is insignificant, using a single predictor in the allometric equation was sufficient to obtain a good estimation.
RESULTS
Tree sample distribution
The number of sample trees in every diameter class relatively varied for each species ( Table 1 ). Overall, most tree samples were classified into the diameter class of 0−10 cm, while the lowest was found in the diameter class of ≥31 cm. Total tree samples declined with the increasing diameter class and followed the J-curve pattern. It indicated that the forest structure in the study site had a heterogeneous condition with uneven-aged stand. Our study also noted that S. macrophylla had almost equal tree samples for all diameter classes except for the biggest diameter class. Meanwhile, a different proportion was observed in T. grandis , wherein only the lowest diameter class did not have an equal number of tree samples.
Summarized results of the observation found that LAI among species exhibited a high variation ( Table 2 ). The highest mean LAI was recorded in S. macrophylla (1.03±0.03), followed by T. grandis (0.28±0.07) and F. moluccana (0.23±0.03). LAI was also highly correlated with other tree parameters ( Figure 4 ). However, the relationship between parameters was relatively different. Higher D, H, CPA, and WF significantly increased LAI . In contrast, LAI gradually declined along with increasing SLA . The strong correlation between D and H with LAI confirmed that both variables could be used as predictors to develop allometric equations.

Allometric equations for LAI estimation
This study reported that every allometric equation provided a good fit, wherein more than 60% LAI variation in every species could be explained using these equations ( Table 3 ). This finding confirmed that the allometric equations were reliable to facilitate LAI estimation of community forest tree species. Interestingly, the addition of H as a predictor variable in the equation only provided a substantial contribution to improving the accurate LAI estimation in S. macrophylla (Tab. 4). Meanwhile, using a single predictor like D was better for estimating LAI in T. grandis and F. moluccana . This fact caused the best-fit equation for each species to be relatively different.
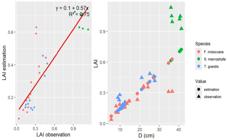
The results also found that a generalized allometric equation could be developed to estimate LAI in all species ( Table 3 ). This equation only required D as a predictor variable ( Table 4 ), but it could explain approximately 79% LAI variation from all species. The estimated LAI from this equation also demonstrated a high correlation with the actual LAI value ( Figure 5 ). However, it provided a lower estimation when used to predict the LAI of S. macrophylla . In contrast, the equation showed a better fit when used to estimate LAI in T. grandis and F. moluccana.
DISCUSSION
The allometric equations indicated good reliability in estimating the LAI of community forest tree species in the study site. More than 60% LAI variation for each species could be predicted using these equations ( Table 2 ). It was directly suitable to our first hypothesis. This finding was also similar to other previous studies, wherein the allometric equations could be applicable to facilitate LAI estimation (Xiao et al., 2006 ; Vyas et al., 2010 ; Colaizzi et al., 2017 ). However, we also realize the model reliability principally varies depending on site species and type of forest ecosystems. For example, the best-fit equation for estimating the LAI of T. grandis in this study had a lower precision than the LAI model of T. grandis in India (Vyas et al., 2010 ). It may occur because there is a different growth rate of species between both locations. The allometric equation is principally constructed from the relationship between tree attributes; thus, differences in growth response can generate a distinguished model.
LAI is highly correlated with other observed tree parameters ( Figure 4 ). It confirmed a significant influence of LAI variation on plant growth. Higher LAI would generate better growth because the plants can absorb more light intensity to support their photosynthesis process (Vyas et al., 2010 ). Thus, they can produce more biomass and allocate the results to increase height and diameter (De Mattos et al. 2020 ). It addressed why higher LAI values also followed the greater D and H . This fact also becomes the basis consideration in developing the allometric equations. Compared to other parameters, D and H are more accessible to measure and always recorded when conducting forest inventory.
Our study also noted that the best-fit equations for each species were different ( Table 3 ). It also confirmed our second hypothesis. For S. macrophylla , both D and H were required to obtain good LAI estimation ( Table 4 ). Meanwhile, a single D predictor is sufficient for good LAI predictions in T. grandis and F. moluccana . These outcomes indicated that the addition of H as an independent variable only provided a significant contribution to improving the reliability of allometric equations for specific species. It was different from the previous studies, which reported that the addition of H consistently increased the accurate estimation of allometric equations (Bi et al., 2004 ; Chave et al., 2014 ; Meng et al., 2021 ).
Moreover, we also reported that generalized allometric equations could be developed for all species. The generalized model also showed good reliability, wherein approximately 79% of LAI variation among species could be explained ( Table 3 ). It rejected our third hypothesis that the generalized equation could not be developed. Interestingly, this equation only needed D as the predictor variable; thus, it was also more applicable in the field. Using a generalized equation also had a lower cost and time consumption than the specific species model since it only needed to collect a single variable. For a practical reason, measuring H in forests is not easy since we will also face canopy overlap between trees that can cause a potential error (Mugasha et al., 2013 ; Magalhães, 2017 ; Dey et al., 2021 ; Cui et al., 2022 ; Kafuti et al., 2022 ). Many studies also recommend using a simple model for supporting forest inventory as long as it can explain the majority of object variations (Lumbres et al., 2015 ; Forrester et al., 2017 ; Romero et al., 2020 ; Wirabuana et al., 2021a ; Sadono et al., 2022 ). Therefore, we suggest using a generalized allometric equation to estimate the LAI of community forest tree species in the study site.
Nevertheless, we also realized that our study had several limitations, wherein it only used a small sample size (45 trees) from three different species. It was also conducted in one location; thus, we could not assess whether the best equation was reliable for different sites and forest ecosystems. Further investigation is still required to validate the reliability of allometric equations for estimating LAI with more diverse species and higher sample sizes. We also hope that future research can be implemented in multiple sites to evaluate the extensive validity of this approach.
CONCLUSION
This study concluded that the allometric equations were reliable in facilitating LAI estimation of community forest tree species in Jepara District. The best-fit models could explain more than seventy percent of LAI variation in every species. Although the best equation of each species was relatively different, estimating LAI for all species could also use a single generalized model with a diameter at breast height as a predictor. Although the best model was reliable to facilitate LAI estimation in this research site, further validation is required to examine the model for different sites and forest ecosystems. Other investigation are also required to evaluate whether LAI can be estimated using allometric equations with tree diameter as a predictor.
REFERENCES
-
Altanzagas B, Luo Y, Altansukh B, Dorjsuren C, Fang J, Hu H. Allometric equations for estimating the above-ground biomass of five forest tree species in Khangai, Mongolia. Forests. 2019;10:1-17. https://doi.org/10.3390/f10080661
» https://doi.org/10.3390/f10080661 -
Ariza-Carricondo C, Di Mauro F, De Beeck MO, Roland M, Gielen B, Vitale D, Ceulemans R, Papale D. A comparison of different methods for assessing leaf area index in four canopy types. Central European Forestry Journal. 2019;65:67-80. https://doi.org/10.2478/forj-2019-0011
» https://doi.org/10.2478/forj-2019-0011 -
Bi H, Turner J, Lambert MJ. Additive biomass equations for native eucalypt forest tress of temperate Australia. Trees. 2004;18:467-79. https://doi.org/10.1007/s00468-004-0333-z
» https://doi.org/10.1007/s00468-004-0333-z -
Chave J, Réjou-Méchain M, Búrquez A, Chidumayo E, Colgan MS, Delitti WBC, Duque A, Eid T, Fearnside PM, Goodman RC, Henry M, Martínez-Yrízar A, Mugasha WA, Muller-Landau HC, Mencuccini M, Nelson BW, Ngomanda A, Nogueira EM, Ortiz-Malavassi E, Pélissier R, Ploton P, Ryan CM, Saldarriaga JG, Vieilledent G. Improved allometric models to estimate the aboveground biomass of tropical trees. Glob Chang Biol. 2014;20:3177-90. https://doi.org/10.1111/gcb.12629
» https://doi.org/10.1111/gcb.12629 -
Colaizzi PD, Evett SR, Brauer DK, Howell TA, Tolk JA, Copeland KS. Allometric method to estimate leaf area index for row crops. Agron J. 2017;109:883-94. https://doi.org/10.2134/agronj2016.11.0665
» https://doi.org/10.2134/agronj2016.11.0665 -
Coombes A, Martin J, Slater D. Defining the allometry of stem and crown diameter of urban trees. Urban For Urban Green. 2019;44:126421. https://doi.org/10.1016/j.ufug.2019.126421
» https://doi.org/10.1016/j.ufug.2019.126421 -
Cui K, Wu X, Zhang C, Zhao X, von Gadow K. Estimating height-diameter relations for structure groups in the natural forests of Northeastern China. For Ecol Manage. 2022;519:120298. https://doi.org/10.1016/j.foreco.2022.120298
» https://doi.org/10.1016/j.foreco.2022.120298 -
Dey T, Ahmed S, Islam A. Relationships of tree height-diameter at breast height (DBH) and crown diameter-DBH of Acacia auriculiformis plantation. Asian Journal of Forestry. 2021;5:71-5. https://doi.org/10.13057/asianjfor/r050203
» https://doi.org/10.13057/asianjfor/r050203 -
Forrester DI, Tachauer IHH, Annighoefer P, Barbeito I, Pretzsch H, Ruiz-Peinado R, Stark H, Vacchiano G, Zlatanov T, Chakraborty T, Saha S, Sileshi GW. Generalized biomass and leaf area allometric equations for European tree species incorporating stand structure, tree age and climate. For Ecol Manage. 2017;396:160-75. https://doi.org/10.1016/j.foreco.2017.04.011
» https://doi.org/10.1016/j.foreco.2017.04.011 -
Hakamada R, Giunti Neto C, de Lemos CCZ, Silva SR, Otto MSG, Hall KB, Stape JL. Validation of an efficient visual method for estimating leaf area index in clonal Eucalyptus plantations. South For. 2016;78:275-81. https://doi.org/10.2989/20702620.2016.1201641
» https://doi.org/10.2989/20702620.2016.1201641 -
Hector A, Felten S Von, Schmid B, Hector A, Feiten S Von, Schmid B. Analysis of variance with unbalanced data: an update for ecology & evolution. Journal of Animal Ecology. 2016;79:308-16. https://doi.org/10.1111/j.l365-2656.2009.01634.x
» https://doi.org/10.1111/j.l365-2656.2009.01634.x - Istrefi E, Toromani E, Nehat Ç, Thaçi B. Allometric biomass equations for young trees of four broadleaved species in Albania. 2019:1-14
-
Kafuti C, Van den Bulcke J, Beeckman H, Van Acker J, Hubau W, De Mil T, Hatakiwe H, Djiofack B, Fayolle A, Loubota Panzou GJ, Bourland N. Height-diameter allometric equations of an emergent tree species from the Congo Basin. For Ecol Manage. 2022;504:119822. https://doi.org/10.1016/j.foreco.2021.119822
» https://doi.org/10.1016/j.foreco.2021.119822 -
Karyati, Widiati KY, Karmini, Mulyadi R. The allometric relationships for estimating above-ground biomass and carbon stock in an abandoned traditional garden in east kalimantan, indonesia. Biodiversitas. 2021;22:751-62. https://doi.org/10.13057/biodiv/d220228
» https://doi.org/10.13057/biodiv/d220228 -
Khan MNI, Shil MC, Azad MS, Sadath MN, Feroz SM, Mollick AS. Allometric relationships of stem volume and stand level carbon stocks at varying stand density in Swietenia macrophylla King plantations, Bangladesh. For Ecol Manage. 2018;430:639-48. https://doi.org/10.1016/j.foreco.2018.09.002
» https://doi.org/10.1016/j.foreco.2018.09.002 -
Lisboa SN, Guedes BS, Ribeiro N, Sitoe A. Biomass allometric equation and expansion factor for a mountain moist evergreen forest in Mozambique. Carbon Balance Manag. 2018;13:1-16. https://doi.org/10.1186/s13021-018-0111-7
» https://doi.org/10.1186/s13021-018-0111-7 -
Lumbres RIC, Lee YJ, Yun CW, Koo CD, Kim S Bin, Son YM, Lee KH, Won HK, Jung SC, Seo YO, Ian R, Lee YJ, Yun CW, Koo CD, Kim S Bin, Son YM, Lee KH, Won HK, Jung SC, Seo YO. DBH-height modeling and validation for Acacia mangium and Eucalyptus pellita in Korintiga Hutani Plantation, Kalimantan, Indonesia. Forest Sci Technol. 2015;11:119-25. https://doi.org/10.1080/21580103.2014.957356
» https://doi.org/10.1080/21580103.2014.957356 -
Magalhães TM. Site-specific height-diameter and stem volume equations for Lebombo-ironwood. Ann For Res. 2017;60:297-312. https://doi.org/10.15287/afr.2017.838
» https://doi.org/10.15287/afr.2017.838 -
Mason EG, Diepstraten M, Pinjuv GL, Lasserre JP. Comparison of direct and indirect leaf area index measurements of Pinus radiata D. Don. Agric For Meteorol. 2012;166-167:113-9. https://doi.org/10.1016/j.agrformet.2012.06.013
» https://doi.org/10.1016/j.agrformet.2012.06.013 -
de Mattos EM, Binkley D, Campoe OC, Alvares CA, Stape JL. Variation in canopy structure, leaf area, light interception and light use efficiency among Eucalyptus clones. For Ecol Manage. 2020;463:118038. https://doi.org/10.1016/j.foreco.2020.118038
» https://doi.org/10.1016/j.foreco.2020.118038 -
Meng S, Yang F, Hu S, Wang Haibin, Wang Huimin. Generic additive allometric models and biomass allocation for two natural oak species in northeastern china. Forests. 2021;12:1-19. https://doi.org/10.3390/f12060715
» https://doi.org/10.3390/f12060715 -
Moualeu-Ngangue DP, Chen TW, Stützel H. A new method to estimate photosynthetic parameters through net assimilation rate−intercellular space CO2 concentration (A−Ci) curve and chlorophyll fluorescence measurements. New Phytologist. 2017;213:1543-54. https://doi.org/10.1111/nph.14260
» https://doi.org/10.1111/nph.14260 -
Mugasha WA, Bollandsås OM, Eid T. Relationships between diameter and height of trees in natural tropical forest in Tanzania. South For. 2013;75:221-37. https://doi.org/10.2989/20702620.2013.824672
» https://doi.org/10.2989/20702620.2013.824672 -
Ogana FN, Ercanli I. Modelling height-diameter relationships in complex tropical rain forest ecosystems using deep learning algorithm. J For Res (Harbin). 2022;33:883-98. ( https://doi.org/10.1007/s11676-021-01373-1 )
» https://doi.org/10.1007/s11676-021-01373-1 -
Pretzsch H. The effect of tree crown allometry on community dynamics in mixed-species stands versus monocultures. A review and perspectives for modeling and silvicultural regulation. Forests. 2019;10:1-33. https://doi.org/10.3390/f10090810
» https://doi.org/10.3390/f10090810 -
Pretzsch H, Biber P, Uhl E, Dahlhausen J, Rötzer T, Caldentey J, Koike T, van Con T, Chavanne A, Seifert T, du Toit B, Farnden C, Pauleit S. Crown size and growing space requirement of common tree species in urban centres, parks, and forests. Urban For Urban Green. 2015;14:466-79. https://doi.org/10.1016/j.ufug.2015.04.006
» https://doi.org/10.1016/j.ufug.2015.04.006 -
Qu Y, Zhuang Q. Modeling leaf area index in North America using a process-based terrestrial ecosystem model. Ecosphere. 2018;9. https://doi.org/10.1002/ecs2.2046
» https://doi.org/10.1002/ecs2.2046 -
Richardson JJ, Moskal LM, Kim SH. Modeling approaches to estimate effective leaf area index from aerial discrete-return LIDAR. Agric For Meteorol. 2009;149:1152-60. ( https://doi.org/10.1016/j.agrformet.2009.02.007 )
» https://doi.org/10.1016/j.agrformet.2009.02.007 -
Riikonen A, Lindén L, Pulkkinen M, Nikinmaa E. Post-transplant crown allometry and shoot growth of two species of street trees. Urban For Urban Green. 2011;10:87-94. ( https://doi.org/10.1016/j.ufug.2010.09.001 )
» https://doi.org/10.1016/j.ufug.2010.09.001 -
Romero FMB, Jacovine LAG, Ribeiro SC, Torres CMME, da Silva LF, Gaspar R de O, da Rocha SJSS, Staudhammer CL, Fearnside PM. Allometric equations for volume, biomass, and carbon in commercial stems harvested in a managed forest in the southwestern amazon: A case study. Forests. 2020;11:1-17. https://doi.org/10.3390/f11080874
» https://doi.org/10.3390/f11080874 -
Rosbakh S, Römermann C, Poschlod P. Specific leaf area correlates with temperature: new evidence of trait variation at the population, species and community levels. Alp Bot. 2015;125:79-86. https://doi.org/10.1007/s00035-015-0150-6
» https://doi.org/10.1007/s00035-015-0150-6 -
Sadono R, Wardhana W, Idris F, Wirabuana PYAP. Allometric Equation for Estimating Energy Production of Eucalyptus urophylla in Dryland Ecosystems at East Nusa Tenggara. Journal of Tropical Forest Management. 2022;28:32-9. https://doi.org/10.7226/jtfm.28.1.32
» https://doi.org/10.7226/jtfm.28.1.32 -
Sadono R, Wardhana W, Wirabuana PYAP, Idris F. Allometric equations for estimating aboveground biomass of eucalyptus urophylla S.T. Blake in east nusa tenggara. Jurnal Manajemen Hutan Tropika. 2021;27:24-31. https://doi.org/10.7226/JTFM.27.1.24
» https://doi.org/10.7226/JTFM.27.1.24 -
Setiahadi R. Comparison of individual tree aboveground biomass estimation in community forests using allometric equation and expansion factor in magetan, east java, indonesia. Biodiversitas. 2021;22:3899-909. https://doi.org/10.13057/biodiv/d220936
» https://doi.org/10.13057/biodiv/d220936 -
Shin N, Kotani A, Sato T, Sugimoto A, Maximov TC, Nogovitcyn A, Miyamoto Y, Kobayashi H, Tei S. Direct measurement of leaf area index in a deciduous needle-leaf forest, eastern Siberia. Polar Sci. 2020;25:100550. https://doi.org/10.1016/j.polar.2020.100550
» https://doi.org/10.1016/j.polar.2020.100550 -
Stas SM, Rutishauser E, Chave J, Anten NPR, Laumonier Y. Estimating the aboveground biomass in an old secondary forest on limestone in the Moluccas, Indonesia: Comparing locally developed versus existing allometric models. For Ecol Manage. 2017;389:27-34. https://doi.org/10.1016/j.foreco.2016.12.010
» https://doi.org/10.1016/j.foreco.2016.12.010 -
Tetemke BA, Birhane E, Rannestad MM, Eid T. Allometric models for predicting aboveground biomass of trees in the dry afromontane forests of Northern Ethiopia. Forests. 2019;10:1-15. ( https://doi.org/10.3390/F10121114 )
» https://doi.org/10.3390/F10121114 -
Vega-Nieva DJ, Valero E, Picos J, Jiménez E. Modeling the above and belowground biomass of planted and coppiced Eucalytpus globulus stands in NW Spain. Ann For Sci. 2015;72:967-80. https://doi.org/10.1007/s13595-015-0493-6
» https://doi.org/10.1007/s13595-015-0493-6 -
Vyas D, Mehta N, Dinakaran J, Krishnayya NSR. Allometric equations for estimating leaf area index (LAI) of two important tropical species (Tectona grandis and Dendrocalamus strictus). J For Res (Harbin). 2010;21:197-200. https://doi.org/10.1007/s11676-010-0032-0
» https://doi.org/10.1007/s11676-010-0032-0 -
Widagdo FRA, Xie L, Dong L, Li F. Origin-based biomass allometric equations, biomass partitioning, and carbon concentration variations of planted and natural Larix gmelinii in northeast China. Glob Ecol Conserv. 2020;23. https://doi.org/10.1016/j.gecco.2020.e01111
» https://doi.org/10.1016/j.gecco.2020.e01111 -
Wirabuana PYAP, Alam S, Matatula J, Harahap MM, Nugroho Y, Idris F, Meinata A, Sekar DA. The growth, aboveground biomass, crown development, and leaf characteristics of three eucalyptus species at initial stage of planting in Jepara, Indonesia. Biodiversitas. 2021;22:2859-69. https://doi.org/10.13057/biodiv/d220550
» https://doi.org/10.13057/biodiv/d220550 - Wirabuana PYAP, Mulyana B, Meinata A, Idris F, Sadono R. Allometric equations for estimating merchantable wood and aboveground biomass of community forest tree species in jepara district. 2021;27:496-515
-
Wirabuana PYAP, Sadono R, Juniarso S. Fertilization Effects on Early Growth, Aboveground Biomass, Carbon Storage, and Leaf Characteristics of Eucalyptus pellita F. Muell. In South Sumatera. Jurnal Manajemen Hutan Tropika. 2019;23:154-63. ( https://doi.org/10.7226/jtfm.25.3.154 )
» https://doi.org/10.7226/jtfm.25.3.154 -
Wirabuana PYAP, Setiahadi R, Sadono R, Lukito M, Martono DS, Matatula J. Allometric equations for estimating biomass of community forest tree species in madiun, Indonesia. Biodiversitas. 2020a;21:4291-300. https://doi.org/10.13057/biodiv/d210947
» https://doi.org/10.13057/biodiv/d210947 -
Wirabuana PYAP, Setiahadi R, Sadono R, Lukito M, Martono DS, Matatula J. Allometric equations for estimating biomass of community forest tree species in Madiun , Indonesia. Biodiversitas. 2020b;21:4291-300. https://doi.org/10.13057/biodiv/d210947
» https://doi.org/10.13057/biodiv/d210947 -
Xiao CW, Janssens IA, Curiel Yuste J, Ceulemans R. Variation of specific leaf area and upscaling to leaf area index in mature Scots pine. Trees. 2006;20:304-10. https://doi.org/10.1007/s00468-005-0039-x
» https://doi.org/10.1007/s00468-005-0039-x -
Youkhana AH, Idol TW. Allometric models for predicting above- and belowground biomass of Leucaena-KX2 in a shaded coffee agroecosystem in Hawaii. Agroforestry Systems. 2011;83:331-45. https://doi.org/10.1007/s10457-011-9403-6
» https://doi.org/10.1007/s10457-011-9403-6 - Zahabu, E., Mugasha, W.A., Katani, J.Z., Malimbwi, R.E., Mwangi, J.R. and Chamshama SAO. Allometric tree biomass and volume models for Tectona grandis plantations. Allometric tree biomass and volume models in Tanzania, vol. 1. 2018. p. 148.