Abstract
Introduction:
Limited evidence has been shown on ways to optimize the mechanical design of machines in order to minimize knee loads.
Objective:
This study compared six computer simulated models of open kinetic knee extension exercises for patellofemoral pressure and tibiofemoral forces.
Methods:
A musculoskeletal model of the lower limb was developed using six different cam radius to change resistive forces. A default machine, a constant cam radius, a torque-angle model, a free-weight model and two optimized models were simulated. Optimized models reduced cam radius at target knee flexion angles to minimize knee forces. Cam radius, human force, tibiofemoral compressive and shear force, and patellofemoral pressure were compared for the six models using data from five knee flexion angles.
Results:
Large reductions in cam radius comparing the free-weight model to other models (73-180%) were limited to the large human force for the constant cam model to other models (9-36%). Larger human force (13 -36%) was estimated to perform knee extension using a constant cam radius compared other models without large effects in knee joint forces.
Conclusion:
Changes in cam design effected human without a potential impact in knee loads.
Keywords:
Knee; Resistance Training; Torque
Resumo
Introdução:
As evidências são limitadas quanto às formas de otimização do arranjo mecânico das máquinas a fim de minimizar as forças na articulação do joelho.
Objetivo:
O presente estudo comparou seis modelos de extensão de joelhos realizados em cadeia cinética aberta sob a pressão aplicada nas articulações patelofemoral e tibiofemoral.
Métodos:
Um modelo do sistema musculo-esquelético do membro inferior foi desenvolvido utilizando seis desenhos de roldana com o objetivo de alterar as forças resistivas. Uma máquina referência foi utilizada, uma com uma roldana concêntrica, um modelo baseado na relação torque-ângulo dos extensores do joelho, um modelo de peso livre e dois modelos otimizando a aplicação de cargas foram simulados. A otimização foi aplicada visando reduzir o raio da roldana excêntrica e minimizar as forças aplicadas no joelho. O raio da roldana, a força produzida pelo executante, as forças compressivas e de cisalhamento nas articulações tibiofemoral e a pressão na articulação patelofemoral foram comparadas para os seis modelos de máquina utilizando cinco ângulos de flexão do joelho.
Resultados:
Reduções no raio da roldana foram observadas comparando o modelo de peso livre com os demais modelos (73-180%). Maior força produzida foi observada para o modelo de roldana constante comparado aos demais modelos (9-36%). Maior força produzida foi estimada para realizar a extensão do joelho utilizando a roldana constante comparada com os demais modelos (13-36%) sem efeitos sobre as forças no joelho.
Conclusão:
O arranjo mecânico das máquinas alterou a força produzida pelo executante sem afetar as forças aplicadas no joelho.
Palavras-chave:
Joelho; Treinamento de Resistência; Torque
Introduction
Open kinetic chain exercises have been used for strength training and rehabilitation exercises11 Mirzabeigi E, Jordan C, Gronley JK, Rockowitz NL, Perry J. Isolation of the vastus medialis oblique muscle during exercise. Am J Sports Med. 1999;2(1):50-3.. When using strength training machines, the resistive load from the machine depends on the characteristics of the cam used to transfer the weight to the subjects’ lower limb22 McMaster DT, Cronin J, McGuigan M. Forms of variable resistance training. Strength Cond J. 2009;3(1):50-64.), (33 Pizzimenti MA. Mechanical analysis of the Nautilus leg curl machine. Can J Sport Sci. 1992;17(1):41-8.), (44 Nolte K, Krüger PE, Els PS. Three dimensional musculoskeletal modelling of the seated biceps curl resistance training exercise. Sports Biomech. 2011;10(2):146-60.. Different types of resistance have been found when the radius of the cam changes, resulting in different torque production from the subject55 Folland J, Morris B. Variable-cam resistance training machines: Do they match the angle - Torque relationship in humans? J Sports Sci. 2008; 26(2):163-9.), (66 LaPlace DJ, Keskula DR, Heinrichs KI, Perrin DH. Comparison of N-K table offset angles with the human knee flexor torque curve. J Athl Train. 1993;28(1):59-62.), (77 Johnson JH, Colodny S, Jackson D. Human torque capability versus machine resistive torque for four Eagle resistance machines. J Strength Cond Res. 1990;4(3):83-7.), (88 Hatfield FC. A new weight a machine with dynamically adjustable resistance. Auckland, NZ; 1999 [updated 1999; cited 2011 Jun 2]. Available from: https://tinyurl.com/ycjndt3c.), (99 Loss JF, Candotti CT. Comparative study between two elbow flexion exercises using the estimated resultant muscle force. Braz J Physiother. 2008;12(6):502-10.. Differently from force and torque measures, joint loads have not been analysed when cam characteristics were changed. This information is important because general users of strength training machines will be submitted to different loads which may have diverse effects in knee joint loads.
The knee joint has been analysed based on two separate bone-on-bone connections. The patellofemoral joint and the tibiofemoral joint have different characteristics and are affected differently by knee extension exercises1010 Escamilla RF. Knee biomechanics of the dynamic squat exercise. Med Sci Sports Exerc. 2001;33(1):127-41.), (1111 Ericson MO, Nisell R. Patellofemoral joint forces during ergometric cycling. Phys Ther. 1987;67(9):1365-9.), (1212 Ericson MO, Nisell R. Tibiofemoral joint forces during ergometer cycling. Am J Sports Med. 1986;14(4):285-90.. During open kinetic knee extension, the patella is compressed against the femur with varying force levels and contact areas1313 Cohen ZA, Roglic H, Grelsamer RP, Henry JH, Levine WN, Mow VC, et al. Patellofemoral stresses during open and closed kinetic chain exercises: An analysis using computer simulation. Am J Sports Med. 2001;29(4):480-7.. Greater compressive force at greater knee flexion angle has been observed1414 Mason JJ, Leszko F, Johnson T, Komistek RD. Patellofemoral joint forces. J Biomech. 2008;41(11):2337-48. followed by increased contact area between the patella and the femur1515 Besier TF, Draper CE, Gold GE, Beaupré GS, Delp SL. Patellofemoral joint contact area increases with knee flexion and weight-bearing. J Orthop Res. 2005;23(2):345-50.), (1616 Salsich GB, Ward SR, Terk MR, Powers CM. In vivo assessment of patellofemoral joint contact area in individuals who are pain free. Clin Orthop Relat Res. 2003;(417):277-84.. However, force and contact area on the patellofemoral joint during open kinetic knee extension exercises performed using varying cam characteristics are unknown. The assessment of these variables may shed light on patellofemoral pressure which has been linked to patellar cartilage degeneration1313 Cohen ZA, Roglic H, Grelsamer RP, Henry JH, Levine WN, Mow VC, et al. Patellofemoral stresses during open and closed kinetic chain exercises: An analysis using computer simulation. Am J Sports Med. 2001;29(4):480-7..
The load at the tibiofemoral joint has been analysed in terms of axial and tangential components on the tibial plateau1717 Escamilla RF, Fleisig GS, Zheng N, Barrentine SW, Wilk KE, Andrews JR. Biomechanics of the knee during closed kinetic chain and open kinetic chain exercises. Med Sci Sports Exerc. 1998;30(4):556-69.. Compressive force on the tibial plateau was associated to greater compression on the menisci. Moreover, anterior and posterior shear (tangential) force on the tibial plateau was related to stress on the anterior and posterior cruciate ligaments, respectively1818 Wright RW, Preston E, Fleming BC, Amendola A, Andrish JT, Bergfeld JA, et al. A systematic review of anterior cruciate ligament reconstruction rehabilitation: part I: continuous passive motion, early weight bearing, postoperative bracing, and home-based rehabilitation. J Knee Surg. 2008;21(3):217-24.), (1919 Wright RW, Preston E, Fleming BC, Amendola A, Andrish JT, Bergfeld JA, et al. A systematic review of anterior cruciate ligament reconstruction rehabilitation: part II: open versus closed kinetic chain exercises, neuromuscular electrical stimulation, accelerated rehabilitation, and miscellaneous topics. J Knee Surg. 2008;21(3):225-34.. Similar to observed for the patellofemoral joint, no reports were found on tibiofemoral compressive (axial) and shear force during open kinetic knee extension exercises when resistive load is varied via changes in cam characteristics.
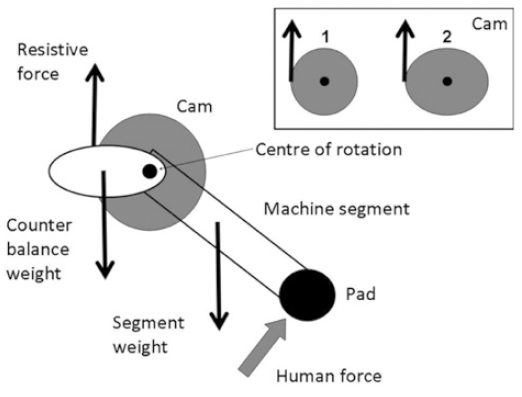
With the gaps on patellofemoral and tibiofemoral force during open kinetic knee extension exercise performed in strength training machines in mind, the question of how to minimize knee joint loads may be asked. Assuming that, to optimize the design of strength training machines the only variable to change is the radius of the cam for a set load (see Figure 1), simulation models may provide important information on human force44 Nolte K, Krüger PE, Els PS. Three dimensional musculoskeletal modelling of the seated biceps curl resistance training exercise. Sports Biomech. 2011;10(2):146-60. and knee joint force profile.
Illustration of the mechanical components of the knee extension machine used as default in musculoskeletal modelling. Resistive force vector indicates the line of action of the cable of the resistive weight on the machine. Highlight of the possible change in radius of the cam. Knee extension performed concentrically counterclockwise.
Therefore, the aim of this study was to optimize the radius of a strength training machine to minimize tibiofemoral and patellofemoral joint loads via computer simulation. Six models were tested with focus on reducing tibiofemoral compressive and shear forces along with patellofemoral pressure.
Methods
Computer simulation modelling
The mechanical model of the strength training machine was taken from a previous study2020 Bini RR, Carpes FP, Toledo JM, Loss JF. Estimation of the forces acting on the tibiofemoral joint during knee extension exercises performed on an open kinetic chain strength-training machine. Rev Bras Cineantropom Desempenho Hum. 2008;10(1):35-42. where dimensions of an existing strength training machine (Atrex #TR1030, Righetto Fitness Equipment, Brazil) were taken. The mechanical description of the moving systems of the ensemble machine is shown in Figure 1.
The ensemble machine was analysed using a measure tape to compute the radius of the cam, the machine segment length, distances from predicted centre of mass of the counter balance system to and segment length to the centre of rotation. Each measure was taken at five pre-set knee flexion angles (full extension = 0°, 30°, 45°, 60° and 90°) using a manual goniometer and assuming that the knee joint centre would be in line with the machine centre of rotation. An off-set of +20° was observed for the machine flexion angle in relation to the knee flexion angle due to the interaction between the subject leg and the pad of the machine segment, regardless the knee flexion angle. An upper pulley machine (Atrex #TR2040, Righetto Fitness Equipment, Brazil) with weights of similar design was used to ascertain on the weight of the resistive load. Previously calibrated weights of 0.1 kg were attached to the end cable of the upper pulley until the load was capable to sustain the weight selected in the other end of the cable. We selected one slot of weight calibrated as 4.6 kg for the computer simulation modelling. The machine moving arm and counter balance system weights were assumed to be 50 N and 25 N, respectively because it was not possible to detach these parts from the strength training machine.
Musculoskeletal model
A musculoskeletal model of the right lower leg was developed based on the anatomical characteristics of one hypothetical subject of 1.7 m of standing height and 70 kg of body mass performing the concentric phase of knee extension in an open kinetic chain machine at constant angular velocity.
To determine the force required to overcome the set weight of 46 N (human force), the resolution of the torque related to the human force was estimated using the following equation.
Equation 1. Human force (HF) computed using the resistive force (RF) and the moment-arm of the resistive force (dRF), moving arm weight (ArmW) and moment-arm of the moving arm weight (dArmW), counter balance weight (CBW) and moment-arm of the counter balance weight (CBW) and the moment-arm of the human force (dHF).
For all models, the moment-arm of the resistive force (dRF) was the only variable to change because it represented the radius of moment-arm of the cam, as shown in Figure 1. Six models of cams were then tested:
-
Default: cam radius measured on the strength training machine.
-
Constant: used a fixed cam radius (circular shape) of 0.395 m. This model would enable the simulation knee forces when the machine offers constant resistive force.
-
Torque-angle: assumed that the human force matched the torque-angle profile measured isometrically 55 Folland J, Morris B. Variable-cam resistance training machines: Do they match the angle - Torque relationship in humans? J Sports Sci. 2008; 26(2):163-9.. This model would enable the simulation of knee forces when muscles perform at maximal force profile.
-
Free-weight: human force was computed using a free-body diagram of the right leg performing a concentric knee extensions using a dead weight of 46 N attached to the subject’s leg close to the ankle joint. This model would enable the simulation of knee forces similar to the ones observed during early rehabilitation stages.
-
Optimal 1: cam radius was adjusted to follow and average profile between patellar tendon angle, knee flexion angle and patellar area. The rationale of this model was that potentially greater patellar tendon angle may lead to greater tibiofemoral shear forces, greater knee flexion angle may lead to greater compressive tibiofemoral forces and smaller patellar contact area may lead to enhanced patellofemoral pressure. This hypothesis assumed a given joint force when either patellar tendon, knee flexion angle or patellar contact area were changed.
-
Optimal 2: After computing the five aforementioned models, optimization criteria were defined. Cam radius was reduced by 1% if anytime the tibiofemoral compressive force, the tibiofemoral anterior shear force and the patellofemoral compressive forces measured using optimal model 1 exceeded the results found using any of the other aforementioned models.
Knee loads were computed as compressive force at the patellofemoral joint and compressive and shear forces at the tibiofemoral joint (see Figure 2).
Illustration of the patellofemoral joint and related forces (quadriceps, patellar tendon and patellofemoral compressive). Patella mechanism angle (β) computed according to Matthews et al.2121 Matthews LS, Sonstegard DA, Henke JA. Load bearing characteristics of the patello-femoral joint. Acta Orthop Scand. 1977;48(5):511-6. (Patella mechanism angle = 30.46 + 0.53.knee flexion angle). Highlight of tibiofemoral shear and compressive forces.
It was assumed that passive moment at the knee joint due to ligaments or knee flexor muscle group followed the description provided by Arnold et al.2222 Arnold EM, Ward SR, Lieber RL, Delp SL. A model of the lower limb for analysis of human movement. Ann Biomed Eng. 2010;38(2):269-79.. Quadriceps muscle group was assumed to apply force at the tibia exclusively via the patellar tendon, and that the knee was assumed to perform only rotational motion without stiffness from joint contact. Foot and shank centre of mass were extracted from the literature2323 de Leva P. Adjustments to zatsiorsky-seluyanov's segment inertia parameters. J Biomech. 1996;29(9):1223-30. assuming the length of the lower leg of 0.4 m. The inertial moment was neglected due to the assumption that the movement was performed in constant angular velocity.
For the calculation of patellar tendon force, imbalances between quadriceps muscle force and patellar tendon force due to different moment-arms of the quadriceps and patellar tendon lines of action were taken into account using data from Sharma et al.2424 Sharma A, Leszko F, Komistek RD, Scuderi GR, Cates Jr HE, Liu F. In vivo patellofemoral forces in high flexion total knee arthroplasty. J Biomech. 2008;41(3):642-8..
Tangential component of the patellar tendon force on the tibia accounting for passive knee moment was computed using equation 2.
Equation 2. Patellar tendon force tangential to the tibia (PTF_tangential) computed using the reaction analogue of the human force (HF), the moment-arm of the human force (HFMa), the weight of the lower leg (LLW), the moment-arm of the lower leg weight (LLWMa), moment-arm of the patellar tendon (PTMa) and the passive knee moment (KneeMomPass) predicted by Arnold et al.2222 Arnold EM, Ward SR, Lieber RL, Delp SL. A model of the lower limb for analysis of human movement. Ann Biomed Eng. 2010;38(2):269-79..
Axial component of the patellar tendon force and the total force on the patellar tendon were computed using the sine and cosine of the patellar angle to the axis of the tibia, respectively. Moment-arm of the patellar tendon was extracted from the study of Arnold et al.2222 Arnold EM, Ward SR, Lieber RL, Delp SL. A model of the lower limb for analysis of human movement. Ann Biomed Eng. 2010;38(2):269-79. and the patellar angle to the axis of the tibia were extracted from the study of Herzog and Reid2525 Herzog W, Read LJ. Lines of action and moment arms of the major force-carrying structures crossing the human knee joint. J Anat. 1993;182(Pt 2):213-30.. Tangential and axial components of the force on the tibia plateau (tibiofemoral shear and compressive forces, respectively) were computed using Equations 3 and 4.
Equation 3. Tibiofemoral shear force computed using patellar tendon force tangential to the tibia (PTF_tangential), lower leg weight tangential to the axis of the tibia (LLW_tangential) and the reaction analog of the human force (HF).
Equation 4. Tibiofemoral compressive force computed using patellar tendon force axial to the tibia (PTF_axial), and lower leg weight on the axis of the tibia (LLW_axial).
Patellofemoral compressive force was then computed using Equation 5 adapted from Bressel2626 Bressel E. The influence of ergometer pedaling direction on peak patellofemoral joint forces. Clin Biomech (Bristol, Avon). 2001;16(5):431-7. according to the model shown in Figure 2.
Equation 5. Patellofemoral compressive force (PF) computed using quadriceps force (QF) and patellar tendon force (PTF), where β is the patellar mechanism angle.
Patella mechanism angle was estimated using the equation presented by Matthews et al.2121 Matthews LS, Sonstegard DA, Henke JA. Load bearing characteristics of the patello-femoral joint. Acta Orthop Scand. 1977;48(5):511-6.. Pressure on the patella was computed by the patellofemoral compressive force and the patellofemoral contact area estimated by the literature1616 Salsich GB, Ward SR, Terk MR, Powers CM. In vivo assessment of patellofemoral joint contact area in individuals who are pain free. Clin Orthop Relat Res. 2003;(417):277-84.. All modelling was conducted using custom made scripts developed in Matlab (Mathworks Inc, MA) and were grouped into Excel 2007 (Microsoft Corporation) for analysis.
Statistical analysis
Data from five set knee flexion angles (0°, 30°, 45°, 60° and 90°) were grouped as average and standard deviation for each simulation model. To reduce non-uniformity in data set (i.e. data falling out of normal distribution) a logarithm transformation was applied to all data. After that, comparisons between models were conducted by analysis of differences in mean scores computed using data of the five knee flexion angles via effect sizes (i.e. differences in mean divided by pooled standard deviation). Cohen‘s effect sizes (ES) were computed for the analysis of magnitudes of differences between models and were rated as trivial (<0.25), small (0.25-0.5), moderate (0.5-1.0), and large (>1.0) 2727 Rhea MR. Determining the magnitude of treatment effects in strength training research through the use of the effect size. J Strength Cond Res. 2004;18(4):918-20.. We chose large effect sizes as significant to ensure non-overlap between means score greater than 55%2828 Cohen J. Statistical power analysis for the behavioral sciences. 2nd ed. Hillsdale, NJ: Lawrence Earlbaum Associates; 1988..
Results
Cam radius resulting from computer simulations are shown in Figure 3 for the six machine cam models. Large reductions in cam radius were found for the free-weight model compared to the default machine model, constant cam model and torque-angle model.
A- Cam radius estimated by simulation modelling. Results from the default machine, simulation of constant cam radius, torque angle profile (5), free-weight profile, and two optimized models (optimal 1 and optimal 2). B- Human force required to overcome external torque applied to the shank during knee extension. Results from the default machine, simulation of constant cam radius, torque angle profile (5), free-weight profile, and two optimized models (optimal 1 and optimal 2).
Estimated human force to perform knee extension at 46 N of resistive force is shown in Figure 3 for the default machine2020 Bini RR, Carpes FP, Toledo JM, Loss JF. Estimation of the forces acting on the tibiofemoral joint during knee extension exercises performed on an open kinetic chain strength-training machine. Rev Bras Cineantropom Desempenho Hum. 2008;10(1):35-42., for the constant cam model, for the Torque-angle model, for the free-weight model, and for the two optimized models (optimal 1 and optimal 2).
For the same load set at the machine (46 N), differences in the estimated human force were observed. These differences affected tibiofemoral shear (tangential) and compressive (axial) components, as shown in Figure 4, respectively.
A- Tibiofemoral shear force during knee extension. Results from the default machine, simulation of constant cam radius, torque angle profile (5), free-weight profile, and two optimized models (optimal 1 and optimal 2). B- Tibiofemoral compressive force during knee extension. Results from the default machine, simulation of constant cam radius, torque angle profile (5), free-weight profile, and two optimized models (optimal 1 and optimal 2). C- Pressure on the patellofemoral joint during knee extension. Results from the default machine, simulation of constant cam radius, torque angle profile (5), free-weight profile, and two optimized models (optimal 1 and optimal 2).
Differences were also observed for patellofemoral compressive pressure in the patellofemoral joint (Figure 4).
Large differences were only observed for human force comparing the constant cam model to other models. Any large differences were observed for tibiofemoral shear and compressive forces or for patellofemoral pressure from simulated changes in cam radius across the entire range of motion (see Table 1).
Discussion
Open kinetic knee extension performed using variable resistance resulted in changes in torque-angle profile55 Folland J, Morris B. Variable-cam resistance training machines: Do they match the angle - Torque relationship in humans? J Sports Sci. 2008; 26(2):163-9. with unknown effects in knee joint forces. Therefore, the aim of this study was to optimize the radius of a strength training machine to minimize tibiofemoral and patellofemoral joint loads via computer simulation. Six models were tested with focus on reducing tibiofemoral compressive and shear forces along with patellofemoral pressure. Large reductions in cam radius comparing the free-weight model other models (73-180%) were limited to the large human force for the constant cam model to other models (9-36%). Larger human force (13-36%) was estimated to perform knee extension using a constant cam radius compared other models without large effects in knee joint forces. These results are novel because only torque and power have been analysed when resistance profile was changed during open kinetic knee extension exercises55 Folland J, Morris B. Variable-cam resistance training machines: Do they match the angle - Torque relationship in humans? J Sports Sci. 2008; 26(2):163-9.), (2929 Dalleau G, Baron B, Bonazzi B, Leroyer P, Verstraete T, Verkindt C. The influence of variable resistance moment arm on knee extensor performance. J Sports Sci. 2010;28(6):657-65..
To a set external load, the torque required to perform knee extension at constant angular velocity depends on the mechanical characteristics of the machine. Various options have been used to change the resistance of the load to the performer, from the attachment of elastic bands to the cable of the weights of the machine22 McMaster DT, Cronin J, McGuigan M. Forms of variable resistance training. Strength Cond J. 2009;3(1):50-64. to changes in the radius of the cam of the machine2929 Dalleau G, Baron B, Bonazzi B, Leroyer P, Verstraete T, Verkindt C. The influence of variable resistance moment arm on knee extensor performance. J Sports Sci. 2010;28(6):657-65.. In our study, using a fixed external load (i.e. 46 N) we observed that computer simulations using different torque profile (e.g. torque-angle optimized from isometric contractions) resulted in varying human forces. All models, except the one with constant cam radius reduced human force, therefore, reducing knee extensors force required to perform the exercise.
Tibiofemoral shear force throughout knee extension followed a similar profile from passive knee moment reported by Arnold et al.2222 Arnold EM, Ward SR, Lieber RL, Delp SL. A model of the lower limb for analysis of human movement. Ann Biomed Eng. 2010;38(2):269-79., resulting in large anterior shear force due to increased hamstrings tension towards smaller knee flexion angles (i.e. full knee extension). Similar tibiofemoral shear forces were observed for all models suggesting that at low force levels (i.e. 46 N of resistive force), knee joint forces may be dictated by passive forces. Although differences between models were not large (1-10%), increases in resistive force may play a role on enlarging differences due to changes in cam radius. Likewise, strain at the anterior cruciate ligament is expected to increase towards full knee extension1818 Wright RW, Preston E, Fleming BC, Amendola A, Andrish JT, Bergfeld JA, et al. A systematic review of anterior cruciate ligament reconstruction rehabilitation: part I: continuous passive motion, early weight bearing, postoperative bracing, and home-based rehabilitation. J Knee Surg. 2008;21(3):217-24. which may be minimized using a torque-angle model (see Figure 4).
Tibiofemoral compressive force was similar comparing models developed in the computer simulation conducted in this study. However, we observed greater compressive force at 60° of knee flexion for the torque-angle and constant cam models. The constant cam model and the torque-angle model resulted in larger cam radius at 60° of knee flexion compared to other models (see Figure 3), which may explain these results. Overload in menisci due to large compressive forces in tibiofemoral joint may be minimized by using the second optimization model (optimal 2).
For patellofemoral pressure, any large difference was observed comparing the six cam models. However, differences could be observed at the 60° of knee flexion, with smaller pressure expected using both optimized models (optimal 1 and optimal 2). Larger pressure at the patellofemoral joint may lead to chondromalacia patellae which are commonly observed at high flexion angles1313 Cohen ZA, Roglic H, Grelsamer RP, Henry JH, Levine WN, Mow VC, et al. Patellofemoral stresses during open and closed kinetic chain exercises: An analysis using computer simulation. Am J Sports Med. 2001;29(4):480-7.. Although, contact area between the patella and the femur increases towards high flexion angles1515 Besier TF, Draper CE, Gold GE, Beaupré GS, Delp SL. Patellofemoral joint contact area increases with knee flexion and weight-bearing. J Orthop Res. 2005;23(2):345-50.), (1616 Salsich GB, Ward SR, Terk MR, Powers CM. In vivo assessment of patellofemoral joint contact area in individuals who are pain free. Clin Orthop Relat Res. 2003;(417):277-84., the 60° of knee flexion angle resulted in greater patellar pressure potentially due to high compressive forces and potentially not optimal contact area to reduce patellofemoral pressure. Subjects with anterior knee pain and/or chondromalacia patellae may avoid using large resistive force during open-kinetic chain knee extensions when flexion angle is 60°. Further reduction in cam radius for optimized models is required to reduce patellofemoral pressure.
Changes in cam radius were simulated to minimize knee joint forces. Although large changes were observed for cam radius and human force, no large effects were found for knee forces. Two reasons may explain the lack of differences. The first is related to the low level of resistive load used for modelling simulation. It may be possible that higher resistive load may elicit larger differences between models. Another explanation may be related to the characteristics of the musculoskeletal system. Passive moment from hamstrings towards full knee extension may have largely affected force required by quadriceps muscle group to perform knee extension. Therefore, large changes in cam radius may not be fully translated into large changes in knee joint forces.
Modelling lower limb kinetics and kinematics have been limited because various anatomical characteristics cannot be measured in vivo (e.g. moment-arms and location of centre of mass). In this study, computer simulation was performed assuming constant angular velocity, and therefore, no inertial effect in knee forces. No data is available on that issue because most studies used isokinetic assessments to compute knee forces3030 Kellis E, Baltzopoulos V. The effects of the antagonist muscle force on intersegmental loading during isokinetic efforts of the knee extensors. J Biomech. 1999; 32(1):19-25.. However, it is expected that large angular velocity would be observed towards the high flexion angles due to inertial components from resistive force and leg segments mass. Further research would perform simulations using torque-angle profile of injured population (e.g. chondromalacia patellae) to ascertain on how resisitive force would change during knee extension to minimize a particular knee joint force component.
Conclusion
Changing mechanical characteristics of knee extension machine may not be fully translated into reduced knee joint forces. Large reductions in cam radius comparing the free-weight model to other models were limited to the large human force for the constant cam model to other models. Larger human force was estimated to perform knee extension using a constant cam radius compared other models without large effects in knee joint forces.
References
-
1Mirzabeigi E, Jordan C, Gronley JK, Rockowitz NL, Perry J. Isolation of the vastus medialis oblique muscle during exercise. Am J Sports Med. 1999;2(1):50-3.
-
2McMaster DT, Cronin J, McGuigan M. Forms of variable resistance training. Strength Cond J. 2009;3(1):50-64.
-
3Pizzimenti MA. Mechanical analysis of the Nautilus leg curl machine. Can J Sport Sci. 1992;17(1):41-8.
-
4Nolte K, Krüger PE, Els PS. Three dimensional musculoskeletal modelling of the seated biceps curl resistance training exercise. Sports Biomech. 2011;10(2):146-60.
-
5Folland J, Morris B. Variable-cam resistance training machines: Do they match the angle - Torque relationship in humans? J Sports Sci. 2008; 26(2):163-9.
-
6LaPlace DJ, Keskula DR, Heinrichs KI, Perrin DH. Comparison of N-K table offset angles with the human knee flexor torque curve. J Athl Train. 1993;28(1):59-62.
-
7Johnson JH, Colodny S, Jackson D. Human torque capability versus machine resistive torque for four Eagle resistance machines. J Strength Cond Res. 1990;4(3):83-7.
-
8Hatfield FC. A new weight a machine with dynamically adjustable resistance. Auckland, NZ; 1999 [updated 1999; cited 2011 Jun 2]. Available from: https://tinyurl.com/ycjndt3c.
-
9Loss JF, Candotti CT. Comparative study between two elbow flexion exercises using the estimated resultant muscle force. Braz J Physiother. 2008;12(6):502-10.
-
10Escamilla RF. Knee biomechanics of the dynamic squat exercise. Med Sci Sports Exerc. 2001;33(1):127-41.
-
11Ericson MO, Nisell R. Patellofemoral joint forces during ergometric cycling. Phys Ther. 1987;67(9):1365-9.
-
12Ericson MO, Nisell R. Tibiofemoral joint forces during ergometer cycling. Am J Sports Med. 1986;14(4):285-90.
-
13Cohen ZA, Roglic H, Grelsamer RP, Henry JH, Levine WN, Mow VC, et al. Patellofemoral stresses during open and closed kinetic chain exercises: An analysis using computer simulation. Am J Sports Med. 2001;29(4):480-7.
-
14Mason JJ, Leszko F, Johnson T, Komistek RD. Patellofemoral joint forces. J Biomech. 2008;41(11):2337-48.
-
15Besier TF, Draper CE, Gold GE, Beaupré GS, Delp SL. Patellofemoral joint contact area increases with knee flexion and weight-bearing. J Orthop Res. 2005;23(2):345-50.
-
16Salsich GB, Ward SR, Terk MR, Powers CM. In vivo assessment of patellofemoral joint contact area in individuals who are pain free. Clin Orthop Relat Res. 2003;(417):277-84.
-
17Escamilla RF, Fleisig GS, Zheng N, Barrentine SW, Wilk KE, Andrews JR. Biomechanics of the knee during closed kinetic chain and open kinetic chain exercises. Med Sci Sports Exerc. 1998;30(4):556-69.
-
18Wright RW, Preston E, Fleming BC, Amendola A, Andrish JT, Bergfeld JA, et al. A systematic review of anterior cruciate ligament reconstruction rehabilitation: part I: continuous passive motion, early weight bearing, postoperative bracing, and home-based rehabilitation. J Knee Surg. 2008;21(3):217-24.
-
19Wright RW, Preston E, Fleming BC, Amendola A, Andrish JT, Bergfeld JA, et al. A systematic review of anterior cruciate ligament reconstruction rehabilitation: part II: open versus closed kinetic chain exercises, neuromuscular electrical stimulation, accelerated rehabilitation, and miscellaneous topics. J Knee Surg. 2008;21(3):225-34.
-
20Bini RR, Carpes FP, Toledo JM, Loss JF. Estimation of the forces acting on the tibiofemoral joint during knee extension exercises performed on an open kinetic chain strength-training machine. Rev Bras Cineantropom Desempenho Hum. 2008;10(1):35-42.
-
21Matthews LS, Sonstegard DA, Henke JA. Load bearing characteristics of the patello-femoral joint. Acta Orthop Scand. 1977;48(5):511-6.
-
22Arnold EM, Ward SR, Lieber RL, Delp SL. A model of the lower limb for analysis of human movement. Ann Biomed Eng. 2010;38(2):269-79.
-
23de Leva P. Adjustments to zatsiorsky-seluyanov's segment inertia parameters. J Biomech. 1996;29(9):1223-30.
-
24Sharma A, Leszko F, Komistek RD, Scuderi GR, Cates Jr HE, Liu F. In vivo patellofemoral forces in high flexion total knee arthroplasty. J Biomech. 2008;41(3):642-8.
-
25Herzog W, Read LJ. Lines of action and moment arms of the major force-carrying structures crossing the human knee joint. J Anat. 1993;182(Pt 2):213-30.
-
26Bressel E. The influence of ergometer pedaling direction on peak patellofemoral joint forces. Clin Biomech (Bristol, Avon). 2001;16(5):431-7.
-
27Rhea MR. Determining the magnitude of treatment effects in strength training research through the use of the effect size. J Strength Cond Res. 2004;18(4):918-20.
-
28Cohen J. Statistical power analysis for the behavioral sciences. 2nd ed. Hillsdale, NJ: Lawrence Earlbaum Associates; 1988.
-
29Dalleau G, Baron B, Bonazzi B, Leroyer P, Verstraete T, Verkindt C. The influence of variable resistance moment arm on knee extensor performance. J Sports Sci. 2010;28(6):657-65.
-
30Kellis E, Baltzopoulos V. The effects of the antagonist muscle force on intersegmental loading during isokinetic efforts of the knee extensors. J Biomech. 1999; 32(1):19-25.
Publication Dates
-
Publication in this collection
2017
History
-
Received
17 June 2016 -
Accepted
18 Sept 2017