Abstract
Analysis of bacterial diversity in soils along the banks of the Solimões and Negro rivers, state of Amazonas, Brazil, was by partial sequencing of the genes codifying the rDNA16S region. Diversity of operational taxonomic units (OTU) and of the divergent sequences obtained were applied in comparative analysis of microbiological diversity in the two environments, based on richness estimators and OTU diversity indices. The higher OTU diversity in the Solimões was based on the higher number of parameters that evoke this. The interaction between the nucleotide sequences of bacteria inhabiting the two riverine environments indicated that the two microrganism communities are similar in composition.
microbiological diversity; tropical soil biodiversity; 16S rDNA gene; Amazon; molecular biology
Microbial diversity of soils on the banks of the Solimões and Negro rivers, state of Amazonas, Brazil
Ellen Karla Nobre dos SantosI; Rubens Tomio HondaII; Sérgio Ricardo NozawaI; Monica Stropa Ferreira-NozawaI
ILaboratório de Expressão Gênica, Universidade Nilton Lins, Manaus, AM, Brazil
IILaboratório de Macromoléculas Biológicas, Universidade Nilton Lins, Manaus, AM, Brazil
Send correspondence to Send correspondence to: Sergio Ricardo Nozawa Av. Professor Nilton Lins 3259 69058-030 Manaus, AM, Brazil E-mail: srnozawa@gmail.com
ABSTRACT
Analysis of bacterial diversity in soils along the banks of the Solimões and Negro rivers, state of Amazonas, Brazil, was by partial sequencing of the genes codifying the rDNA16S region. Diversity of operational taxonomic units (OTU) and of the divergent sequences obtained were applied in comparative analysis of microbiological diversity in the two environments, based on richness estimators and OTU diversity indices. The higher OTU diversity in the Solimões was based on the higher number of parameters that evoke this. The interaction between the nucleotide sequences of bacteria inhabiting the two riverine environments indicated that the two microrganism communities are similar in composition.
Key words: microbiological diversity, tropical soil biodiversity, 16S rDNA gene, Amazon, molecular biology.
Introduction
The Amazon biome is largely a result of the geological and climatic variables governing its history. The characteristics of the countless species that form the regional fauna and flora are the outcome of the constant, slow-paced adaptations that these organisms have undergone over thousands of years. The importance of the biome itself, not only for Brazil, but also the world in general, is unquestionable, when considering that the chances of sustainable social development are concentrated in the region. The conservation of the biome, through the sustainable use of its resources, also represents an array of possibilities for slowing down global warming. Furthermore, the Amazon itself is also a rich domain for the isolation of soil microorganisms with biotechnological potential.
The equatorial climate is characterized by rains derived from the evaporation of water from both the Atlantic Ocean and the Amazon rainforest, hence the high relative humidity. Rainfall is unevenly distributed in two main seasons, rainy and dry (Sioli, 1991).
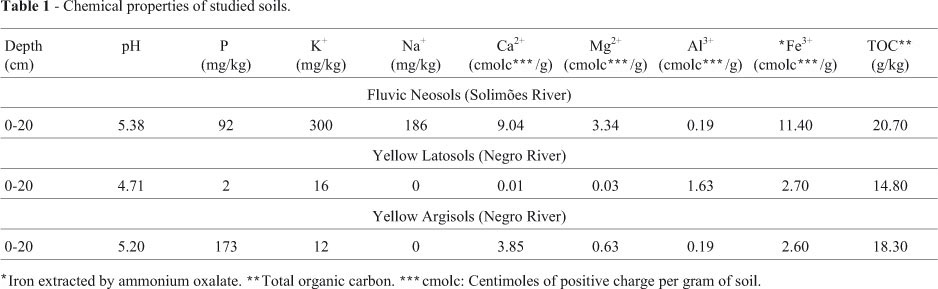
Variations in temperature and humidity affect the local soils, which, with the exception of those subject to anthropogenic influence, are typically poor in terms of biological activity (Mendonça-Santos et al., 2008). Naturally low fertile acid latosols and agrisoils (podzolic soils) account for 64% of the total Brazilian Amazon and 70% of the overall non-floodable area. Floodable gleysols and fluvic neosols are less abundant and enjoy higher fertility. Yellow latosol, yellow agrisoils, fluvic neosol and haplic cambrisol also occur throughout the western regions. Among these, yellow latosol and yellow argisol constitute the banks of the Negro river between 62° W and the confluence of the Negro and Solimões rivers (60° W). Both, presenting low pH values (~ 4.0) at the surface layer between 0 and 20 cm, are reported to be extremely poor in nutrients (Falcão and Silva, 2004).
Organic and mineral matter is deposited on soils of the floodable lowlands along the Solimões River (fluvic neosols), whence the increase in nutrient levels (Oliveira et al., 1992; Falesi and Silva, 1999). Lima et al. (2005), when investigating eutrophic fluvic neosols in the lowlands along the Solimões and the mid portion of the Amazon River, reported pH values ranging from 5.4 to 6.4.
Within this context, microbiological diversity of soils collected along the banks of the Solimões (SMS) and Negro (NMS) rivers was analyzed and mutually compared, with a mind to building up a database of DNA sequences of the Amazon microbiota.
Material and Methods
Soil-samples were collected along the banks of SMS and NMS, upstream of the confluence of both, in an area little affected by anthropic influence, and west of Manaus, capital of the state of Amazonas. All samples were collected during the draught period, on 08/02/2008. SMS samples were collected at around 10 am (S 03° 13' 20.4"; W 59° 59' 16.6"), while those for NMS were obtained at around 12 am (S 03° 08' 12.1"; W 60° 08' 04.9") (Figures 1 and 2).
Three sites, 2 km apart, were chosen for collecting samples representative of each river bank. All were collected at a depth of approximately 10 cm and stored at 4 °C in 50 mL Falcon tubes, which were then sealed, for storage prior to genomic DNA extraction. The chemical properties have already been described by Lima et al. (2005) (Table 1). As to physical properties, these were: Yellow Latosol 110, 50 and 840 g/kg of sand, silt and clay, respectively; Yellow Argisol were 640, 60 and 300 g/kg of sand, silt and clay, respectively, and Fluvic Neosol were 500, 390 and 110 g/kg of sand, silt and clay, respectively (Alfaia, 2006).
Total genomic DNA was extracted directly from soil samples according to the protocol of the SoilMaster DNA kit (Epicentre, Madison, WI, USA). The protocol includes a chromatography step to remove the enzyme inhibitors or organic contaminants present in soils (Schneegurt et al., 2003). 16S rDNA regions were amplified by PCR (Sam-brook and Russel, 2001; Silva-Pereira, 2003), using 16SF1 and 16SR1 primers (Table 2).
The PCR product was cloned according to standard protocols (Sambrook and Russel, 2001) in a pGEM-T Easy (Promega, Madison, WI, USA) vector, using E. coli (Mos blue) in heat-shock transformation. Plasmid DNA extracted by alkaline lysis, was sequenced in duplicate using the Big Dye Terminator Cycle Sequencing Ready AB1 Prism Version 3 (Applied Biosystems, Foster City, CA, USA) DNA sequencing kit, and M13/pUC forward and reverse primers (Clonetech, Mountain View, CA, USA). After capillary electrophoresis, sequence base quality was assessed through Sequencing Analysis 5.3 software (Applied Biosystems, Foster City, CA, USA).
Consensus sequences were obtained with Phred/Phrap/Consed (Ewing et al., 1998; Gordon et al., 1998) software, and vector analysis was done using VecScreen software. Base divergence in consensus sequences was analyzed using the MEGA 4.1 (Tamura et al., 2007) software so as to group sequences considered similar. For each group thus formed, a representative sequence was chosen and for each representative sequence, the frequency of each OTU was determined through multiple alignments using the ClustalW (Thompson et al., 1994) software. A distance matrix was constructed, according to the maximum composite likelihood method (Tamura et al., 2004), with the exclusion of all positions containing gaps. The subsequently constructed dendrogram - replication bootstrap 10,000 (Felsenstein, 1985) - was according to the neighbor-joining method (Saitou and Nei, 1987).
EstimateS 8.2.0 (Colwell, 2006) software was used when calculating the parameters of molecular ecology, as to the frequencies of each divergent sequence or OTU. These parameters were represented by the ACE and Chao1 richness estimators, and by the Fisher's Alpha, Shannon (H') and Simpson diversity indices.
Statistical analysis was with BioEstat 5.0 (Ayres et al., 2007) software, with a significance level of 0.05. ANOVA (F) was applied for assaying the percentage of divergent nucleotides between sequences or OTUs. The Student's t-test was used to compare the proportion of each nucleotide in the two environments.
Results
The number of valid clones in each sample (SMS and NMS) is shown in Table 3. No statistically significant difference was observed between the number of valid clones in each environment (r = 0.999, t = 27.135, p = 0.023); likewise for the number of sequences generated (r = 0.999, t = 27.501, p = 0.023).
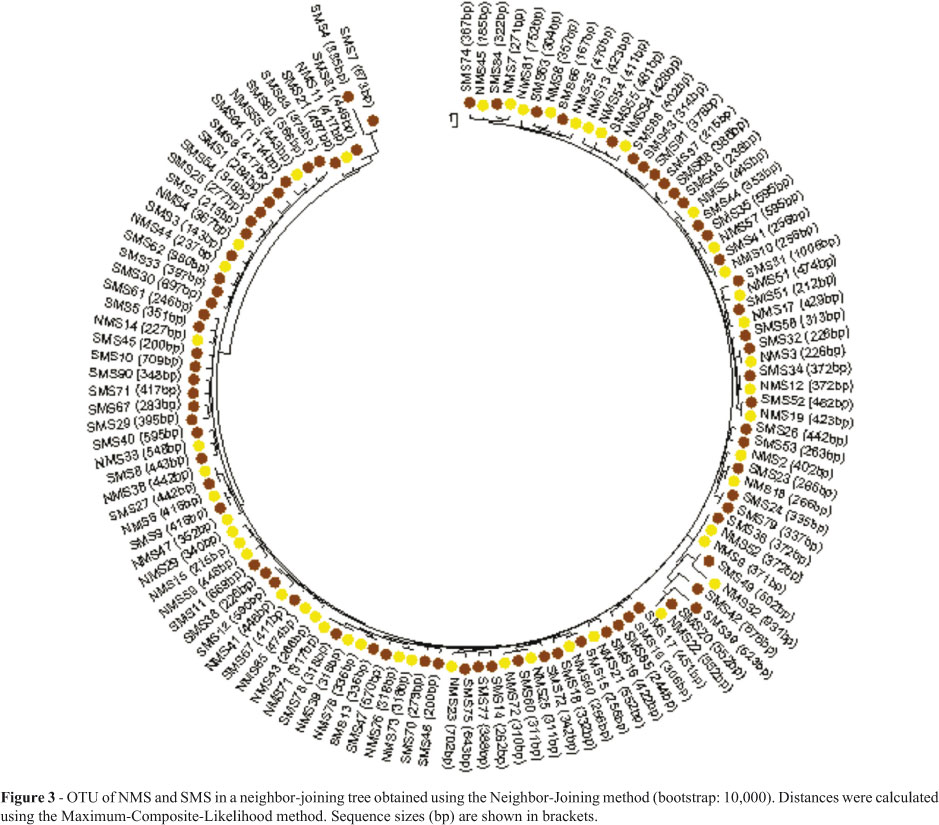
Based on the sequences generated, the 94 (SMS) and 81 (NMS) contigs (consensus sequences) obtained were represented by 78 and 47 OTUs, respectively, which were subsequently characterized based on dendrograms generated by the neighbor-joining method with MEGA 4.1 software.
MEGA 4.1 (Data Explorer) software was used to align sequences according to the ClustalW algorithm and the ratio of conserved versus variable sites (Table 4). The frequency of each nucleotide in each sequence, mean nucleotide frequency, and the size of sequences were measured (Table 5). In SMS, the frequency of A + T was 48% and of G + C 52%, whereas in NMS, these were 49% and 51%, respectively. This ratio is reflected in the profile of microrganisms contained within the clones sequenced for the two environments (He, 2004).
The diversity in OTUs obtained in SMS and NMS was compared using the ecological parameters applied in molecular ecology (Table 6). In SMS, 94 sequences were distributed among 78 OTUs, of which 75 were represented by one (singletons) or two (doubletons) sequences. In NMS, 81 sequences were distributed among 47 OTUs, of which 37 were represented by one or two sequences. ACE and Chao1 estimators indicated higher relative richness for SMS-OTUs. The Simpson index implies that, with a certain probability, two sequences taken at random from an infinitely large community may belong to different species (Dias, 2004; Melo, 2008). However, the program used was based on the Inverse Simpson index, whereby the inference that diversity inversely indicates the probability of the two sequences analyzed belonging to the same OTU (Navar-rete, 2009).
The relationship between OTUs in SMS and NMS was analyzed in combination, using the MEGA 4.1 software, when all 135 OTUs were aligned to obtain a single dendrogram (Figure 3). Notably, some sequences obtained from independent samples collected in either of the two sites were similar (zero distance). Furthermore, there was no formation of distinct clusters.
Discussion
In SMS, the 78 divergent sequences accounted for 83% of the 94 consensus sequences obtained from locally collected samples, whereas for NMS, under the same conditions, the proportion was 47 divergent sequences representing 58% of the 81 consensus sequences. In the present study, the percentage of divergent sequences correlated positively with diversity of the respective collection site. Previous investigations, such as those undertaken by He (2004), Silveira (2004) and Navarrete (2009), revealed less OTUs in collection sites presenting lower species diversity.
According to He (2004), the percentage of invariable or conserved sites among sequences may be used as an indicator of both variance or diversity, where the lower percentage of conserved sites indicates not only higher sequence variability, but also higher microbiological diversity. In the present case, the proportion of conserved sites was lower in samples collected in SMS. He (2004) also showed that a higher percentage of variable sites in a group of sequences may represent a higher variability between sequences (OTU) in a community. Once again, SMS presented the highest percentage of variable sites (Table 4).
Analysis of variance in the percentage of each nucleotide per OTU revealed significant differences in frequency in SMS (F = 8.65, p = 0.001), more specifically between thiamine and cytosine (p = 0.01), thiamine and guanine (p = 0.01), and adenine and guanine (p = 0.05). In NMS, there were no statistically significant differences (F = 1.51; p = 0.21), thereby indicating a more uniform distribution.
The Student's t-test used to compare the OTUs in SMS to those in NMS revealed no statistically significant difference between the proportions of each nucleotide (p > 0.05). Table 5 shows the mean frequency of nucleotides obtained in the OTUs from samples collected in the two sites.
In SMS, A+T frequency was 48% and G+C, 52%, and in NMS 49% and 51%, respectively (Table 5). These frequencies are reflected in the microorganism profiles of the clones sequenced for the two environments. As previously denoted by He (2004), this is taken to mean that the microorganisms present in the two environments on average have similar ratios of these bases in their 16S rDNA.
So as to compare samples collected in both sites, ecological parameters, as used in molecular ecology, were calculated. Molecular ecology is applicable to evaluating OTU diversity (He, 2004; Silveira, 2004; Fierer and Jackson, 2006; Pereira et al. 2006; Cannavan, 2007; Navarrete, 2009; Navarrete et al., 2010). In the present study, the parameters evaluated were the richness estimators, ACE (Abun-dance-base Coverage Estimator) and Chao1, as well as the diversity indices Fisher's alpha, and Shannon and Simpson coefficients.
According to Dias (2004), current research reports to more than one index, with the Shannon-Wiener or Shannon and Simpson indices as among those most applied for measuring species diversity based on relative species abundance. Dias (2004) also pointed out that one and the same dataset in a fauna or flora survey may be analyzed by using more than one diversity index or richness estimator. Nevertheless, the author maintains that the decision for a specific index should be coherently in accordance with the specific experimental design of the study.
As in previous investigations (Silveira, 2004; Pereira et al., 2006; Cannavan, 2007), Estimate S 8.2.0 software was used to assess ecological parameters of each collection site on the frequency of each OTU in SMS and NMS. In SMS, OTUs corresponded to 78 divergent sequences and in NMS to the 47, respectively (Table 5).
It is important to note that Chao1 was calculated according to the default settings of the software (Classic option) to adjust the diversity settings (VC > 0.5). Therefore, Chao1 and ACE were better estimated based on the abundance of OTUs (Chao's estimated CV for abundance and distribution = 1.2).
In SMS, 94 sequences were distributed in 78 OTUs, of which 75 were represented by one or two sequences, whereas in NMS, 81 were distributed in 47, with 37 represented by one or two sequences (Table 5). As mentioned, the proportion of OTUs correlated positively with diversity in the environment studied. This correlation, also applicable to the proportion of singletons and doubletons in the samples analyzed in the present case, implied accordingly that species diversity was higher in SMS.
By inference, ACE and Chao1 estimators indicate SMS as presenting the highest OTU richness of the two (Table 5). The calculation of ACE is based on the concept of sample coverage (Dias, 2004), thereby reflecting either abundance or the number of singletons and doubletons. Calculation of Chao1 is also based on abundance.
According to the Fisher's alpha and Shannon (H') indices, SMS presented the highest OTU diversity. However, the inverse Simpson index indicated that the highest OTU diversity was observed in NMS (Colwell, 2005; Cannavan, 2007; Navarrete, 2009) (Table 5). The inverse Simpson index states that diversity correlates negatively with the probability that two sequences analyzed belong to the same OTU (Navarrete, 2009). The Simpson index in turn implies the probability that two individuals (sequences) randomly removed from a large, infinite community belong to different species (Dias, 2004; Melo, 2008).
The assessment of additional parameters in the present study also indicated higher OTU richness and diversity in SMS samples, probably associated to soil characteristics favorable to the development of microorganisms (He, 2004), viz., soil humidity which, when high, reportedly induces increased bacterial diversity (Moreira and Siqueira , 2006). Furthermore, Fierer and Jackson (2006), when studying soil pH, concluded that the parameter strongly conduces to bacterial diversity.
The higher humidity content in soil samples collected in SMS, noted both visually on the spot and while handling in the laboratory, is a possible consequence of the nearness of sampling sites to the river waterline. Notably, soils that comprise levees are rich in nutrients (Falesi and Silva, 1999). Nonetheless, besides paucity in nutrients, those belonging to the Negro riverbanks characteristically present low effective cation-exchange capabilities (Falcão and Sil-va, 2004).
A further factor that plays a relevant role in microbiological diversity in a community, is the propensity to propagate plant-cover (Moreira and Siqueira, 2006). In this sense, the sampling sites in SMS presented thicker plant--cover when compared to NMS (Figures 1 and 2).
Furthermore, and as observed in SMS, besides a large root system, gramineous plants present high rhizode-po-sition rates, thereby inducing soil aggregation and structure improvement. These characteristics have been reported as positive factors in the development of microbiological com-munities (Moreira and Siqueira, 2006).
The pH of soils that form the Solimões riverbanks varies within the range 5.4 < pH < 6.4, the most propitious for the growth of microorganisms, whereas along the Negro river, the pH is approximately 4.0 (Falcão and Silva, 2004; Lima et al., 2005). According to Fierer and Jackson (2006), soil pH was by far the best parameter for predicting bacterial species diversity and richness. They also observed that acidic soils are the least favorable in terms of richness and diversity inducement.
Fierer and Jackson (2006) also reported no clear association between bacterial diversity in soils and plant diversity. For example, low bacterial diversity indices (H' = 2.5-2.7) were obtained for the mainland Peruvian Amazon. This was corroborated by the data obtained in the present study, since plant-cover in the soil sampled in SMS was somewhat uniform, with relatively few plant species (Figure 1). Furthermore, Fierer and Jackson (2006) detected no unambiguous relationship between soil bacterial diversity and the latitude of sampling sites or environmental factors, such as mean annual temperature and potential evapotranspiration, both considered effective animal and plant diversity predictors.
As to soil humidity, Batista (2006) reported that hydric stress reduces microbial populations in forest soils. The author concluded that low precipitation, as observed in the area studied, might give rise to both a reduction in microbial populations and enzymatic activity in soils. Nevertheless, apparently light rainfall did not affect microbial diversity so extensively in terms of bacterial genera, since the number of taxonomic groups remained constant.
The dendrogram generated from OTUs obtained from samples collected in the two environments (Figure 3), placed in evidence the similarity of the two respective OTU profiles, a clear indication of the significant difference between the two biological communities themselves.
Apparently, geographic distances between different ecosystems exert no influence on similarity in composition of bacterial communities (Fierer and Jackson, 2006), thus presupposing soils with comparable environmental characteristics to serve as habitats for similar bacterial agglomerations, independent of geographic distance. Just as the differences in ecological parameters studied in each of the environments sampled may represent the differences in terms of soil characteristics that, in SMS, favored higher OTU diversity, when compared to NMS, the similarities in the profiles rendered for the two environments really do indicate the two environments to be comparable.
The environments studied (SMS and NMS) are similar in several aspects, this including the presence of comparable plant-cover. Moreover, both of the soils sampled, besides being rhizospheric, are in the same geographical region - hence, the similarity between mean temperature and mean rainfall -, present an analogous chemical composition, although the components are present at different concentrations, and are exposed to only slight anthropic influence. Moreover, the climatic conditions in both environments are not extreme. Worthy of note, the similar mean profile of the bacterial communities collected in the two environments, based on G+C pair frequency analysis, is in agreement with and complementary to the 16S rDNA sequence profile represented by the dendrogram.
In conclusion, on considering the diversity of both OTUs and divergent sequences obtained, and based on richness-estimator and diversity-index data, a comparison of microbial diversity in the two environments studied indicated SMS as presenting the higher diversity, due to the more appropriate conditions, viz., ACE, Chao1, Fisher, Shannon, and Simpson inverse. Moreover, the profile of the interaction between the nucleotide sequences obtained, also pointed to little similarity in the microbiological composition of the two communities.
Acknowledgments
The authors thank the Conselho Nacional de Desen-vol-vimento Científico e Tecnológico (CNPq), Fundação de Apoio a Pesquisa do Estado de Amazônia (FAPEAM -PIPT), Coordenação de Aperfeiçoamento de Pessoal de Nivel Superior (CAPES) and Universidade Nilton Lins.
Internet Resources
Received: August 9, 2011
Accepted: November 17, 2011.
Associate Editor: Célia Maria de Almeida Soares
License information: This is an open-access article distributed under the terms of the Creative Commons Attribution License, which permits unrestricted use, distribution, and reproduction in any medium, provided the original work is properly cited.
- Alfaia SS (2006) Characterization and distribution of organic forms of nitrogen in three soils of Central Amazônia. Acta Amazonica 36:135-140.
- Altschul SF, Gish W, Miller W, Myers EW and Lipman DJ (1990) Basic local alignment search tool. J Mol Biol 215:403-410.
- Ayres M, Ayres Junior M, Ayres DL and Santos AAS (2007) BioEstat. Aplicações Estatísticas nas Áreas das Ciências Bio-Médicas. Sociedade Civil Mamirauá / MCT-CNPq / Conservation International, Belém, 324 pp.
- Conesa A, Götz S, García-Gómez JM, Terol J, Talón M and Robles M (2005) Blast2GO: A universal tool for annotation, visualization and analysis in functional genomics research. Bioinformatics 21:3674-3676.
- Dias SC (2004) Planejando estudos de diversidade e riqueza: Uma abordagem para estudantes de graduação. Acta Scient Biol Sci 26:373-379.
- Edwards U, Rogall T, Blocker H, Emde M and Bottger EC (1989) Isolation and direct complete nucleotide determination of entire genes - characterization of a gene coding for 16S--ribosomal RNA. Nucleic Acids Res 17:7843-7853.
- Escobar B, Bustos K, Morales G and Salazar O (2008) Rapid and specific detection of Acidithiobacillus ferrooxidans and Leptospirillum ferrooxidans by PCR. Hydrometallurgy 92:102-106.
- Ewing B, Hillier L, Wendl M and Green P (1998) Basecalling of automated sequencer traces using phred. I. Accuracy assessment. Genome Res 8:175-185.
- Falcão NPS and Silva JRA (2004) Características de adsorção de fósforo em alguns solos da Amazônia Central. Acta Amazo-nica 34:337-342.
- Falesi IC and Silva BNR (1999) Ecossistemas de Várzeas da Região do Baixo Amazonas. Embrapa Amazônia Oriental, Belém, 75 pp.
- Felsenstein J (1985) Confidence limits on phylogenies: An approach using the bootstrap. Evolution 39:783-791.
- Fierer N and Jackson RB (2006) The diversity and biogeography of soil bacterial communities. Proc Natl Acad Sci USA 103:626-631.
- Gordon D, Abajian C and Green P (1998) Consed: A graphical tool for sequence finishing. Genome Res 8:195-202.
- Lane DJ (1991) 16S/23S rRNA sequencing. In: Stackebrandt E and Goodfellow M (eds) Nucleic Acid Techniques in Bacterial Systematics. John Wiley & Sons, New York, pp 115--147.
- Lane DJ, Pace B, Olsen GJ, Stahl DA, Sogin ML and Pace NR (1985) Rapid determination of 16S ribosomal RNA sequences for phylogenetic analyses. Proc Natl Acad Sci USA 82:6955-6959.
- Lima HN, Mello JWV, Schaefer CEGR and Ker JC (2005) Dinâ-mica da mobilização de elementos em solos da Amazônia submetidos à inundação. Acta Amazonica 35:317-330.
- Melo AS (2008) O que ganhamos 'confundindo' riqueza de espé-cies e equabilidade em um índice de diversidade? Biota Neotrop 8:21-27.
- Mendonça-Santos ML, Santos HG, Coelho MR, Bernardi ACC, Machado PLOA, Manzatto CV and Fidalgo ECC (2008) Solos e ocupação das terras na Amazônia brasileira. In: Moreira FMS, Siqueira JO and Brussaard L (eds) Biodi-ver-sidade do Solo em Ecossistemas Brasileiros. UFLA, Lavras, pp 67-116.
- Moreira FMS and Siqueira JO (2006) Ecologia do solo. In: Micro-biologia e Bioquímica do Solo. 2nd edition. UFLA, Lavras, pp 83-161.
- Navarrete AA, Cannavan FS, Taketani RG and Tsai SM (2010) A molecular survey of the diversity of microbial communities in different amazonian agricultural model systems. Diversity 2:787-809.
- Oliveira JB, Jacomine PK and Camargo MN (1992) Classes Gerais de Solos do Brasil. Guia Auxiliar para seu Reconhe-cimento. 2nd edition. FUNEP, Jaboticabal, 201 pp.
- Pereira RM, Silveira EL, Scaquitto DC, Pedrinho EAN, Val--Mo-raes SP, Wickert E, Carareto-Alves LM and Lemos EGM (2006) Molecular characterization of bacterial populations of different soils. Braz J Microbiol 37:439-447.
- Saitou N and Nei M (1987) The neighbor-joining method: A new method for reconstructing phylogenetic trees. Mol Biol Evol 4:406-425.
- Sambrook J and Russel DW (2001) Molecular Cloning. A Laboratory Manual. 3rd edition. Cold Spring Harbor Laboratory Press, New York.
- Schneegurt MA, Dore SY and Kulpa Jr CF (2003) Direct extraction of DNA from soils for studies in microbial ecology. Curr Issues Mol Biol 5:1-8.
- Silva-Pereira I (2003) Amplificação de DNA por PCR. In: Aze-vedo MO, Felipe MSS, Brígido MM, Maranhão AQ and De-Souza MT (eds) Técnicas Básicas em Biologia Molecular. Universidade de Brasília, Brasília, pp 99-110.
- Sioli H (1991) Amazônia. Fundamentos da Ecologia da Maior Região de Florestas Tropicais. 3rd edition. Vozes, Petró-polis, 72 pp.
- Stackebrandt E and Liesack W (1993) Nucleic acids and classification. In: Goodfellow M and O'Donnell AG (eds) Handbook of New Bacterial Systematics. Academic Press, London, pp 152-189.
- Tamura K, Nei M and Kumar S (2004) Prospects for inferring very large phylogenies by using the neighbor-joining method. Proc Natl Acad Sci USA 101:11030-11035.
- Tamura K, Dudley J, Nei M and Kumar S (2007) MEGA4: Molecular Evolutionary Genetics Analysis (MEGA) ver. 4.0. Mol Biol Evol 24:1596-1599.
- Thompson JD, Higgins DG and Gibson TJ (1994) CLUSTALW: Improving the sensitivity of progressive multiple sequence alignment through sequence weighting, position-specific gap penalties and weight matrix choice. Nucleic Acids Res 22:4673-4680.
- Batista SB (2006) Diversidade e atividades microbianas do solo da Floresta Amazônica - Brasil, submetida a estresse hídrico utilizando técnicas de biologia molecular [tese]. Rio de Janeiro (RJ): UFRJ / IMPPG, http://www.dominiopublico.gov.br/download/texto/cp036704.pdf (August, 2010).
- Cannavan FS (2007) Diversidade das comunidades bacterianas em solos de Terra Preta Antropogênica da Amazônia Central e Oriental [dissertação]. Piracicaba (SP): Universidade de São Paulo/ESALQ, http://www.teses.usp.br/teses/disponiveis/91/91131/tde-01022008-085546/pt-br.php (October 15, 2010).
- Colwell RK (2005) EstimateS: Statistical estimation of species richness and shared species from samples. Version 7.5. User's Guide and application, http://purl.oclc.org/estimates (September, 2010).
- Colwell RK (2006) Estimates: Statistical estimation of species richness and shared species from samples, ver. 8, http://purl.oclc.org/estimates (September, 2010).
- He J (2004) Molecular biological studies of soil microbial communities under different management practices in forest ecosystems of Queensland [thesis]. Griffith University / Faculty of Environmental Sciences, http://www4.Gu.edu.au:8080/adt-root/public/adt-QGU20060309.095702/index.html (October 15, 2010).
- Navarrete AA (2009) Estrutura e diversidade de comunidades microbianas em solos sob diferentes sistemas de uso da terra na Amazônia Ocidental [dissertação]. Piracicaba (SP): Uni-versidade de São Paulo/ESALQ, http://www.teses.usp.br/teses/disponiveis/91/91131/tde-13102009-135502/pt-br.php (October 15, 2010).
- Silveira EL (2004) Identificação de comunidades bacterianas de solo por seqüenciamento do gene 16S rRNA [dissertação]. Jaboticabal (SP): Universidade Estadual Paulista, http://www.athena.biblioteca.unesp.br/exlibris /bd/bja/33004102070P6/2004/silveira_el_me_jabo.pdf (October 27, 2010).
- VecScreen software, http://www.ncbi.nlm.nih.gov/VecScreen/VecScreen.html
Publication Dates
-
Publication in this collection
03 Feb 2012 -
Date of issue
2012
History
-
Received
09 Aug 2011 -
Accepted
17 Nov 2011