Abstract
The Atlantic Forest is one of the most diverse ecosystems in the world and considered a hotspot of biodiversity conservation. Dalbergia nigra (Fabaceae) is a tree endemic to the Brazilian Atlantic Forest, and has become threatened due to overexploitation of its valuable timber. In the present study, we analyzed the genetic diversity and fine-scale spatial genetic structure of D. nigra in an area of primary forest of a large reserve. All adult individuals (N = 112) were sampled in a 9.3 ha plot, and genotyped for microsatellite loci. Our results indicated high diversity with a mean of 8.6 alleles per locus, and expected heterozygosity equal to 0.74. The co-ancestry coefficients were significant for distances among trees up to 80 m. The Sp value was equal to 0.017 and indirect estimates of gene dispersal distances ranged from 89 to 144 m. No strong evidence of bottleneck or effects of human-disturbance was found. This study highlights that long-term efforts to protect a large area of Atlantic Forest have been effective towards maintaining the genetic diversity of D. nigra. The results of this study are important towards providing a guide for seed collection for ex-situ conservation and reforestation programmes of this threatened species.
Dalbergia nigra; Atlantic Forest; conservation genetics; fine-scale spatial genetic structure; Sp statistic
Fine-scale spatial genetic structure of Dalbergia nigra (Fabaceae), a threatened and endemic tree of the Brazilian Atlantic Forest
Renata Santiago de Oliveira BuzattiI; Renata Acácio RibeiroII; José Pires de Lemos FilhoIII; Maria Bernadete LovatoI
IDepartamento de Biologia Geral, Instituto de Ciências Biológicas, Universidade Federal de Minas Gerais, Belo Horizonte, MG, Brazil
IIDepartamento de Ciências Biológicas, Faculdade de Ciências Biológicas e da Saúde, Universidade Federal dos Vales de Jequitinhonha e Mucuri, Diamantina, MG, Brazil
IIIDepartamento de Botânica, Instituto de Ciências Biológicas, Universidade Federal de Minas Gerais, Belo Horizonte, MG, Brazil
Correspondence Correspondence: Maria Bernadete Lovato Departamento de Biologia Geral Instituto de Ciências Biológicas Universidade Federal de Minas Gerais Caixa Postal 486, 31270-901 Belo Horizonte, MG, Brazil E-mail: lovatomb@icb.ufmg.br
ABSTRACT
The Atlantic Forest is one of the most diverse ecosystems in the world and considered a hotspot of biodiversity conservation. Dalbergia nigra (Fabaceae) is a tree endemic to the Brazilian Atlantic Forest, and has become threatened due to overexploitation of its valuable timber. In the present study, we analyzed the genetic diversity and fine-scale spatial genetic structure of D. nigra in an area of primary forest of a large reserve. All adult individuals (N = 112) were sampled in a 9.3 ha plot, and genotyped for microsatellite loci. Our results indicated high diversity with a mean of 8.6 alleles per locus, and expected heterozygosity equal to 0.74. The co-ancestry coefficients were significant for distances among trees up to 80 m. The Sp value was equal to 0.017 and indirect estimates of gene dispersal distances ranged from 89 to 144 m. No strong evidence of bottleneck or effects of human-disturbance was found. This study highlights that long-term efforts to protect a large area of Atlantic Forest have been effective towards maintaining the genetic diversity of D. nigra. The results of this study are important towards providing a guide for seed collection for ex-situ conservation and reforestation programmes of this threatened species.
Keywords: Dalbergia nigra, Atlantic Forest, conservation genetics, fine-scale spatial genetic structure, Sp statistic.
Introduction
The Brazilian Atlantic Forest is one of the most di-verse ecosystems in the world (Morellato and Haddad, 2000), with an estimated plant diversity of fifteen thousand species, 45% of which are endemic (Stehmann et al., 2009). This ecosystem is a hotspot for biodiversity conservation, since its high species richness and endemism have been subject to intensive anthropogenic disturbance for centuries (Myers 1988; Myers et al., 2000). Currently this ecosystem is highly fragmented, and only about 7.5% of 1,227,600 km2 of original forest remains (Myers et al., 2000). Approximately 83% of the remaining fragments of Atlantic Forest have an area of less than 50 ha, while only 0.03% exceed 10,000 ha (Ribeiro et al., 2009a). According to Ribeiro et al. (2009a), the effort allocated to the conservation of large remnants of primary forest should be a priority, since the preservation of sensitive species depends exclusively on the conservation of these larger fragments. Moreover, large fragments promote the preservation of core areas that are sources of seeds for both surrounding areas and reforestation programmes (Ribeiro et al., 2009a).
In tropical forests, anthropogenic changes to the landscape affect pollen and seed dispersal. Although trees are less vulnerable to human-induced interference than other organisms (Hamrick, 2004), tropical trees are extremely dependent on animals for pollination and seed dispersal, which might be highly affected by the degradation of this habitat (Pacheco and Simonetti, 2000; Wang et al., 2007). Hence, alterations in the wildlife associated to tropical forests have large impacts to the mating system and spatial genetic structure (SGS) of trees, especially in fragmented populations (Murawski and Hamrick, 1992; Hall et al., 1994; With et al., 1999; Pither et al., 2003). SGS, which is the nonrandom distribution of genotypes in a given space, is often a consequence of multiple processes, such as historical demographic changes, selection and limited gene flow (Vekemans and Hardy, 2004; Randall et al., 2010). In plants, gene flow through the pollen and seeds determines whether alleles are widely or locally dispersed (Bradshaw, 1972; Levin and Kerster, 1974). However, the dispersion distance is small compared to the area covered by plant populations, which can promote fine-scale SGS (Vekemans and Hardy, 2004; Lopez-Gallego and O'Neil, 2010). Seed dispersal more strongly influences genetic structuring of populations than pollen movement (Chung et al., 2003). When long-distance pollen movement occurs, restricted seed dispersal might result in the grouping of half-sibs near to the maternal plant (Berg and Hamrick, 1994). Moreover, if both pollen movement and seed dispersal are limited, this will result in inbreeding and an increase in SGS (Sokal and Wartenberg, 1983; Hamrick and Nason, 1996). In contrast, if only short-distance pollen dispersal occurs, wide and independent seed dispersal will ensure the distribution of genetic variation, leading to weak or near random structuring (Dewey and Heywood, 1988; Loiselle et al., 1995; Chung et al., 2000; 2003). Furthermore, fine-scale SGS studies allow us to infer the extent of gene dispersal within species indirectly. This method is especially convenient for tropical trees, as it is quite difficult to directly monitor pollen and seed movement in these species (Born et al., 2008).
The level of intrapopulation SGS should be considered by conservation programmes of threatened species, since it can influence estimates of genetic parameters (Ennos and Clegg, 1982; Young and Boyle, 2000; Bittencourt and Sebbenn, 2007). Hence, it is important to establish sampling strategies for ex situ and in situ conservation procedures (Doligez and Joly, 1997; Sebbenn et al., 2008; Tarazi et al., 2010). Therefore, obtaining knowledge about fine-scale genetic variation provides a guideline for the management of natural populations (Hamrick and Sherman-Broyles, 1992; Williams and Hamrick, 1996).
Dalbergia nigra (Vell.) Allemao ex Benth, popularly known as Brazilian rosewood, is a legume tree that is endemic to the Brazilian Atlantic Forest. Due to more than five centuries of overexploitation of its high quality timber and biome deforestation, this species has become threatened and restricted to small fragments, parks and reserves (Costa et al., 1998). Since 1998, it has been listed as "vulnerable" in the Red List of the International Union for Conservation Nature (IUCN, 2007), with international trade being prohibited (CITES, 1992). The mating system of this species is not known. Bees probably perform pollination, and seeds are dispersed by the wind (Carvalho, 1994). Although much effort is required to protect this species, few genetic studies have been performed to date (Ribeiro et al., 2005, 2011; Juchum et al., 2007; Resende et al., 2011) and we are not aware of any study about fine-scale spatial genetic structure of D. nigra.
In the present study, we analyse the genetic diversity and fine-scale spatial genetic structure of D. nigra located in an area of continuous primary forest of a large reserve of Atlantic Forest. In a 9.3 ha plot, we sampled all adult individuals (N= 112) and genotyped them for microsatellite loci. Specifically, we sought to answer the following questions: (1) What is the level of genetic diversity of D. nigra in this primary forest area? (2) What is the extent of SGS in this population? (3) What is the distance of gene dispersal? (4) What is the required minimum distance among trees to collect seeds for conservation programmes in a way to prevent inbreeding and promote a good representation of genetic diversity? (5) Have the long-term efforts of preserving a large remnant of Atlantic Forest been effective in conserving genetic diversity of D. nigra?
Materials and Methods
Study area and sampling
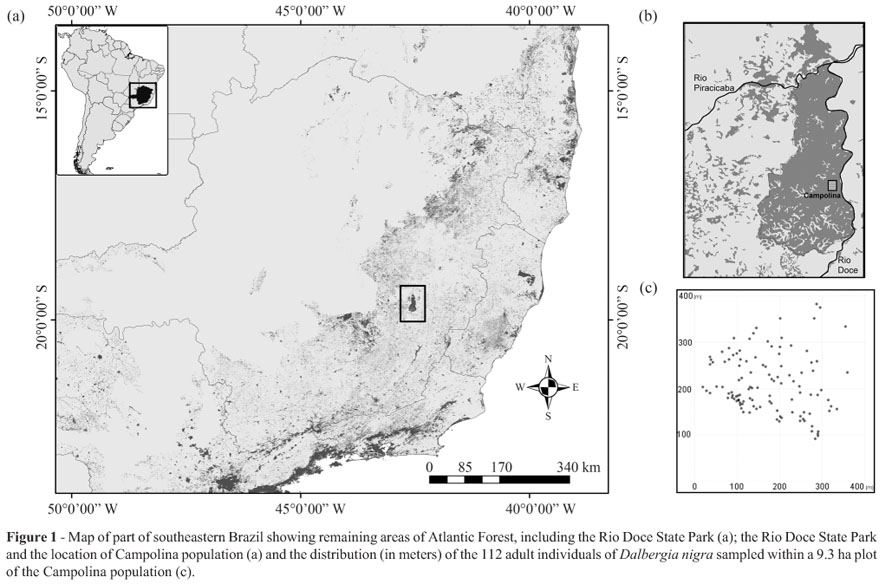
Samples of D. nigra used for this study were collected in the Rio Doce State Park Biological Reserve (from 19º48'18" to 19º29'24" S and 42º38'30" to 42º28'18" W), which was implemented in 1944 (IEF, 2002) and is located in the state of Minas Gerais, southeastern Brazil (Figure 1a, b). It is the largest remnant of Atlantic Forest in this state, with a total area of 36,000 ha of native primary and secondary vegetation (Solá, 2001). The sampled area, named Campolina, comprises130 ha of undisturbed primary forest vegetation (Ribeiro et al., 2005). One plot of 9.3 ha was randomly delimited and the cambium of 112 adult trees was sampled (density = 12.0 trees/ha) for the analysis of diversity and fine-scale spatial genetic structure. The diameter at breast height (dbh) of the sampled trees ranged from 10 to 53 cm, with an average of 23.3 cm and median of 21 cm. The spatial distribution of trees (Figure 1c) was recorded using GPS Garmin 60CSx and visualised with TrackMaker 11.7 software (Ferreira Jr, 2001).
DNA isolation and genotyping
Total genomic DNA was extracted from 2.5 mg of cambium following the protocol of Novaes et al. (2009). Seven polymorphic nuclear microsatellite loci (Dnig1, Dnig2, Dnig4, Dnig5, Dnig6, Dnig7 and Dnig10), which have been previously isolated and characterised by Ribeiro et al. (2009b), were used for genetic analyses. PCR amplifications were performed using the conditions established by Ribeiro et al. (2009b), which included a universal fluorescent-labelled M13 tail primer, and following the protocol described by Schuelke (2000). Microsatellite fragments were analysed in a MegaBACE 1,000 automated sequencer (Amersham Biosciences) using 0.1% Tween 20 and ROX500 Size Standard (GE Healthcare), and scored using the MegaBACE Fragment Profiler 1.2 software (Amersham Biosciences).
Genetic diversity and bottleneck detection
Allelic frequencies, the number of alleles (A), and observed and Hardy-Weinberg expected heterozygosities (HO and HE) were computed using Arlequin v.3.1 software (Excoffier et al., 2005). The fixation indices (FIS) were estimated using Arlequin. Scoring errors due to the presence of null alleles, stuttering or large allele dropout were tested with Micro-Checker software (van Oosterhout et al., 2004). The frequencies of null alleles were also estimated using Cervus v.3.0.3 (Marshall et al., 1998). The null allele frequencies were high for the loci Dnig1 and Dnig6 (around 32% and 33%, respectively). These loci were removed from kinship, substructure and bottleneck analyses. In the diversity analyses, estimates were performed under three conditions: 1) including loci with null alleles, 2) excluding these loci and 3) including all loci but with correction of null alleles by the Brookfield method (Brookfield, 1996) implemented by Micro-Checker (van Oosterhout et al., 2004). According to Dakin and Avise (2004), about 90% of all studies include loci with null alleles in the analyses, but few of these incorporate statistical corrections to accommodate possible null alleles effects.
To check whether low heterozygosities were caused by the Wahlund effect, the population substructure was investigated using the Bayesian method with MCMC (Markov Chain Monte Carlo) estimation implemented in Structure v.2.2 (Falush et al., 2007). We used an admixture model, which was run 10 times for one to four clusters, k = 1 to 4, using burn-in lengths of 100,000 and run lengths of 100,000 MCMC steps.
The program Bottleneck v.1.2 (Piry et al., 1999) was used to detect the presence of recent bottlenecks in the studied population. The bottleneck test assumes that population reductions cause a faster decline in the number of alleles than expected heterozygosity in the Hardy-Weinberg equilibrium (HE). Thus HE becomes greater than HEq (heterozygosity at mutation-drift equilibrium), since HEq is calculated based on allele number (Cornuet and Luikart, 1996). Three mutation models were employed: 1) the Infinite Allele Model -IAM (Kimura and Crow, 1964); 2) the Stepwise Mutation Model -SMM (Ohta and Kimura, 1973), and 3) the Two-Phase model -TPM (Di Rienzo et al., 1994). Di Rienzo et al. (1994) found that mutational changes in SSR primarily result in an increase or decrease of one repeat unit (SMM). As rare and important events of larger magnitude also occur (IAM), these authors proposed a mixed model (TPM). We applied the TPM with a variance of 12 (Piry et al., 1999) and different percentages of single-step mutations (60-95%). We ran 1,000 iterations and tested significance with the Wilcoxon signed-rank test. According to Piry et al. (1999), this is the most powerful and robust test when using only few (< 20) polymorphic loci.
Fine-scale spatial genetic structure and dispersal estimate
To visualise and describe the genetic structure within populations, the co-ancestry coefficient (synonymous to kinship coefficient), ρij, was plotted against the natural logarithm of the distance between individuals, ln(rij), over distance classes set between individuals (r) (Loiselle et al., 1995; Hardy, 2003; Vekemans and Hardy, 2004). The coancestry coefficient is the probability of a random gene of individual i being identical by descent to a random gene of individual j. Theoretically, in a two dimensional space, ρij tends to decrease almost linearly with ln(rij) (Hardy, 2003; Vekemans and Hardy, 2004). The magnitude of the SGS can be quantified by the Sp statistic, which is a ratio between blog value and mean kinship coefficients among individuals of the lower distance class adopted for the coefficient calculation (Vekemans and Hardy, 2004). The development of the Sp statistic for SGS quantification, based on a decrease of kinship among individuals with increasing spatial distance (Vekemans and Hardy, 2004),allows the strength of SGS to be compared among different species and studies, in addition to investigating isolation by the distance process.
Fine-scale SGS for the set of five loci and 112 adult individuals was assessed using linear regression of pairwise Nason's co-ancestry coefficients [or kinship coefficient, ρij, described in Loiselle et al. (1995)] on pairwise spatial distances using the software SpaGeDi (Hardy and Vekemans, 2002). Although two of the seven loci were removed from the kinship estimates, five polymorphic loci, and a sample of 100 individuals, were considered sufficient to obtain close to real results (based on a model population) for SGS analysis (Cavers et al., 2005). Mean multilocus kinship coefficients (ρij) were computed for 15 distance classes (k = 15) spanning from 0 to 300 m, with each class 20 m wide. The numbers of pairs per distance class used in this analysis were higher or equal to 103, which are higher than the minimum number (30) recommended by Degen et al. (2001). The statistical significance of the autocorrelation was tested by 10,000 random permutations, with a 95% confidence interval. SGS was quantified using the Sp statistic defined by the ratio Sp =-bρ/(1 -ρ1), where ρ1 is the mean ρijbetween neighbouring individuals for the first distance class (0-20 m) and bρ is the linear regression slope of the mean kinship coefficients on the logarithm of spatial distance (0-300 m) (Vekemans and Hardy, 2004).
Wright's neighbourhood size was estimated as Nb= -(1-ρ1)/bρ, where ρ1 is the co-ancestry coefficient between adjacent individuals for the first distance class, and bρ is the restricted regression slope within a distance class between σ and 20σ (Vekemans and Hardy, 2004). Historical gene dispersal (σg) was obtained through the equation  = Nb/4πDe. These estimates are dependent on the effective density, De(Vekemans and Hardy, 2004; Hardy et al., 2006), which is not known for this population. However, according to Frankham (1995), previous studies have demonstrated that in natural plant populations, Devaries among one-half to one-tenth of the density of adults (D). Thus, the values D/10, D/4 and D/2 were assumed to be Defor the Campolina population. Both Nb and were estimated using SpaGeDi (Hardy and Vekemans, 2002). The 95% confidence intervals (CI) of bρ, ρ1, Nb, and σgestimates were calculated as estimate ± 1.96 s.e.. The standard errors (s.e.) were obtained by jackknifing over loci with SpaGeDi software (Hardy and Vekemans, 2002).
Results
Genetic diversity and bottleneck detection
In the analysed D. nigra population, the number of alleles per locus (A) ranged from two (Dnig7)to15(Dnig6), with a mean of 8.6 alleles per locus. The observed heterozygosities (HO = 0.390 to 0.734) were lower than the expected ones (HE = 0.498 to 0.835) for each locus, except for locus Dnig7 (HO = 0.528 and HE = 0.498). The overall loci HE values estimated for D. nigra from the three methodologies (i.e. considering all loci, with or without correction of null alleles with the Brookfield method and excluding loci with null alleles) were very similar, ranging from 0.707 to 0.747, showing that five loci were as informative as seven loci in the current study. The observed heterozygosities varied among these three methods, exhibiting lower values in the estimate when loci with null alleles were included (HO = 0.577) compared to when they were excluded (HO = 0.645). The inclusion of the loci with null alleles previously corrected with the Brookfield method produced the highest value of heterozygosity (HO = 0.687; Table 1).
Intrapopulation fixation indices (FIS) were positive and significant for four of the seven loci (with FIS values for the four loci ranging from 0.159 to 0.512). Part of this homozygosity excess was probably due to the presence of null alleles, since the exclusion of the Dnig1 and Dnig6 loci, which have high null allele frequencies, led to a decrease in mean FIS from 0.217 to 0.087 (Table 1). The correction of null alleles according to the Brookfield method (Brookfield, 1996) was effective, producing similar FIS (0.080). Our results reinforce the importance of using this correction for loci with null alleles or the exclusion of these loci for fixation indices estimates.
The results obtained with the software Bottleneck under the IAM mutation model showed that HE was significantly higher (p < 0.05) than HEq for three of the loci (Dnig2, Dnig7 and Dnig10) and for all loci combined (Table 2). Using the SMM model, only the Dnig7 locus showed significantly higher HE than HEq, but Dnig5 had the opposite results, i.e., lower HE than HEq. However, the Wilcoxon test did not find any significant difference between HE and HEq when considering all the loci combined (Table 2). Under the TPM mutation model, there were significant departures from the expected drift-mutation equilibrium in the Dnig7 locus for all tested percentages of SMM and in the Dnig10 locus for four percentages of SMM. However, considering all loci combined the Wilcoxon test found significant support for bottleneck in the population under TPM with 60, 70 and 80% of the single-step mutation. Under SMM and TPM with 90 and 95% of the SMM, the test was non-significant (Table 2).
Fine-scale spatial genetic structure and dispersal estimate
The Bayesian analysis performed with Structure software showed that the trees sampled were grouped in one cluster (k = 1), suggesting that the population harbours a single gene pool, and that the Wahlund effect is absent.
The average co-ancestry coefficient (ρ) decreased as the spatial distance between trees (r) increased, evidencing SGS in the study population (Figure 2). Co-ancestry coefficients were positive and significant (p < 0.05) for the distance classes 0-20 m, 20-40 m, 40-60 m and 60-80 m, with ρ values of 0.036, 0.022, 0.017 and 0.011, respectively. For the distance classes ranging from 80-100 m until 180-200 m, the co-ancestry coefficients decreased and the p-value became non-significant, being negative and significant for some distance classes higher than 200 m (Figure 2). The linear regression slope (bρ) of the mean kinship coefficients on the logarithm of spatial distance (0-300 m) was negative (-0.017) and significant (p < 0.001). Consistent with these data, fine-scale SGS evaluated by the Sp statistic value was 0.017 (Table 3).
Indirect estimates of historical gene dispersal distances (σg) obtained by SGS analysis were 89, 109 and 144 m, while neighbourhood size (Nb) values were 60, 46 and 32, assuming effective densities (De) equal to D/2, D/4 and D/10, respectively. Lower and upper bounds for the 95% CI of the first density considered (D/2) for Nb were 5 and 115, while for σg the 95% confidence limits were 55 and 123. When considering Deequal to D/4, the 95% confidence intervals were 22 and 70 for Nb and 82 and 136 for σg. When considering Deequal to D/10, the convergence of standard error was not achieved for both Nb and σg (Table 3).
Discussion
High genetic diversity was estimated for the population of D. nigra with expected heterozygosities ranging from HE = 0.71-0.75, depending on whether loci with null alleles were included or not in the analysis. Earlier studies also found high diversity in the Campolina population of D. nigra in comparison to small fragments when using allozymes (HE = 0.296; Ribeiro et al., 2005), sequences of chloroplast DNA (haplotypic diversity = 0.733; Ribeiro et al., 2011) and microsatellites markers (HE = 0.798; Resende et al., 2011). All of these studies had a sampling strategy that was only directed towards evaluating the genetic diversity of the population through the analysis of a smaller number of trees (< 23) and in a larger area compared to the present study. In contrast, the current study estimated genetic diversity by sampling all the adult trees (112) in a small plot (9.3 ha). The high diversity found in all these works, irrespective of the sampling strategies and molecular markers used, highlights the high diversity of D. nigra in this patch of primary forest in one of the few remaining large areas of inland Brazilian Atlantic Forest.
The fixation index of the population, when excluding loci with null alleles, was small (FIS = 0.087), but significantly different from zero (p < 0.05). The positive and significant FIS value might be explained by the Wahlund effect or the mating system. The Wahlund effect is unlikely, as the Bayesian structure analyses indicated the presence of only one genetic cluster in the analysed area. Therefore, the most probable hypothesis is that this fixation index is caused by mating among relatives and/or selfing. The fixation index found here was slightly different from that found by Resende et al. (2011), who recorded a smaller (FIS = 0.047) and non-significant fixation index in the Campolina population, when also using microsatellite markers. The difference in fixation index estimates between the two studies is probably due to different sampling strategies. These results evidence the influence of sampling on estimates of fixation indices of a population. However, taken together, these studies suggest that D. nigra has mostly an outcrossing breeding system, although detailed studies about the mating system of this species have yet to be performed.
The Wilcoxon test detected a signal of reduced effective size in the Campolina population for the IAM and TPM (60, 70, and 80% of single steps) mutation models only. According to Piry et al. (1999), the Wilcoxon test is the most powerful on for detecting bottlenecks when using fewer than 20 microsatellites, and the most appropriate mutation model is the TPM with 95% SMM and 5% IAM. Therefore, we consider unlikely the occurrence of a recent bottleneck in the Campolina population.
Kinship coefficients were estimated by excluding loci with high frequencies of null alleles. According to Wagner et al. (2006), null alleles can have a large impact on relatedness and relationship analyses. We encountered structuring in the Campolina population, which was evidenced by a decrease in the co-ancestry coefficients with increasing distance between individuals. The main cause of inbreeding in plants is the proximity of related reproductive individuals (Epperson, 2003). Co-ancestry analyses revealed structuring until a distance of 80 m between plants, indicating possible family clustering as a result of localised seed dispersal. This structuring distance is similar to that found in a population from a reserve of another Atlantic forest tree species, Ocotea catharinensi (Tarazi et al., 2010), which has insect pollination and seed dispersed by animals. Considering the SGS obtained for D. nigra, seed collection for reforestation programmes of this species should use trees separated by distances of over 80 m, to avoid relatedness among seeds from different trees. The co-ancestry coefficients (ρij) are 0.065 between first-degree cousins and 0.032 between second-degree ones (Crow and Kimura, 1970). Our results indicate that the co-ancestry value (0.036) in smaller distance classes is very close to the expected value for second-degree cousins.
The Sp value (Sp = 0.017) of D. nigra was similar that of two other tropical tree species, which exhibit insect pollination and wind seed dispersal, these being Jacaranda copaia (Sp = 0.014, Jones and Hubbell, 2006) and Aucoumea klaineana (mean Sp = 0.012, Born et al., 2008). In an isolated fragment of Atlantic Forest, Sebbenn et al. (2011), found a higher Sp value (0.026) for the tree Copaifera langsdorffii, which is also insect pollinated, but with seed dispersion by birds and mammals. In a review of tree SGS, Dick et al. (2008) found that seed dispersal had a major impact on tropical species. The authors found higher Sp values in plants with seeds dispersed by gravity, wind and scatter-hoarding rodents than by birds, bats or monkeys. Short-distance gene dispersal was found for D. nigra, with distances ranging from 89 to 144 m, depending on the effective density being considered (De = D/2, D/4 and D/10). These estimated gene dispersal distances are consistent with the mechanism of seed dispersion of the species (wind), the considerable Sp values and small estimates of neighbourhood sizes (Nb = 60, 46 and 32 for De = D/2, D/4 and D/10, respectively).
In summary, despite D. nigra being a threatened species, the studied population located in the large reserve has high genetic diversity and shows no strong evidence of a recent bottleneck. In addition, evidence of disturbance in the spatial genetic structure of this species was not found. Considering the high genetic diversity, this area could be an important source of seeds for ex-situ conservation programmes and/or reforestation projects. Furthermore, this area could be important for maintaining gene flow with surrounding fragments through a metapopulation structure (Resende et al., 2011). In conclusion, the results of this study highlight that long-term efforts to protect a large forested area has been effective towards maintaining the genetic diversity of D. nigra.
Acknowledgments
We thank the Instituto Estadual de Florestas (IEF) and Rio Doce State Park for providing the facilities and licenses for sample collection. We also thank LC Resende for field assistance and LHY Kamino, M Machado and WCS Magalhães for assistance in preparing the figures. This work was supported by Brazil's Long Term Ecological Research Programme/Conselho Nacional de Desenvolvimento Tecnológico (PELD/CNPq), Fundação de Amparo à Pesquisa de Minas Gerais (FAPEMIG) and Programa Nacional de Pós Doutorado/Coordenação de Aperfeiçoamento de Pessoal de Nível Superior (PNPD/ CAPES).
Internet Resources
Received: April 2, 2012
Accepted: August 2, 2012.
Associate Editor: Dario Grattapaglia
License information: This is an open-access article distributed under the terms of the Creative Commons Attribution License, which permits unrestricted use, distribution, and reproduction in any medium, provided the original work is properly cited.
- Berg EE and Hamrick JL (1994) Spatial and genetic structure of two sandhills oaks: Quercus laevis and Quercus margaretta (Fagaceae). Am J Bot 81:7-14.
- Bittencourt JVM and Sebbenn AM (2007) Patterns of pollen and seed dispersal in a small, fragmented population of the wind pollinated tree Araucaria angustifolia in southern Brazil.Heredity 99:580-591.
- Born C, Hardy OJ, Chevallier MH, Ossari S, Attéké C, Wickings EJ and Hossaert-McKey M (2008) Small-scale spatial genetic structure in the Central African rainforest tree species Aucoumea klaineana: A stepwise approach to infer the impact of limited gene dispersal, population history and habitat fragmentation. Mol Ecol 17:2041-2050.
- Bradshaw AD (1972) Some of the evolutionary consequences of being a plant. Evol Biol 5:24-47.
- Brookfield JFY (1996) A simple new method for estimating null allele frequency from heterozygote deficiency. Mol Ecol 5:453-455.
- Carvalho PER (1994) Espécies Florestais Brasileiras: Recomendações Silviculturais, Potencialidades e Uso da Madeira. EMBRAPA-CNPF/SPI, Brasília, 640 pp.
- Cavers S, Degen B, Caron H, Lemes MR, Margis R, Salgueiro F and Lowe AJ (2005) Optimal sampling strategy for estimation of spatial genetic structure in tree populations. Heredity 95:281-289.
- Chung MG, Chung GSOH and Epperson BK (2000) Spatial genetic structure in a Neolitsea sericea population (Lauraceae). Heredity 85:490-497.
- Chung MY, Nason JD, Epperson BK and Chung MG (2003) Temporal aspects of the fine-sacle genetic structure in a population of Cinnamomum insularimontanum (Lauraceae). Heredity 90:98-106.
- CITES (1992) CITES: Appendices I, II and III to the Convention on International Trade in Endangered Species of Wild Fauna and Flora. US Fish and Wildlife Service, Washington, 46 pp.
- Cornuet JM and Luikart G (1996) Description and power analysis of two tests for detection recent population bottlenecks from allele frequency data. Genetics 144:2001-2014.
- Costa CMR, Herrmann G, Martins CS, Lins LV and Lamas IR (1998) Biodiversidade em Minas Gerais: Um Atlas para sua Conservação. Fundação Biodiversitas, Belo Horizonte, 94 pp.
- Crow JF and Kimura M (1970) An Introduction to Population Genetic Theory. Harper & Row, New York, 591 pp.
- Dakin EE and Avise JC (2004) Microsatellite null alleles in parentage analysis. Heredity 93:504-509.
- Degen B, Petit RJ and Kreme A (2001) SGS -Spatial Genetic Software: A computer program for analysis of spatial genetic and phenotypic structures of individuals and populations. J Hered 92:447-448.
- Dewey SE and Heywood JS (1988) Spatial genetic structure in a population of Psychotria nervosaI. Distribution of genotypes. Evolution 42:834-838.
- Di Rienzo A, Peterson AC, Gazart JC, Valdes AM, Slatkin M and Freimer NB (1994) Mutational processes of simplesequence repeat loci in human populations. Genetics 91:3166-3170.
- Dick CW, Hardy OJ, Jones FA and Petit RJ (2008) Spatial scales of pollen and seed-mediated gene flow in tropical trees. Tropical Plant Biol 1:20-33.
- Doligez A and Joly HI (1997) Genetic diversity and spatial structure within a natural stand of a tropical forest tree species, Carapa procera (Meliaceae), in French Guiana. Heredity 79:72-82.
- Ennos RA and Clegg MT (1982) Effect of population substructuring on estimates of outcrossing rate in plant population. Heredity 48:283-292.
- Epperson BK (2003) Geographical Genetics. Princeton University Press, New York, 376 pp.
- Excoffier L, Laval LG and Schneider S (2005) ARLEQUIN ver. 3.0: An integrated software package for population genetics data analysis. Evol Bioinform Online 1:47-50.
- Falush D, Stephens M and Pritchard JK (2007) Inference of population structure using multilocus genotype data: Dominant markers and null alleles. Mol Ecol Note 7:574-578.
- Frankham R (1995) Effective population size/adult population size ratios in wildlife: A review. Genet Resour Camb 6:95-107.
- Hall P, Chase MR and Bawa KS (1994) Low genetic variation but high population differentiation in a common tropical forest tree species. Conserv Biol 8:471-482.
- Hamrick JL (2004) Response of forest trees to global environmental changes. For Ecol Manag 197:323-335.
- Hamrick JL and Nason JD (1996) Consequences of dispersal in plants. In: Rhodes Jr OE, Chesser RK and Smith MH (eds) Population Dynamics in Ecological Space and Time. University of Chicago Press, Chicago, pp 203-206.
- Hamrick JL and Sherman-Broyles SL (1992) Factors influencing levels of genetic diversity in woody plant species. N For 6:95-124.
- Hardy OJ (2003) Estimation of pairwise relatedness between individuals and characterization of isolation-by-distance processes using dominant genetic markers. Mol Ecol 12:1577-1588.
- Hardy OJ and Vekemans X (2002) SpaGeDi: A versatile computer program to analyze spatial genetic structure at the individual or population levels. Mol Ecol Notes 2:618-620.
- Hardy OJ, Maggia L, Bandou E, Breyne P, Caron H, Chevallier MH, Dligez A, Dutech C, Kremer A, Latouche-Hallé C, et al. (2006) Fine-scale genetic structure and gene dispersal inferences in 10 Neotropical tree species. Mol Ecol 15:559-571
- Jones FA and Hubbell P (2006) Demographic spatial genetic structure of the Neotropical tree, Jacaranda copaia Mol Ecol 15:3205-3217.
- Juchum FS, Leal JB, Santos LM, Almeida MP, Ahnert D and Corrêa RX (2007) Evaluation of genetic diversity in a natural rosewood population (Dalbergia nigra Vell. Allemao ex Benth) using RAPD markers. Genet Mol Res 6:543-553.
- Kimura M and Crow JF (1964) The number of alleles that can be maintained in a finite population. Genetics 49:725-738.
- Levin DA and Kerster HW (1974) Gene flow in seed plants. Evol Biol 7:139-220.
- Loiselle BA, Sork VL, Nason J and Graham C (1995) Spatial genetic structure of a tropical understory shrub, Psychotria officinalis (Rubiaceae). Am J Bot 82:1420-1425.
- Lopez-Gallego C and O'Neil P (2010) Life-story variation following habitat degradation associated with differing finescale spatial genetic structure in a rainforest cycad. Pop Ecol 52:191-201.
- Marshall TC, Slate J, Kruuk LEB and Pemberton JM (1998) Statistical confidence for likelihood-based paternity inference in natural populations. Mol Ecol 7:639-655.
- Morellato LP and Haddad CFB (2000) Introduction: The Brazilian Atlantic Forest. Biotropica 32:786-792.
- Murawski DA and Hamrick JL (1992) The mating system of Cavanillesia platanifolia under extremes of flowering tree density: A test of predictions. Biotropica 24:99-101.
- Myers N (1988) Threatened biotas: "hot spots" in tropical forests. Environment 8:187-208.
- Myers N, Mittermeier RA, Mittermeier CG, Fonseca GAB and Kent J (2000) Biodiversity hotspots for conservation priorities. Nature 403:853-858.
- Novaes RML, Rodrigues JG and Lovato MB (2009) An efficient protocol for tissue sampling and DNA isolation from the stem bark of Leguminosae trees. Genet Mol Res 8:89-96.
- Ohta T and Kimura M (1973) A model of mutation appropriate to estimate the number of electrophoretically detectable alleles in a finite population. Genet Res Camb 22:201-204.
- Pacheco LF and Simonetti JA (2000) Genetic structure of a mimosoid tree deprived of its seed disperser, the spider monkey. Conserv Biol 14:1766-1775.
- Piry S, Luikart G and Cournuet JM (1999) Bottleneck: A computer program for detecting recent reductions in the effective population size using allele frequency data. J Hered 90:502-503.
- Pither R, Shore JS and Kellman M (2003) Genetic diversity of the tropical tree Terminalia Amazonia (Combretaceae) in naturally fragmented populations. Heredity 91:307-313.
- Randall DA, Pollinger JP, Argaw K, Macdonald DW and Wayne RK (2010) Fine-scale genetic structure in Ethiopian wolves imposed by sociality, migration, and population bottlenecks. Conserv Genet 11:89-101.
- Resende LC, Ribeiro RA and Lovato MB (2011) Diversity and genetic connectivity among populations of a threatened tree (Dalbergia nigra) in a recently fragmented landscape of the Brazilian Atlantic Forest. Genetica 139:1159-1168.
- Ribeiro RA, Ramos ACS, Lemos-Filho JP and Lovato MB (2005) Genetic variation in remnant populations of Dalbergia nigra (Papilionoideae), an endangered tree species from the Brazilian Atlantic Forest. Ann Bot 95:1171-1177.
- Ribeiro MC, Metzger JP, Martensen AC, Ponzoni FJ and Hirota MM (2009a) The Brazilian Atlantic Forest: How much is left, and how is the remaining forest distributed?: Implications for conservation. Biol Conserv 142:1144-1156.
- Ribeiro RA, Rezende MFS, Resende LC, Lemos-Filho JP, Kalapothakis E and Lovato MB (2009b) Development of polymorphic microsatellite markers for Dalbergia nigra (Papilionoideae), an endagered tree from the Brasilian Atlantic Forest. Mol Ecol Res 9:203-206.
- Ribeiro RA, Lemos-Filho JP, Ramos ACS and Lovato MB (2011) Phylogeography of the endangered rosewood Dalbergia nigra (Fabaceae): insights into the evolutionary history and conservation of the Brazilian Atlantic Forest. Heredity 106:46-57.
- Schuelke M (2000) An economic method for the fluorescent labeling of PCR fragments. Nat Biotechnol 18:233-234.
- Sebbenn AM, Degen B, Azevedo VCR, Silva MB, Lacerda AEB de, Ciampi AY, Kanashiro M, Carneiro FS, Thompson I and Loveless MD (2008) Modelling the long-term impacts of selective logging on genetic diversity and demographic structure of four tropical tree species in the Amazon forest. For Ecol Manag 254:335-349.
- Sebbenn AM, Carvalho ACM, Freitas MLM, Moraes SMB, Gaino APSC, da Silva JM, Jolivet C and Moraes MLT (2011) Low levels of realized seed and pollen gene flow and strong spatial genetic structure in a small, isolated and fragmented population of the tropical tree Copaifera langsdorffii Desf. Heredity 106:134-145.
- Sokal RR and Wartenberg D (1983) A test of spatial autocorrelation analysis using an isolation-by-distance model. Genetics 105:219-237.
- Solá MEC (2001) Análise de Remanescentes de Mata Atlântica em Função da Declividade do Terreno na Região do PERD. Monograph, Universidade Federal de Minas Gerais, 28 pp.
- Stehmann JR, Forzza RC, Salino A, Sobral M, da Costa DP and Kamino LHY (2009) Plantas da Floresta Atlântica. Jardim Botânico do Rio de Janeiro, Rio de Janeiro, 516 pp.
- Tarazi R, Montovani A and Reis MS (2010) Fine-scale spatial genetic structure and allozymic diversity in natural populations of Ocotea catharinensis Mez. (Lauraceae). Conserv Genet 11:965-976.
- van Oosterhout C, Hutchison WF, Wills DPM and Shipley P (2004) MICRO-CHECKER: Software for identifying and correcting genotyping errors in microsatellite data. Mol Ecol Notes 4:535-538.
- Vekemans X and Hardy OJ (2004) New insights from fine scale spatial genetic structure analyses in plant populations. Mol Ecol 13:921-925.
- Wang BC, Sork VL, Leong MT and Smith TB (2007) Hunting of mammals reduces seed removal and dispersal of the afrotropical tree Antrocaryon klaineanum (Anacardiaceae). Biotropica 39:340-347.
- Wagner AP, Creel S and Kalinowski ST (2006) Estimating relatedness and relationship using microsatellite loci with null alleles. Heredity 97:336-345.
- Williams OG and Hamrick JL (1996) Elite populations for conifer breeding and gene conservation. Can J For Res 26:453-461.
- With GM, Boshier H and Powell W (1999) Genetic variation within a fragmented population of Switenia humilis Zucc. Mol Ecol 8:1899-1909.
- Young AG and Boyle TJ (2000) Forest fragmentation. In: Young AG, Boshier D and Boyle TJ (eds) Forest Conservation Genetics: Principles and Practice. CSIRO Publishing, Melbourne, pp 123-134.
- Ferreira Jr O (2001) GPS trackmaker for Windows ve. 11.7. http://www.gpstm.com.br (April 26, 2010).
- IEF -Instituto Estadual de Florestas (2002) Encarte 1: Informações gerais da Unidade de Conservação. In: Plano de Manejo do Parque Estadual do Rio Doce. http://www.ief.mg.gov.br/component/content/306?task=view (December 15, 2011).
- IUCN (2010) The IUCN red list of threatened species, ver. 2010.4. http://www.iucnredlist.org (August 26, 2011).
Correspondence:
Publication Dates
-
Publication in this collection
16 Oct 2012 -
Date of issue
2012
History
-
Received
02 Apr 2012 -
Accepted
02 Aug 2012