Complete mitochondrial genomes of three Cichla species: Annotation, diversity, and phylogenetic insights
Abstract
The Cichlidae family, especially the South American genus Cichla, is notable for its rapid diversification and ecological impacts following introductions outside its native range. In this study, we first describe the mitogenomes of three Cichla species. The mitogenome of Cichla piquiti was sequenced from a sample collected at Serra da Mesa Lake, located in the state of Goiás, Brazil. Additionally, the mitogenomes of Cichla monoculus and Cichla temensis were assembled using public data. The mitogenomes were assembled using NovoPlasty, and comparative analyses were performed, including those of the Cichla ocellaris mitogenome data. The mitogenomes ranged from 16,526 bp (C. monoculus) to 16,536 bp (C. piquiti), exhibiting a conserved genomic structure with 13 protein-coding genes, 22 tRNAs, and two rRNAs. These mitogenomes were validated by reconstructing phylogenetic relationships within the Cichlinae subfamily. We identified nucleotide composition biases and observed high nucleotide diversity in the D-loop region. Phylogenetic analysis based on complete mitogenome data indicated that Cichla species form a clade with C. ocellaris, a sister clade to Retroculini. This study provides new mitogenomic insights into Cichla, offering valuable genomic resources for species identification and ecological monitoring.
Keywords:
Cichlidae; mitogenome; phylogeny; tucunarés
The Cichlidae family, particularly the Cichlinae subfamily, is known for its rapid diversification and speciation, which make it a valuable group for evolutionary studies (López-Fernández et al., 2010). The genus Cichla, commonly referred to as tucunarés, is endemic to South America and occurs in the Amazon, Tocantins, and Orinoco River basins, as well as in smaller rivers of the Guianas (Kullander and Efrem, 2006). These species hold high economic value in aquaculture and sport fishing (Kullander and Efrem, 2006). However, the introduction of Cichla species into non-native watersheds, driven by commercial interests, has raised significant ecological concerns (Pelicice and Agostinho, 2009). Molecular tools based on mitochondrial genome data (mtDNA) have been utilized to identify and address the ecological impacts of such introductions (Wang et al., 2021). This study aims to sequence and analyze the mtDNA of three Cichla species (C. piquiti, C. monoculus, and C. temensis), compare their genomes, assess phylogenetic relationships within the genus and the Cichlinae subfamily, and identify mtDNA regions with potential for the development of DNA barcode markers.
For this purpose, we sequenced one individual of C. piquiti collected at Serra da Mesa Lake, located in the state of Goiás, Brazil, with geographical coordinates of longitude -48° 18’ 53.58” and latitude -13° 57’ 23.13”. The DNA was extracted from the muscle tissue using the animal extraction protocol described by Castro et al. (2020). The DNA concentration obtained was 47 ng/µL, as measured with a Qubit High Sensitivity DNA Kit. DNA purity was assessed using Nanodrop. Illumina’s Nextera DNA Flex protocol was used to prepare the genomic libraries, which were indexed using Nextera DNA CD Indexes (Illumina). The fragmentation of the genomic libraries was checked using the Bioanalyzer High Sensitivity DNA kit. Quantification of the libraries was carried out using both Qubit and qPCR, using Qubit High Sensitivity DNA Kit and KAPA SYBR® FAST qPCR Mix, respectively. Sequencing was carried out using the MiSeq® Reagent Kit v3 (600 cycles). For C. temensis and C. monoculus, we used sequencing data already available in the NCBI SRA database, corresponding to the Brazilian cichlid whole genome sequencing project (PRJEB48774). The accession numbers are ERR10768311 for C. temensis and ERR10789871 for C. monoculus. The C. ocellaris data (complete mitochondrial genome) used for the comparative analyses was obtained from the NCBI Genome database under access number NC_030272.1.
The quality analysis of the sequences generated for C. piquiti, as well as the SRA data obtained from NCBI for C. temensis and C. monoculus, was carried out using the FastQC software. Trimmomatic v0.32 was then used to remove the Illumina adapters and perform quality control with the parameters “SLIDINGWINDOW:4:15” and “MINLEN:100” in paired-end mode. We assembled all the available libraries for C. monoculus (n= 10) and C. temensis (n= 9) (Table S1). To assemble the mtDNA, we used a seed sequence of the COI gene specific to each species (C. piquiti: JN988800.1, C. monoculus: JN988799.1, C. temensis: FJ440622.1), all using NovoPlasty v. 4.3.1. After assembling the mtDNA, the genomes were annotated. To do this, the assembled genomes were aligned to the C. ocellaris reference sequence (NC_030272.1) and annotated using MITOS2 Galaxy WebServer. After annotation, all the genomes were aligned in MAFFT v. 7.
In the comparative analyses for the genus Cichla, we used three mtDNA assembled in this study and the complete mtDNA of C. ocellaris. We analyzed the bias in nucleotide composition for this genus using the AT-skew and GC-skew metrics (Perna and Kocher, 1995). We also analyzed the Relative Synonymous Codon Usage (RSCU) in MEGA11 v. 11. We then calculated the nucleotide diversity (π) for the genus Cichla (interspecific analysis) and for all the assembled mitochondrial genomes of C. monoculus and C. temensis (intraspecific analysis) in DnaSP v. 6.12.0, with the aim of identifying hotspot regions that could be used to develop barcode primers.
Comparative and evolutionary analyses were carried out for the subfamily Cichlinae (Neotropical cichlids). We used data from 34 complete and annotated mtDNA obtained from the NCBI Genome database (Table S2). We carried out analyses of genomic similarity, collinearity, rearrangements, and inversions of mtDNA regions using Mauve alignment. In addition, we identified the synonymous (Ks) and non-synonymous (Ka) substitutions and calculated the Ka/Ks ratio in DnaSP v. 6.12.0, using data from all the protein-coding genes identified.
Finally, we reconstructed the phylogeny of the Cichlinae subfamily using data from the 13 protein-coding genes, using a maximum likelihood tree with IQ-TREE v. 2.2.0. To identify the most suitable nucleotide model (GTR+F+R4), we used ModelFinder Plus (Kalyaanamoorthy et al., 2017) and applied 1.000 bootstrap replicates. As an outgroup, we used the species Oreochromis niloticus, a widely known African cichlid species belonging to another subfamily (Pseudocrenilabrinae). To visualize and plot the resulting phylogenetic tree, we used FigTree v. 1.4.4.
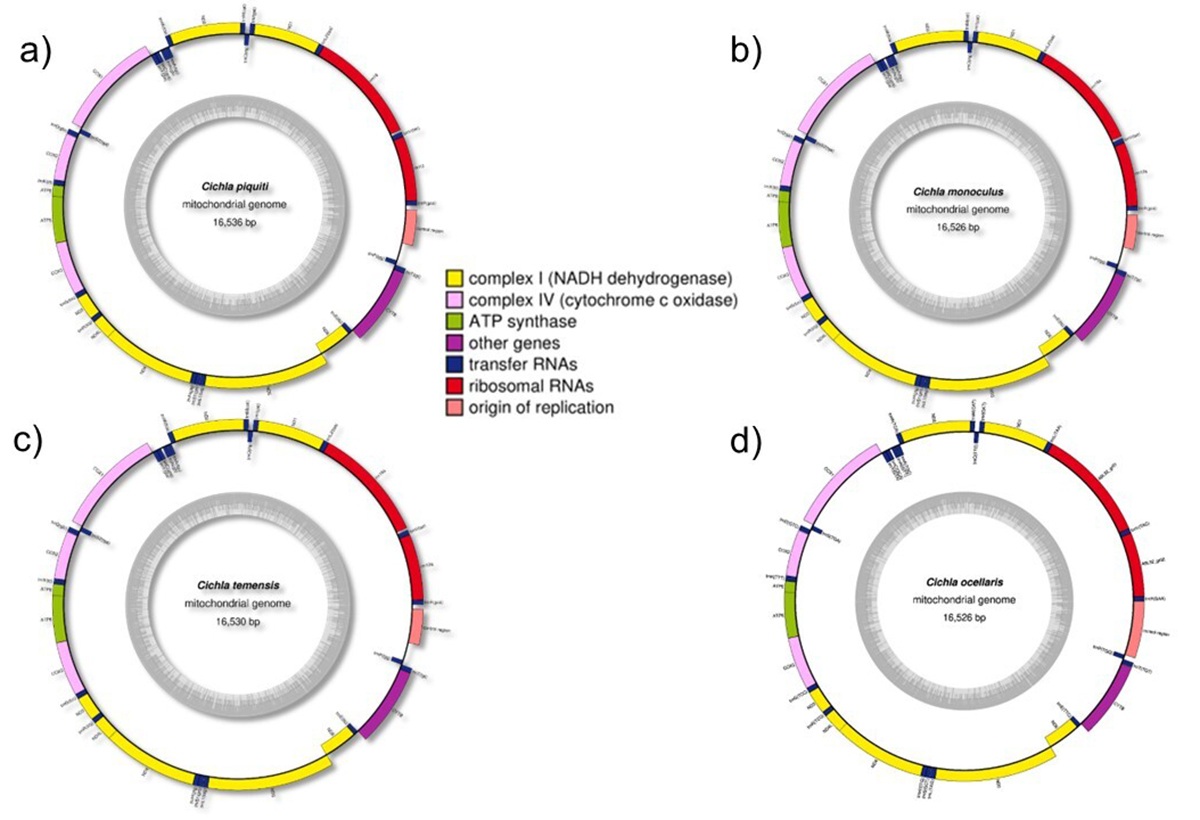
The mtDNA assemblies (circular genomes) of the three species of the genus Cichla, based on the COX1 gene data of each species, were all successfully carried out with average coverage of over 100x. Regarding the size of the mtDNA species of the genus Cichla assembled in this study, the genomes ranged from 16,526 bp (C. monoculus) to 16,536 bp (C. piquiti), with an average of 16,529.3 bp, standard deviation (SD) of 4.73 (Figure 1). The mtDNA structure of Cichla showed conservation and maintenance of the number of genes, including 13 protein-coding genes, 22 tRNAs, and two rRNAs, as expected for the mitochondrial genome of fish and previously described for C. ocellaris (Lin et al., 2017).
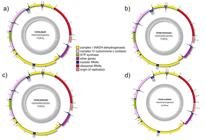
Circular representation of the mtDNA of a) C. piquiti; b) C. monoculus; c) C. temensis and d) C. ocellaris. The genes are classified by functional groups, each marked with a distinct color. Inside the larger circle, the genes are transcribed clockwise, while outside this circle, transcription occurs anti-clockwise.
When comparing the complete mtDNA of the genus Cichla, the GC content showed an average value of 44.98% (SD = 0.16) (Table S3). Next, the nucleotide composition bias values for the complete genome sequence and rRNA showed negative GC-skew values and a positive AT-skew value (Table S3). In this way, we observe a higher presence of C compared to G, and of A compared to T, following the logic of the calculations used for GC-skew ((G - C)/(G+C)) and AT-skew ((A - T)/(A+T)) (Perna and Kocher, 1995). On the other hand, nucleotide composition varies when analyzing the protein-coding genes (PCGs) and tRNAs. For the PCG, both the GC-skew and AT-skew values were negative, while for the tRNAs, both values were positive (Table S3). Other studies on Teleostei have corroborated these characteristics for the PCG and tRNAs (Wang et al., 2023). To explore regional variations along the complete mitochondrial genome, a sliding window analysis was performed (window size: 1,000 bp; step: 500 bp), which revealed an increasing negative asymmetry in GC-skew (ranging from -0.125 to -0.589) along the length of the genome in the four species analyzed, reflecting a predominance of C over G, especially in regions closer to the mtDNA regulatory area (S1). In contrast, AT-skew values oscillated between positive and negative, ranging from 0.333 to -0.0097 in the Cichla genus, showing more variable regional patterns (S1). The GC-skew averages obtained by this approach were between -0.317 and -0.352, more negative than the values observed for the whole genome, while the AT-skew averages were between 0.067 and 0.080, close to the global average (S1). This suggests that the sliding window analysis captures local fluctuations that are not visible in the genomic average, reinforcing the differences in composition observed between the functional regions of the mtDNA.
The analysis of the PCGs in C. piquiti (11,428 bp), C. monoculus (11,433 bp) and C. temensis (11,437 bp) revealed that 12 of the 13 PCGs are located in the heavy chain (H), with ND6 being the only gene in the light chain (L), which is defined as the chain with the highest amount of G + T, characterizing it as the heavy chain, as observed in C. ocellaris (Lin et al., 2017). All species had 12 PCGs starting with the canonical ATG codon, except COX1, which used the GTG codon, a typical feature of fish mitogenomes (Satoh et al., 2016). As for the stop codons, C. temensis and C. piquiti showed the same pattern observed in C. ocellaris, with seven genes ending in complete stop codons (TAA or TAG) and six with incomplete stop codons, while C. monoculus had eight genes with complete stop codons and five with incomplete codons (Table S4).
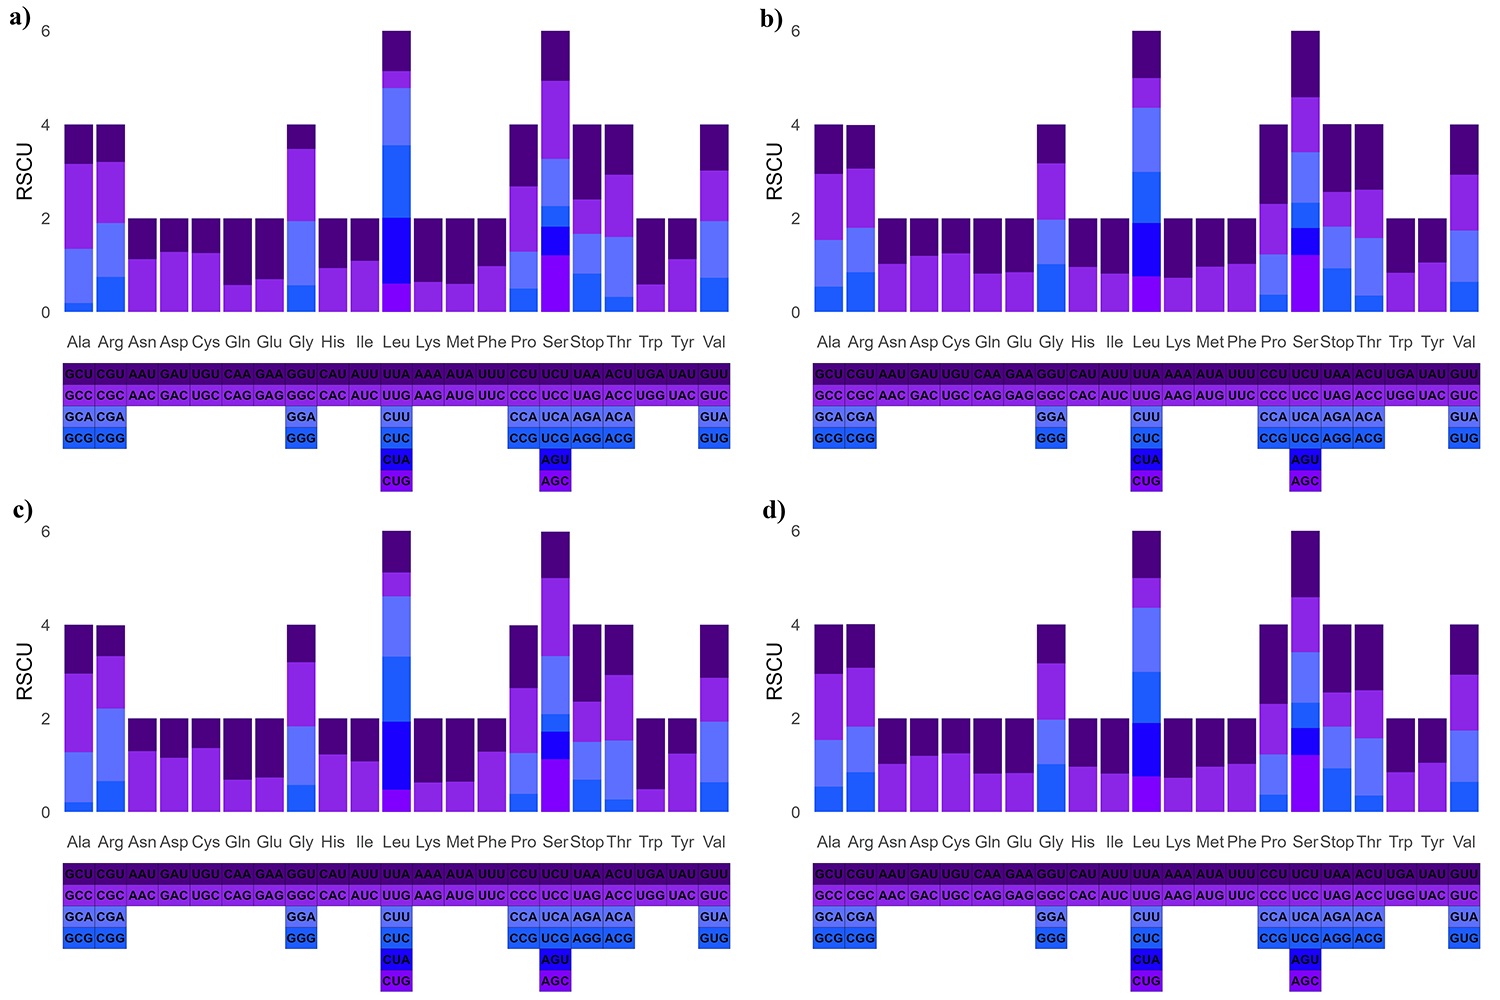
In the four Cichla species analyzed, codons ranged from 5,508 (C. ocellaris and C. monoculus) to 5,512 (C. piquiti), with similar codon usage patterns across species (Figure 2). The most abundant codons varied: CUC (leucine) in C. piquiti, CCU (proline) in C. monoculus and C. ocellaris, and CCC (proline) in C. temensis, as noted in other cichlids (Fiteha et al., 2022). Leucine and serine were the most abundant amino acids in all species, contrasting with African cichlids, where leucine and alanine were predominant (Fiteha et al., 2022).
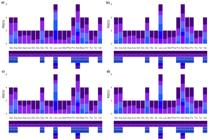
Relative synonymous codon usage (RSCU) analysis for all four species of the genus Cichla with complete mitochondrial genomes currently available. a) C. piquiti; b) C. monoculus, c) C. temensis e d) C. ocellaris.
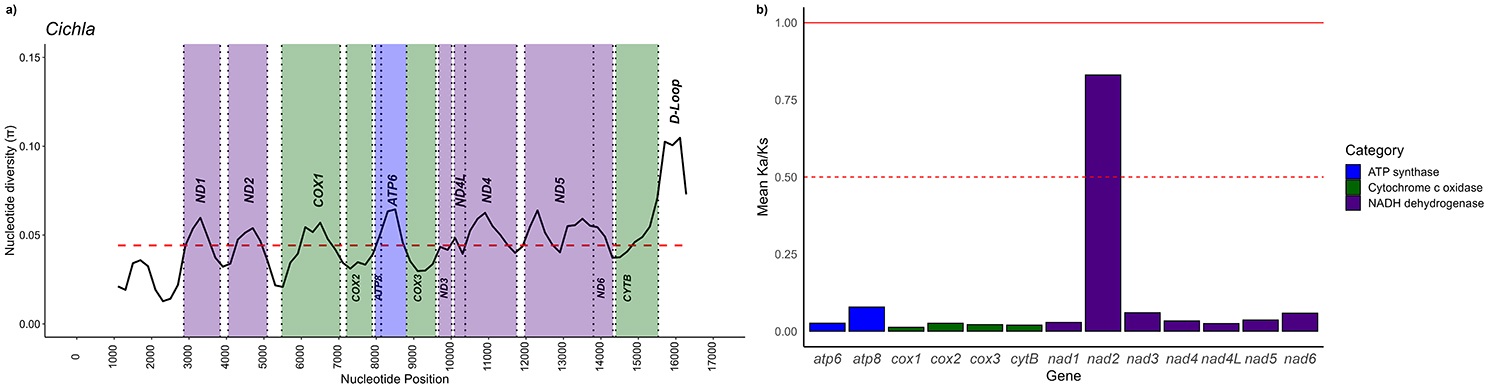
Nucleotide diversity in Cichla species ranged from 0.012 to 0.104, with the highest values in the D-loop region (Figure 3 A ). NADH dehydrogenase genes (ND1, ND2, ND4L, ND4, and ND5) frequently showed values above the median. Intraspecific diversity was lower than interspecific diversity. For C. monoculus, diversity ranged from 0 to 0.008, peaking in the D-loop, with genes above the median including COX1, COX3, ND1, ND2, ND3, ND4, ND5, and ND6 (Figure S1). For C. temensis, diversity ranged from 0 to 0.0025, peaking in COX1, with COX2, COX3, CytB, ATP8, ATP6, ND1, ND2, ND3, ND4, ND4L, ND5, and ND6 above the median (Figure S2). Regions with high nucleotide diversity are potential targets for designing DNA barcode primers for genus identification and species-specific detection (Wang et al., 2021). The highly variable D-loop region, rich in AT content and microsatellite repeats (Satoh et al., 2016), is particularly useful for population studies and warrants further investigation at individual and species-specific levels. This study may support genomic resources for primer design, addressing the limited availability of nuclear microsatellite markers for C. piquiti (Faquim et al., 2022).
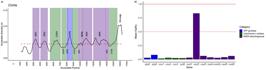
a) Nucleotide diversity (π) calculated for the four species of Cichla with mitochondrial genomes assembled in this work and with data available in the NCBI Genome database. The red dashed line represents the median nucleotide diversity, and the peaks above it represent the nucleotide diversity hotspots for the genus. b) Ka/Ks ratios for each of the 13 protein-coding genes estimated for all species in the Cichlinae subfamily. The continuous red line represents the neutral selection value, dashed line represents half of the neutral selection value.
Comparative analyses of the Cichlinae subfamily revealed no genomic rearrangements among 34 species, with the Mauve alignment indicating a single similarity block and high genomic collinearity (Figure S3), consistent with the conserved mtDNA structure in bony fish (Lü et al., 2019). Protein-coding genes showed non-synonymous substitution rates (Ka) ranging from 0 to 0.4045 (mean: 0.0637) and synonymous rates (Ks) from 0 to 1.9992 (mean: 1.199). The highest Ka values were in NAD2 (0.249) and ND6 (0.0770), while the highest Ks values were in NAD5 (1.48) and NAD1 (1.45), all linked to NADH dehydrogenase subunits. The Ka/Ks ratio was calculated to detect selection in the 13 protein-coding genes, all showing values below 1, indicating predominant negative selection (Hurst, 2002). The highest ratio was in NAD2 (0.831), while COX1 had the lowest (0.0131). This variation reflects differences in selective pressures across genes (Islam and Sultana, 2022).
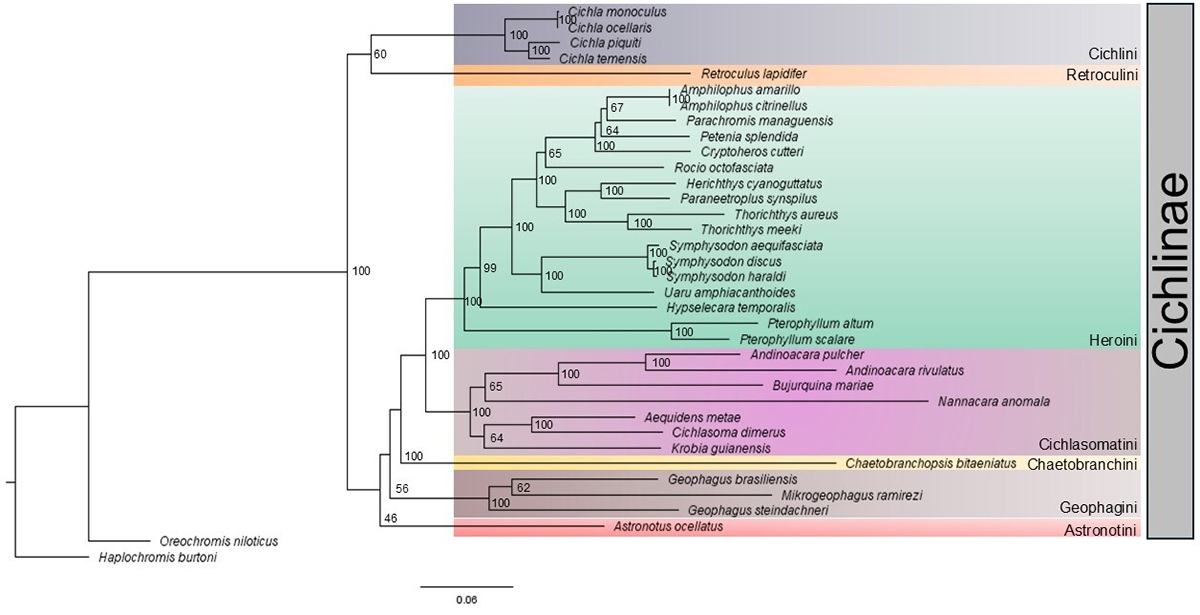
In this study, we present one of the few phylogenetic trees available for the subfamily Cichlinae, based on complete mitochondrial genome data, which includes information from three newly assembled and annotated mitochondrial genomes (Figure 4). The phylogeny, constructed using the maximum likelihood method, supports the monophyletic structure of the subfamily Cichlinae and exhibits a topology consistent with trees derived from morphological data combined with genetic data (Smith et al., 2008; Ilves et al., 2018), as well as those based on mtDNA data (Lao et al., 2023). The target species in this study (C. piquiti, C. monoculus, C. temensis and C. ocellaris) were grouped with high support (bootstrap of 100); however, C. monoculus and C. ocellaris had short branch lengths. In fact, C. monoculus and C. ocellaris have high morphological and genetic similarity and can be considered evolutionarily significant units within the C. ocellaris species (Willis et al., 2012).
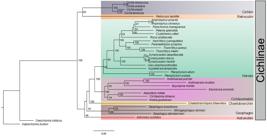
The phylogenetic relationships of the subfamily Cichlinae based on the complete mitochondrial genome. Bootstrap support values with 1,000 replicates are shown at the nodes. Oreochromis niloticus was used as the outgroup.
Our phylogeny also indicated that the tribes Cichlini and Retroculini formed a sister group, separating them from the other tribes within the subfamily Cichlinae. Additionally, the tribes Heroini and Cichlasomatini formed a monophyletic group, corroborating the phylogeny based on morphological and genomic data (Smith et al. ,2008; Ilves et al., 2018; Lao et al., 2023). Our results indicated that Astronotini is sister to almost all Cichlinae tribes (except Cichlini and Retroculini), which was also reported by Smith et al. (2008). Some node supports are still not well resolved in our phylogeny (<70), suggesting that more genetic resources associated with morphological data are needed to make the phylogeny more robust.
Finally, this study presents three new mitogenomes from the three species (C. piquiti, C. monoculus and C. temensis), which exhibited a structure similar to the mtDNA previously described for C. ocellaris and comparable to that of other species in the Cichlinae subfamily. As expected for fish, the mtDNA showed a well-conserved structure, especially regarding gene order and signs of negative selection. The new mtDNA data described here, together with the information on nucleotide diversity, may contribute to future studies, including the development of barcode primers for the rapid identification of these species.
Supplementary material
The following online material is available for this article:
Table S1 -
Table S2 -
Table S3 -
Table S4 -
Figure S1 -
Figure S2 -
Figure S3 -
Acknowledgements
We acknowledge LGBio and the Graduate Program in Ecology and Evolution (PPG EcoEvol) for providing structural and logistical support. We also acknowledge the Coordenação de Aperfeiçoamento de Pessoal de Nível Superior - Brasil (CAPES) for the scholarship awarded to DOS (Funding Code 001). This work is a contribution of the National Institute of Science and Technology (INCT) in Ecology, Evolution, and Biodiversity Conservation, funded by CNPq (grant 465610/2014-5) and FAPEG (grant 201810267000023). This study was financed in part by the Coordenação de Aperfeiçoamento de Pessoal de Nível Superior - Brasil (CAPES) - Finance Code 001. MPCT has been continuously supported by productivity grants from CNPq. LCJC received a doctoral scholarship from FAPEG. This project is linked to the agreement between Araguaia Vivo - Tropical Alliance Water Research (TWRA) and FAPEG (proc. 202210267000536) and the PPBio Araguaia project supported by CNPq (proc. 441114/2023-7).
References
- Castro AA, Targueta CP, Guerra V, Gambale PG and Telles MPC (2020) Isolation and development of microsatellite markers for the Brazilian Cerrado endemic tree frog Ololygon centralis (Anura: Hylidae). Genet Mol Res 19:gmr18528.
- Faquim RCP, Braga-Ferreira RS, Castro TG, Silva LCF and Telles MPC (2022) Genetic diversity in Cichla piquiti and cross-amplification for Cichla kelberi in the Serra da Mesa reservoir, Goiás, Brazil. Acta Sci Biol Sci 44:e58294.
- Fiteha YG, Rashed MA, Ali RA, Abd El-Moneim D, Alshanbari FA and Magdy M (2022) Mitogenomic features and evolution of the Nile river dominant tilapiine species (Perciformes: Cichlidae). Biology 12:40.
- Hurst LD (2002) The Ka/Ks ratio: Diagnosing the form of sequence evolution. Trends Genet 18:486-487.
- Ilves KL, Torti D and López-Fernández H (2018) Exon-based phylogenomics strengthens the phylogeny of Neotropical cichlids and identifies remaining conflicting clades (Cichliformes: Cichlidae: Cichlinae). Mol Phylogenet Evol 118:232-243.
- Islam M and Sultana S (2022) Codon usage bias and purifying selection identified in Cirrhinus reba mitogenome. J Adv Biotechnol Exp Ther 5:605.
- Kalyaanamoorthy S, Minh BQ, Wong TKF, Von Haeseler A and Jermiin LS (2017) ModelFinder: Fast model selection for accurate phylogenetic estimates. Nat Methods 14:587-589.
- Kullander SO and Efrem JGF (2006) A review of the South American cichlid genus Cichla, with descriptions of nine new species (Teleostei: Cichlidae). Ichthyol Explor Freshwaters 17:289-398.
- Lao Y-L, Jin-Long H, Cheng-He S, Xiao-Ying H, Ting W and Qun Z (2023) Characterization of the complete mitogenome of Mikrogeophagus altispinosus (Cichliformes: Cichlidae) and phylogenetic analysis of new world cichlids. Pak J Zool 56:2893-2900
- Lin M, Mu X and Yan X (2017) The complete mitochondrial genome of Cichla ocellaris Mitochondrial DNA B Resour 2:620-622.
- López-Fernández H, Winemiller KO and Honeycutt RL (2010) Multilocus phylogeny and rapid radiations in Neotropical cichlid fishes (Perciformes: Cichlidae: Cichlinae). Mol Phylogenet Evol 55:1070-1086.
- Lü Z, Zhu K, Jiang H, Lu X, Liu B, Ye Y, Jiang L, Liu L and Gong L (2019) Complete mitochondrial genome of Ophichthus brevicaudatus reveals novel gene order and phylogenetic relationships of Anguilliformes. Int J Biol Macromol 135:609-618.
- Pelicice FM and Agostinho AA (2009) Fish fauna destruction after the introduction of a non-native predator (Cichla kelberi) in a Neotropical reservoir. Biol Invasions 11:1789-1801.
- Perna NT and Kocher TD (1995) Patterns of nucleotide composition at fourfold degenerate sites of animal mitochondrial genomes. J Mol Evol 41:353-358.
- Satoh TP, Miya M, Mabuchi K and Nishida M (2016) Structure and variation of the mitochondrial genome of fishes. BMC Genomics 17:719.
- Smith WL, Chakrabarty P and Sparks JS (2008) Phylogeny, taxonomy, and evolution of Neotropical cichlids (Teleostei: Cichlidae: Cichlinae). Cladistics 24:625-641.
- Wang J, Xu W, Liu Y, Bai Y and Liu H (2023) Comparative mitochondrial genomics and phylogenetics for species of the snakehead genus Channa Scopoli, 1777 (Perciformes: Channidae). Gene 857:147186.
- Wang S, Yan Z, Hänfling B, Zheng X, Wang P, Fan J and Li J (2021) Methodology of fish eDNA and its applications in ecology and environment. Sci Total Environ 755:142622.
- Willis SC, Macrander J, Farias IP and Ortí G (2012) Simultaneous delimitation of species and quantification of interspecific hybridization in Amazonian peacock cichlids (genus Cichla) using multi-locus data. BMC Evol Biol 12:1471-2148.
Data used in this study are publicly available in the NCBI databases: Cichla temensis (SRA: ERR10768311) and Cichla monoculus (SRA: ERR10789871) from project PRJEB48774, Cichla ocellaris mitochondrial genome (NC_030272.1), and Cichla piquiti mitochondrial genome (NC_084242.1).