Abstract
Sea turtles are marine reptiles that undertake long migrations through their life, with limited information regarding juvenile stages. Feeding grounds (FGs), where they spend most of their lives, are composed by individuals from different natal origins, known as mixed stock populations. The aim of this study was to assess genetic composition, natal origins and demographic history of juvenile green turtles (Chelonia mydas) at the Paranaguá Estuarine Complex (PEC), Brazil, considered a Natural World Heritage site. Tissue samples of stranded animals were collected (n = 60), and 700 bp mitochondrial DNA sequences were generated and compared to shorter sequences from previously published studies. Global exact tests of differentiation revealed significant differences among PEC and the other FGs, except those at the South Atlantic Ocean. Green turtles at PEC present genetic signatures similar to those of nesting females from Ascension Island, Guinea Bissau and Aves Island/Surinam. Population expansion was evidenced to have occurred 20–25 kYA, reinforcing the hypothesis of recovery from Southern Atlantic refugia after the last Glacial Maximum. These results contribute to a better understanding of the dynamics of green turtle populations at a protected area by providing knowledge on the dispersion patterns and reinforcing the importance of the interconnectivity between nesting and foraging populations.
Chelonia mydas; mtDNA; feeding grounds; mixed stock analysis; connectivity
Sea turtles are reptiles that exhibit complex life traits, such as long generation and wide-ranging migrations, inhabiting both different tropical and subtropical regions (Bolten, 2003Bolten AB (2003) Variation in sea turtle life history patterns: Neritic vs. oceanic developmental stages. In: Lutz PL, Musick JA and Wyneken J (eds) The Biology of Sea Turtles, vol. II. CRC Press, Boca Raton, pp 243–257.). As soon as they reach sexual maturity, adults make migrations to their natal beaches for reproduction, termed natal homing (Carr, 1967Carr AF (1967) So Excellent a Fish: A Natural History of Sea Turtles. University Press of Florida, New York, 256 pp.).
Molecular markers are a useful tool for sea turtle research, as they offer an indirect approach to test behavior, ecology and evolution (Lee, 2008Lee PLM (2008) Molecular ecology of sea turtles: New approaches and future directions. J Exp Mar Biol Ecol 356:25–42.). Population structure studies of these phylopatric species have focused on mitochondrial DNA sequences (mtDNA), as this is a maternally inherited marker. Differences at mtDNA haplotype frequencies among rookeries provide information to link feeding populations with their natal origins (Bowen and Karl, 2007Bowen BW and Karl SA (2007) Population genetics and phylogeography of sea turtles. Mol Ecol 16:4886–4907.), and may inform of past demographic events (Naro-Maciel et al., 2014Naro-Maciel E, Reid BN, Alter SE, Amato G, Bjorndal KA, Bolten AB, Martin M, Nairn CJ, Shamblin B and Pineda-Catalan O (2014) From refugia to rookeries: Phylogeography of Atlantic green turtles. J Exp Mar Biol Ecol 461:306–316.).
The methodology known as mixed stock analysis uses Bayesian algorithm to estimate the contributions of different rookeries to a feeding ground (Okuyama and Bolker, 2005Okuyama T and Bolker BM (2005) Combining genetic and ecological data to estimate sea turtle origins. Ecol Appl 15:315–325.; Bolker et al., 2007Bolker BM, Okuyama T, Bjorndal KA and Bolten AB (2007) Incorporating multiple mixed stocks in mixed stock analysis: ‘many-to-many’ analyses. Mol Ecol 16:685–695.). The method gives the percentage of each stock as contribution to a foraging aggregation, or mixed stock, and has been proven useful to study the natal origins of green turtles (Bass and Witzell, 2000Bass AL and Witzell WN (2000) Demographic composition of immature green turtles (Chelonia mydas) from the east central Florida coast: Evidence from mtDNA markers. Herpetologica 56:357–367.; Luke et al., 2004Luke K, Horrocks JA, Leroux RA and Dutton pH (2004) Origins of green turtle (Chelonia mydas) feeding aggregations around Barbados, West Indies. Mar Biol 144:799–805.; Bass et al., 2006Bass AL, Epperly SP and Braun-Mcneill J (2006) Green turtle (Chelonia mydas) foraging and nesting aggregations in the Caribbean and Atlantic: Impact of currents and behavior on dispersal. J Hered 97:346–354.; Bjorndal and Bolten, 2008Bjorndal KA and Bolten AB (2008) Annual variation in source contributions to a mixed stock: Implications for quantifying connectivity. Mol Ecol 17:2185–2193.).
Green sea turtles (Chelonia mydas Linnaeus, 1758) are listed as endangered according to IUCN Red List as a result of overexploitation of eggs, adult females at nesting beaches, juveniles and adults at feeding grounds, marine fisheries and pollution; mortality associated with entanglement in marine fisheries and degradation of both nesting and foraging habitat also play a role in the decline of many populations (Seminoff, 2004Seminoff JA (2004) Chelonia mydas. [www.iucnredlist.org/details/4615/0] (November 28, 2012).
www.iucnredlist.org/details/4615/0...
).
The lack of genetic sampling of green turtle feeding grounds precludes the complete understanding of the spatial ecology of these animals (Naro-Maciel et al., 2012Naro-Maciel E, Bondioli ACV, Martin M, Almeida APA, Baptistotte C, Bellini C, Marcovaldi MA, Santos AJB and Amato G (2012) The interplay of homing and dispersion in green turtles: A focus on the Southwestern Atlantic. J Hered 103:781–792. and references therein). The recognition of the importance of an international framework is necessary to assure survival and success of the populations (Bass et al., 2006Bass AL, Epperly SP and Braun-Mcneill J (2006) Green turtle (Chelonia mydas) foraging and nesting aggregations in the Caribbean and Atlantic: Impact of currents and behavior on dispersal. J Hered 97:346–354.).
The research at feeding grounds is less developed when compared to rookeries, where females are easily observed (Bowen and Karl, 2007Bowen BW and Karl SA (2007) Population genetics and phylogeography of sea turtles. Mol Ecol 16:4886–4907.), and much information regarding their life history might be incomplete (Bass and Witzell, 2000Bass AL and Witzell WN (2000) Demographic composition of immature green turtles (Chelonia mydas) from the east central Florida coast: Evidence from mtDNA markers. Herpetologica 56:357–367.). For these reasons, the objectives of this study were (1) to genetically characterize the green turtle population which uses an Atlantic Forest estuarine complex as a feeding ground; (2) to assess and compare the genetic diversity among this study site and previously published data of feeding grounds; (3) to estimate the natal origins of the juvenile green turtles and the connectivity between rookeries and feeding grounds, based on mitochondrial DNA sequences, improving the knowledge about this complex population structure; and (4) to infer demographic events of this population, in order to contribute to understand how climate-related changes may have impacted southern Atlantic green turtle populations.
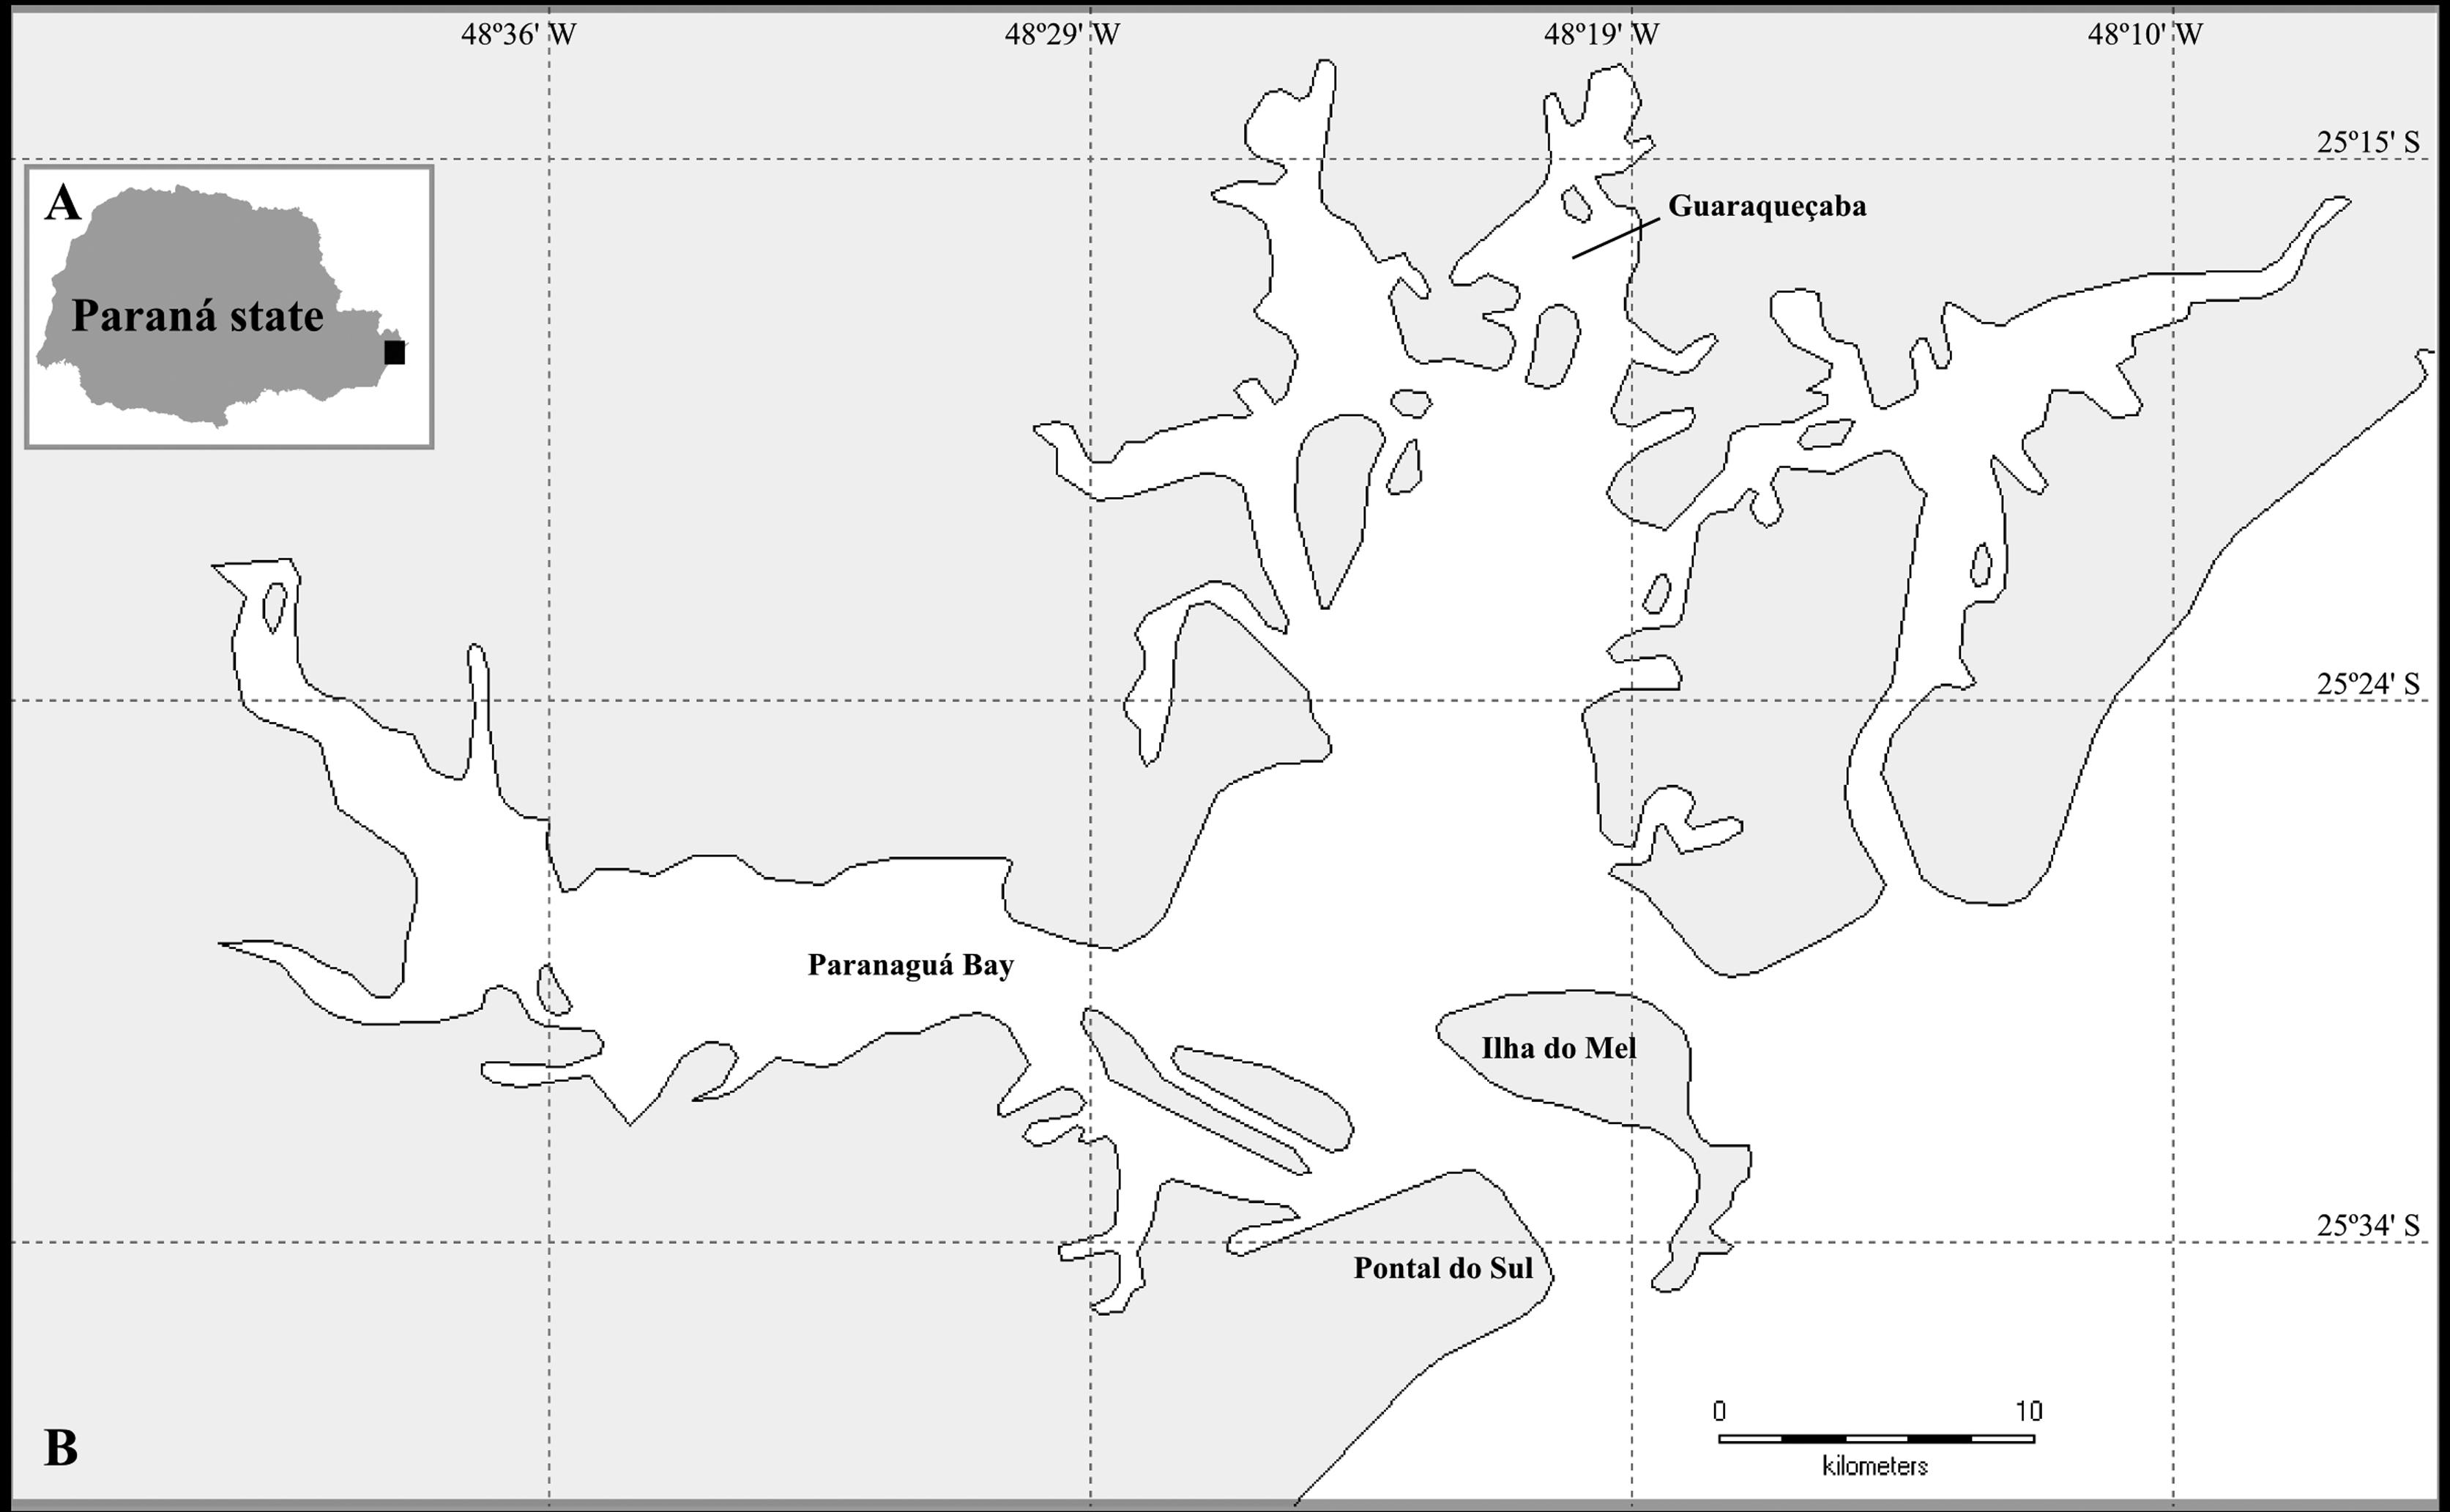
The sampling was carried out at the Paranaguá Estuarine Complex (PEC) (Figure 1), located at the northern coast of Paraná state in southern Brazil, considered a Natural World Heritage site (UNESCO, 1999UNESCO (United Nations Educational, Scientific and Cultural Organization) (1999) World Heritage List: Atlantic Forest South-East Reserves, http://whc.unesco.org/en/list/893 (April 28, 2013).
http://whc.unesco.org/en/list/893...
). This region has approximately 600 km2 and includes extensive areas of mangrove forests, sandy beaches and rocky islands (Noernberg et al., 2004Noernberg MA, Lautert LFL, Araújo AD, Marone E, Angelotti R, Netto JPB and Krug LA (2004) Remote sensing and GIS integration for modeling the Paranaguá Estuarine Complex-Brazil. J Coast Res 39:1627–1631.). A mosaic of conservation units, including marine and terrestrial units of restricted and sustainable use, is present at the study area. With these different habitats and various food resources, the study site, is a feeding ground for the green turtle (Guebert-Bartholo et al., 2011Guebert-Bartholo FM, Barletta M, Costa MF and Monteiro-Filho ELA (2011) Using gut contents to assess foraging patterns of juvenile green turtles Chelonia mydas in the Paranaguá Estuary, Brazil. Endang Species Res 13:131–143.).
Map of the study area. A: Map of the Paraná state, in Brazil; the black square indicates the geographic localization of the studied area (detailed in B). B: The Paranaguá Estuarine Complex (PEC), composed by small bays. Names represent main sampling areas of this study (Paranaguá Bay, Pontal do Sul, Ilha do Mel and Guaraqueçaba Bay).
The sampling consisted of monitoring the estuary and sand beaches once every two weeks, from 2005 to 2008. Tissue samples (n = 60) were collected from dead individuals found stranded or floating in the water, and were stored in 100% alcohol. DNA extraction followed the method of Aljanabi and Martinez (1997)Aljanabi SM and Martinez I (1997) Universal and rapid salt-extraction of high genomic DNA for PCR-based techniques. Nucleic Acids Res 25:4692–4693.. The primers LCM15382 and H950 (Abreu-Grobois et al., 2006Abreu-Grobois FA, Horrocks JA, Formia A, Leroux R, Velez-Zuazo X, Dutton P, Soares L, Meylan P and Browe D (2006) New mtDNA Dloop primers which work for a variety of marine turtle species may increase the resolution capacity of mixed stock analyses. In: Frick M, Panagopoulou A, Rees AF and Williams K (eds) 26th Ann Symp Sea Turtle Biol Cons, Crete, pp 179.) were used to amplify approximately 700 base pairs (bp) from the mitochondrial control region using the following PCR protocol: denaturation for 2 min 94 °C, followed by 40 cycles of 1 min at 94 °C, 1 min at 57 °C and 1 min at 72 °C, and a final extension of 10 min at 72 °C. Amplified products were sequenced using BigDye® Terminator v3.1 Cycle Sequencing kits (Applied Biosystems) in an ABI PRISM® 3100 Genetic Analyzer/HITACHI. Sequencing was done by the DNA Sequencing Service (SSDNA) at the University of São Paulo.
Sequences were aligned using BioEdit 5.0.6 (Hall, 1999Hall TA (1999) BioEdit: A user-friendly biological sequence alignment editor and analysis program for Windows. Nucleic Acids Symp Ser 41:95–98.) and haplotypes were identified according to the Archie Carr Center for Sea Turtle Research. A haplotype network was generated by TCS (Clement et al., 2000Clement M, Posada D and Crandall KA (2000) TCS: A computer program to estimate gene genealogies. Mol Ecol 9:1657–1660.), considering the long sequences generated by our primer pairs. The model of nucleotide substitution chosen for the analyses was a Jukes-Cantor following jModelTest (Posada, 2008Posada D (2008) jModelTest: Phylogenetic model averaging. Mol Biol Evol 25:1253–1256.). The software Arlequin 3.5 (Excoffier et al., 2005Excoffier L, Laval G and Schneider S (2005) Arlequin ver. 3.5: An integrated software package for population genetics data analysis. Evol Bioinform Online 1:47–50.) was used to assess haplotype and nucleotide diversity indices. Analyses of molecular variance (AMOVA) and exact tests of differentiation were also performed to study the genetic structure among FGs. To make comparisons with other datasets possible, we shortened our sequences to 480 bp for mixed stock analysis. The other FGs considered in the analyses were: North Carolina (Bass et al., 2006Bass AL, Epperly SP and Braun-Mcneill J (2006) Green turtle (Chelonia mydas) foraging and nesting aggregations in the Caribbean and Atlantic: Impact of currents and behavior on dispersal. J Hered 97:346–354.), Florida (Encalada et al., 1996Encalada SE, Lahanas PN, Bjorndal KA, Bolten AB, Miyamoto MM and Bowen BW (1996) Phylogeography and population structure of the Atlantic and Mediterranean green turtle Chelonia mydas: A mitochondrial DNA control region sequence assessment. Mol Ecol 5:473–483.; Bass and Witzell, 2000Bass AL and Witzell WN (2000) Demographic composition of immature green turtles (Chelonia mydas) from the east central Florida coast: Evidence from mtDNA markers. Herpetologica 56:357–367.), Bahamas (Lahanas et al., 1998Lahanas PN, Bjorndal KA, Bolten AB, Encalada SE, Miyamoto MM, Valverde RA and Bowen BW (1998) Genetic composition of a green turtle (Chelonia mydas) feeding ground population: Evidence for multiple origins. Mar Biol 130:345–352.), Nicaragua (Bass et al., 1998Bass AL, Lagueux CJ and Bowen BW (1998) Origin of green turtles, Chelonia mydas, at “sleeping rocks” off the northeast coast of Nicaragua. Copeia 4:1064–1069.), Barbados (Luke et al., 2004Luke K, Horrocks JA, Leroux RA and Dutton pH (2004) Origins of green turtle (Chelonia mydas) feeding aggregations around Barbados, West Indies. Mar Biol 144:799–805.), Almofala and Ubatuba (Naro-Maciel et al., 2007Naro-Maciel E, Becker JH, Lima E, Marcovaldi MA and DeSalle R (2007) Testing dispersal hypotheses in foraging green sea turtles (Chelonia mydas) of Brazil. J Hered 98:29–39.), Rocas Atoll, Fernando de Noronha, Espírito Santo and Bahia (Naro-Maciel et al., 2012Naro-Maciel E, Bondioli ACV, Martin M, Almeida APA, Baptistotte C, Bellini C, Marcovaldi MA, Santos AJB and Amato G (2012) The interplay of homing and dispersion in green turtles: A focus on the Southwestern Atlantic. J Hered 103:781–792.), Arvoredo Island (Proietti et al., 2009Proietti MC, Lara-Ruiz P, Reisser JW, Pinto LS, Dellagostin OA and Marins LF (2009) Green turtles (Chelonia mydas) foraging at Arvoredo Island in Southern Brazil: Genetic characterization and mixed stock analysis through mtDNA control region haplotypes. Genet Mol Biol 32:613–618., 2012Proietti MC, Reisser JW, Kinas PG, Kerr R, Monteiro DS, Marinsand LF and Secchi ER (2012) Green turtle Chelonia mydas mixed stocks in the western South Atlantic, as revealed by mtDNA haplotypes and drifter trajectories. Mar Ecol Prog Ser 447:195–209.), Argentina (Prosdocimi et al., 2012Prosdocimi L, Carman VG, Albareda DA and Remis MI (2012) Genetic composition of green turtle feeding grounds in coastal waters of Argentina based on mitochondrial DNA. J Exp Mar Biol Ecol 412:37–45.) and Cabo Verde (Monzón-Arguello et al., 2010Monzón-Argüello C, López-Jurado LF, Rico C, Marco A, López P, Hays GC and Lee PLM (2010) Evidence from genetic and Lagrangian drifter data for transatlantic transport of small juvenile green turtles. J Biogeogr 37:1752–1766.).
Chi-square tests implemented in CHIRXC software (Zaykin and Pudovkin, 1993Zaykin DV and Pudovkin AI (1993) Two programs to estimate significance of Chi-square values using pseudo-probability test. J Hered 84:152.) were carried out to test the heterogeneity of this FG among the rookeries from the Atlantic Ocean. Mixed stock analyses were employed to test the origins of the juveniles present at the study area, as well as to assess the connectivity between nesting and feeding grounds of the Atlantic Ocean. The analyses were carried out using two different approaches: “one-to-many” (o2m), which estimates the contributions of different rookeries to one particular feeding ground; and “many-to-many” (m2m), estimating simultaneously the origins and destinations of individuals of multiple source (rookeries) and mixed stocks. The o2m analyses were performed using Bayes software (Pella and Masuda, 2001Pella J and Masuda M (2001) Bayesian methods for analysis of stock mixtures from genetic characters. Fish B-NOAA 99:151–167.), and the m2m were done by R programming (R Development Core Team, 2005R Development Core Team (2005) R: A language and environment for statistical computing, reference index version 2.x.x. R Foundation for Statistical Computing, Vienna, Austria. [http://www.R-project.org] (October 3, 2012).
http://www.R-project.org...
). Both analyses considered weighted prior probabilities according to number of nesting female at each rookery. The number of nesting females used for the weighted priors was assessed by Naro-Maciel et al. (2012)Naro-Maciel E, Bondioli ACV, Martin M, Almeida APA, Baptistotte C, Bellini C, Marcovaldi MA, Santos AJB and Amato G (2012) The interplay of homing and dispersion in green turtles: A focus on the Southwestern Atlantic. J Hered 103:781–792.. The analyses were run with 60,000 Markov Chain Monte Carlo (MCMC) and burn-ins of 30,000 runs.
The results assessed after Gelman and Rubin shrink factor application indicated convergence of the chains. The possible natal origins used in the analyses were Cuba (Ruíz-Urquíola et al., 2010Ruiz-Urquíola A, Riverón-Giro FB, Pérez-Bermúdez E, Abreu-Grobois FA, González-Pumariega M, James-Petric BL, Díaz-Fernández R, Álvarez-Castro JM, Jager M, Azanza-Ricardo J and Espinosa-López G (2010) Population genetic structure of Greater Caribbean green turtles (Chelonia mydas) based on mitochondrial DNA sequences, with an emphasis on rookeries form southwestern Cuba. Rev Invest Mar 31:33–52.), Mexico, Surinam, Aves Island and Florida (Encalada et al., 1996Encalada SE, Lahanas PN, Bjorndal KA, Bolten AB, Miyamoto MM and Bowen BW (1996) Phylogeography and population structure of the Atlantic and Mediterranean green turtle Chelonia mydas: A mitochondrial DNA control region sequence assessment. Mol Ecol 5:473–483.), Costa Rica (Bjorndal et al., 2005Bjorndal KA, Bolten AB and Troëng S (2005) Population structure and genetic diversity in green turtles nesting at Tortuguero, Costa Rica, based on mitochondrial DNA control region sequences. Mar Biol 147:1449–1457.), Trindade Island (Bjorndal et al., 2006Bjorndal KA, Bolten AB, Moreira L, Bellini C and Marcovaldi MA (2006) Population structure and diversity of Brazilian green turtle rookeries based on mitochondrial DNA sequences. Chelonian Conserv Biol 5:262–268.), Ascension Island (Encalada et al., 1996Encalada SE, Lahanas PN, Bjorndal KA, Bolten AB, Miyamoto MM and Bowen BW (1996) Phylogeography and population structure of the Atlantic and Mediterranean green turtle Chelonia mydas: A mitochondrial DNA control region sequence assessment. Mol Ecol 5:473–483., Formia et al., 2006Formia A, Godley BJ, Dontaine JF and Bruford MW (2006) Mitochondrial DNA diversity and phylogeography of endangered green turtle (Chelonia mydas) populations in Africa. Conserv Genet 7:353–369.), São Tomé and Bioko (Formia et al., 2006Formia A, Godley BJ, Dontaine JF and Bruford MW (2006) Mitochondrial DNA diversity and phylogeography of endangered green turtle (Chelonia mydas) populations in Africa. Conserv Genet 7:353–369.), Guinea Bissau (Encalada et al., 1996Encalada SE, Lahanas PN, Bjorndal KA, Bolten AB, Miyamoto MM and Bowen BW (1996) Phylogeography and population structure of the Atlantic and Mediterranean green turtle Chelonia mydas: A mitochondrial DNA control region sequence assessment. Mol Ecol 5:473–483., Bjorndal et al., 2006Bjorndal KA, Bolten AB, Moreira L, Bellini C and Marcovaldi MA (2006) Population structure and diversity of Brazilian green turtle rookeries based on mitochondrial DNA sequences. Chelonian Conserv Biol 5:262–268.) and Rocas Atoll (Encalada et al., 1996Encalada SE, Lahanas PN, Bjorndal KA, Bolten AB, Miyamoto MM and Bowen BW (1996) Phylogeography and population structure of the Atlantic and Mediterranean green turtle Chelonia mydas: A mitochondrial DNA control region sequence assessment. Mol Ecol 5:473–483., Bjorndal et al., 2006Bjorndal KA, Bolten AB, Moreira L, Bellini C and Marcovaldi MA (2006) Population structure and diversity of Brazilian green turtle rookeries based on mitochondrial DNA sequences. Chelonian Conserv Biol 5:262–268.).
The historical demographic processes were investigated with Fu’s FS (Fu, 1997Fu YX (1997) Statistical tests of neutrality against population growth, hitchhiking and background selection. Genetics 147:915–925.) and Fu and Li’s D* (Fu and Li, 1993Fu XY and Li WH (1993) Statistical tests of neutrality of selection. Genetics 133:6693–709.) tests, both with 10,000 coalescent simulations in DNASP v5 software (Librado and Rozas, 2009Librado P and Rozas J (2009) DnaSP v5: A software for comprehensive analysis of DNA polymorphism data. Bioinformatics 25:1451–1452.). Timing and extent of demographic changes were inferred by means of the Bayesian skyline plot (BSP) coalescent method implemented in BEAST v1.6.2 software (Drummond et al., 2005Drummond AJ, Rambaut A, Shapiro B and Pybus OG (2005) Bayesian coalescent inference of past population dynamics from molecular sequences. Mol Biol Evol 22:1185–1192.). An HKY mutation model without site heterogeneity was used, with a chain length of 100 million iterations. The effective sample size estimator was used to diagnose convergence. A mutation rate of 2.48 × 10⁻⁷ / site / generation was considered (Chassin-Noria et al., 2004Chassin-Noria O, Abreu-Grobois A, Dutton pH and Oyama K (2004) Conservation genetics of the East Pacific Green Turtle (Chelonia mydas) in Michoacan, Mexico. Genetica 121:195–206.), and the generation time set at a mean of 40 years.
All the animals sampled were juveniles and subadults. When considering only short sequences from the mtDNA control region, seven haplotypes were found, defined by 11 polymorphic sites: CM-A1, CM-A5, CM-A6, CM-A8, CM-A10, CM-A32 and CM-A46. The most common haplotype was CM-A8 (72%), followed by CM-A5 (13%) and all the other haplotypes were at frequencies less than 5%. For the long sequences, nine haplotypes were recorded (and 14 polymorphic sites), with a subdivision of CM-A8 haplotype in three: CM-A8.1, CM-A8.2 and CM-A8.3. Haplotype diversities (h) for short and long sequences were, respectively, 0.424 ± 0.076 and 0.473 ± 0.075. Nucleotide diversity (π) was 0.001 ± 0.001 for short sequences and 0.002 ± 0.001 for the long sequences.
Global exact tests of differentiation and AMOVA revealed that PEC is significantly distinct from all the other Atlantic FGs (exact p < 0.001, p < 0.001, respectively). In pairwise comparisons, PEC presented no significant difference from Ubatuba (exact p = 0.643 ± 0.003), Arvoredo (exact p = 0.193 ± 0.003) and Argentina (exact p = 0.216 ± 0.003).
Chi-square tests were implemented to test for heterogeneity between the study site and rookeries from Atlantic Ocean. PEC is significantly different from all other rookeries (χ2 = 4710.53, p < 0.001). The “one-to-many” mixed stock analyses revealed Ascension Island, followed by Aves Island/Surinam and Guinea Bissau as main contributors to PEC. The “many-to-many” analysis indicated Ascension Island as the main contributor to the PEC, followed by Guinea Bissau and Aves Island/Surinam (Table 1).
“One-to-many” and “many-to-many” mean contributions to PEC, and the upper and lower bounds of the 95% confidence interval.
Long sequence (700 bp) analyses improved the resolution of control region mtDNA haplotypes at the study area, as also shown for other sea turtle studies (Vargas et al., 2008Vargas SM, Araújo FCF, Monteiro DS, Almeida AP, Soares LS and Santos FR (2008) Genetic diversity and origin of leatherback turtles (Dermochelys coriacea) from the Brazilian coast. J Hered 99:215–220.; Shamblin et al., 2012Shamblin BM, Bjorndal KA, Bolten AB, Hillis-Starr ZM, Lundgren I, Naro-Maciel E and Nairn CJ (2012) Mitogenomic sequences better resolve stock structure of southern Greater Caribbean green turtle rookeries. Mol Ecol 21:2330–2340.; Dutton et al., 2013Dutton PH, Roden SE, Stewart KR, LaCasella E, Tiwari M, Formia A, Thomé JC, Livingstone SR, Eckert S, Chacon-Chaverri D, et al. (2013) Population stock structure of leatherback turtles (Dermochelys coriacea) in the Atlantic revealed using mtDNA and microsatellite markers. Conserv Genet 14:625–636.). It is worthy of note that the haplotype (CM-A8) revealed a “split” in three (CM-A8.1, CM-A8.2 and CM-A8.3), suggesting that these polymorphisms may be more informative at the resolution of population structure at a regional scale, as shown by Shamblin et al. (2012)Shamblin BM, Bjorndal KA, Bolten AB, Hillis-Starr ZM, Lundgren I, Naro-Maciel E and Nairn CJ (2012) Mitogenomic sequences better resolve stock structure of southern Greater Caribbean green turtle rookeries. Mol Ecol 21:2330–2340. for green turtle at southern Greater Caribbean rookeries.
Haplotype diversity found at PEC presented a very typical genetic profile with respect to other South Atlantic FGs (Naro-Maciel et al., 2007Naro-Maciel E, Becker JH, Lima E, Marcovaldi MA and DeSalle R (2007) Testing dispersal hypotheses in foraging green sea turtles (Chelonia mydas) of Brazil. J Hered 98:29–39., 2012Naro-Maciel E, Bondioli ACV, Martin M, Almeida APA, Baptistotte C, Bellini C, Marcovaldi MA, Santos AJB and Amato G (2012) The interplay of homing and dispersion in green turtles: A focus on the Southwestern Atlantic. J Hered 103:781–792.; Proietti et al., 2009Proietti MC, Lara-Ruiz P, Reisser JW, Pinto LS, Dellagostin OA and Marins LF (2009) Green turtles (Chelonia mydas) foraging at Arvoredo Island in Southern Brazil: Genetic characterization and mixed stock analysis through mtDNA control region haplotypes. Genet Mol Biol 32:613–618., 2012Proietti MC, Reisser JW, Kinas PG, Kerr R, Monteiro DS, Marinsand LF and Secchi ER (2012) Green turtle Chelonia mydas mixed stocks in the western South Atlantic, as revealed by mtDNA haplotypes and drifter trajectories. Mar Ecol Prog Ser 447:195–209.; Prosdocimi et al., 2012Prosdocimi L, Carman VG, Albareda DA and Remis MI (2012) Genetic composition of green turtle feeding grounds in coastal waters of Argentina based on mitochondrial DNA. J Exp Mar Biol Ecol 412:37–45.), differing from the cluster which comprises Caribbean and North Atlantic FGs (Figure 2) (Encalada et al., 1996Encalada SE, Lahanas PN, Bjorndal KA, Bolten AB, Miyamoto MM and Bowen BW (1996) Phylogeography and population structure of the Atlantic and Mediterranean green turtle Chelonia mydas: A mitochondrial DNA control region sequence assessment. Mol Ecol 5:473–483.; Lahanas et al., 1998Lahanas PN, Bjorndal KA, Bolten AB, Encalada SE, Miyamoto MM, Valverde RA and Bowen BW (1998) Genetic composition of a green turtle (Chelonia mydas) feeding ground population: Evidence for multiple origins. Mar Biol 130:345–352.; Bass and Witzell, 2000Bass AL and Witzell WN (2000) Demographic composition of immature green turtles (Chelonia mydas) from the east central Florida coast: Evidence from mtDNA markers. Herpetologica 56:357–367.; Luke et al., 2004Luke K, Horrocks JA, Leroux RA and Dutton pH (2004) Origins of green turtle (Chelonia mydas) feeding aggregations around Barbados, West Indies. Mar Biol 144:799–805.; Bass et al., 2006Bass AL, Epperly SP and Braun-Mcneill J (2006) Green turtle (Chelonia mydas) foraging and nesting aggregations in the Caribbean and Atlantic: Impact of currents and behavior on dispersal. J Hered 97:346–354.).
Genetic composition of Atlantic Ocean FGs. Only the most frequent haplotypes at each FG are represented; the least frequent haplotypes are not identified. The black square represents this study site (PEC) and red circles are for the FGs. Abbreviations are as follow: NC (North Carolina), FL (Florida), BH (Bahamas), NI (Nicaragua), BB (Barbados), CV (Cabo Verde), AM (Almofala), UB (Ubatuba), RA (Rocas Atoll), FN (Fernando de Noronha), ES (Espírito Santo), BA (Bahia), AD (Arvoredo Island) and AG (Argentina).
The m2m analysis had wider confidence intervals compared to the o2m. This may explain the difference of mean contributions seen in the two analyses: Ascension Island was considered the main contribution to this study site, although the values were different, the same was the case for Aves/Surinam and Guinea Bissau. Since the current available analyses for sea turtle natal origins present wide confidence intervals, these results should be treated as a qualitative (and not quantitative) estimator, as already suggested by Bowen and Karl (2007)Bowen BW and Karl SA (2007) Population genetics and phylogeography of sea turtles. Mol Ecol 16:4886–4907..
There are several factors which may be influencing the genetic composition of a feeding ground, such as number of nesting females, geographic distance and/or ocean currents (Lahanas et al., 1998Lahanas PN, Bjorndal KA, Bolten AB, Encalada SE, Miyamoto MM, Valverde RA and Bowen BW (1998) Genetic composition of a green turtle (Chelonia mydas) feeding ground population: Evidence for multiple origins. Mar Biol 130:345–352.; Bass and Witzell, 2000Bass AL and Witzell WN (2000) Demographic composition of immature green turtles (Chelonia mydas) from the east central Florida coast: Evidence from mtDNA markers. Herpetologica 56:357–367.; Luke et al., 2004Luke K, Horrocks JA, Leroux RA and Dutton pH (2004) Origins of green turtle (Chelonia mydas) feeding aggregations around Barbados, West Indies. Mar Biol 144:799–805.). The incorporation of ecological parameters can refine the analyses, yielding more consistent results to the biological reality of the species. As reported so far, Ascension Island, where the number of nesting female in each reproductive season is around 3000 (Seminoff, 2004Seminoff JA (2004) Chelonia mydas. [www.iucnredlist.org/details/4615/0] (November 28, 2012).
www.iucnredlist.org/details/4615/0...
), is considered the main contributor to all South Atlantic feeding grounds (Naro-Maciel et al., 2007Naro-Maciel E, Becker JH, Lima E, Marcovaldi MA and DeSalle R (2007) Testing dispersal hypotheses in foraging green sea turtles (Chelonia mydas) of Brazil. J Hered 98:29–39., 2012Naro-Maciel E, Bondioli ACV, Martin M, Almeida APA, Baptistotte C, Bellini C, Marcovaldi MA, Santos AJB and Amato G (2012) The interplay of homing and dispersion in green turtles: A focus on the Southwestern Atlantic. J Hered 103:781–792.; Proietti et al., 2009Proietti MC, Lara-Ruiz P, Reisser JW, Pinto LS, Dellagostin OA and Marins LF (2009) Green turtles (Chelonia mydas) foraging at Arvoredo Island in Southern Brazil: Genetic characterization and mixed stock analysis through mtDNA control region haplotypes. Genet Mol Biol 32:613–618., 2012Proietti MC, Reisser JW, Kinas PG, Kerr R, Monteiro DS, Marinsand LF and Secchi ER (2012) Green turtle Chelonia mydas mixed stocks in the western South Atlantic, as revealed by mtDNA haplotypes and drifter trajectories. Mar Ecol Prog Ser 447:195–209.; Prosdocimi et al., 2012Prosdocimi L, Carman VG, Albareda DA and Remis MI (2012) Genetic composition of green turtle feeding grounds in coastal waters of Argentina based on mitochondrial DNA. J Exp Mar Biol Ecol 412:37–45.). Furthermore, Ascension Island might be favored by the presence of ocean currents that contribute to the movement of individuals to southwestern Atlantic sites. Trindade Island, on the other hand, is not on the path of some currents that are favorable to green turtle movements towards the South American coast (Prosdocimi et al., 2012Prosdocimi L, Carman VG, Albareda DA and Remis MI (2012) Genetic composition of green turtle feeding grounds in coastal waters of Argentina based on mitochondrial DNA. J Exp Mar Biol Ecol 412:37–45.), which may explain the low contribution from Trindade Island to PEC feeding grounds, despite their proximity (2026 km) and source population size (N = 900).
The PEC population showed a significant increase in effective size, with both Fu’s FS and Fu’s Li tests showing significant departure from neutrality, and BSP showing a five-fold increase since 20–25 kYA. This expansion is interpreted as a population recovery after the Wisconsin Glacial period, when the southern Atlantic provided refugia and thereafter, a source for recolonization of the Atlantic (Naro-Maciel et al., 2014Naro-Maciel E, Reid BN, Alter SE, Amato G, Bjorndal KA, Bolten AB, Martin M, Nairn CJ, Shamblin B and Pineda-Catalan O (2014) From refugia to rookeries: Phylogeography of Atlantic green turtles. J Exp Mar Biol Ecol 461:306–316.).
The Southwestern Atlantic (ASO) Sea Turtle Network is a network of experts on sea turtles of the South Atlantic that aims to provide and standardize the scientific information available on the biology, conservation and rehabilitation of sea turtles that visit Brazil, Uruguay and Argentina, in order to improve management practices, research, and the support for conservation procedures for these animals. The results obtained in the Paranaguá Estuarine Complex contribute to fill the gaps in our knowledge and, together with the results obtained by other groups in ASO, can guide management decisions. Green turtles look for sheltered habitats to forage, and the occurrence of juveniles highlights the importance of PEC as a developmental habitat in the southwestern Atlantic Ocean (Guebert-Bartholo et al., 2011Guebert-Bartholo FM, Barletta M, Costa MF and Monteiro-Filho ELA (2011) Using gut contents to assess foraging patterns of juvenile green turtles Chelonia mydas in the Paranaguá Estuary, Brazil. Endang Species Res 13:131–143.).
The results of this study provide genetic evidence to support the existence of a highly diverse population, recovering after the Last Glacial Maximum, composed by individuals recruited from multiple nesting beaches of Atlantic Ocean, feeding in the Paranaguá Estuarine Complex. This study emphasizes the importance of characterizing the migratory connectivity between nesting and foraging aggregations, adding a previous unsampled feeding ground to the knowledge on green turtle populations of the Atlantic Ocean. The juvenile phase is the most difficult to understand, and studies concerning this group are of critical importance. Comprehending this step is necessary to create mitigation measures for green turtle protection, including the identification of priority habitats along the green turtles distribution areas.
Acknowledgments
The authors thank the Instituto de Pesquisas Cananéia (IpeC), Conselho Nacional de Desenvolvimento Científico e Tecnológico (Proc. 132682/2006), CAPES and FAPESP (Proc. 2010/52421-1 and Proc. 2012/18042-9).
-
Associate Editor: Antonio Matteo Solé-Cava
References
- Abreu-Grobois FA, Horrocks JA, Formia A, Leroux R, Velez-Zuazo X, Dutton P, Soares L, Meylan P and Browe D (2006) New mtDNA Dloop primers which work for a variety of marine turtle species may increase the resolution capacity of mixed stock analyses. In: Frick M, Panagopoulou A, Rees AF and Williams K (eds) 26th Ann Symp Sea Turtle Biol Cons, Crete, pp 179.
- Aljanabi SM and Martinez I (1997) Universal and rapid salt-extraction of high genomic DNA for PCR-based techniques. Nucleic Acids Res 25:4692–4693.
- Bass AL and Witzell WN (2000) Demographic composition of immature green turtles (Chelonia mydas) from the east central Florida coast: Evidence from mtDNA markers. Herpetologica 56:357–367.
- Bass AL, Lagueux CJ and Bowen BW (1998) Origin of green turtles, Chelonia mydas, at “sleeping rocks” off the northeast coast of Nicaragua. Copeia 4:1064–1069.
- Bass AL, Epperly SP and Braun-Mcneill J (2006) Green turtle (Chelonia mydas) foraging and nesting aggregations in the Caribbean and Atlantic: Impact of currents and behavior on dispersal. J Hered 97:346–354.
- Bjorndal KA and Bolten AB (2008) Annual variation in source contributions to a mixed stock: Implications for quantifying connectivity. Mol Ecol 17:2185–2193.
- Bjorndal KA, Bolten AB and Troëng S (2005) Population structure and genetic diversity in green turtles nesting at Tortuguero, Costa Rica, based on mitochondrial DNA control region sequences. Mar Biol 147:1449–1457.
- Bjorndal KA, Bolten AB, Moreira L, Bellini C and Marcovaldi MA (2006) Population structure and diversity of Brazilian green turtle rookeries based on mitochondrial DNA sequences. Chelonian Conserv Biol 5:262–268.
- Bolker BM, Okuyama T, Bjorndal KA and Bolten AB (2007) Incorporating multiple mixed stocks in mixed stock analysis: ‘many-to-many’ analyses. Mol Ecol 16:685–695.
- Bolten AB (2003) Variation in sea turtle life history patterns: Neritic vs. oceanic developmental stages. In: Lutz PL, Musick JA and Wyneken J (eds) The Biology of Sea Turtles, vol. II. CRC Press, Boca Raton, pp 243–257.
- Bowen BW and Karl SA (2007) Population genetics and phylogeography of sea turtles. Mol Ecol 16:4886–4907.
- Carr AF (1967) So Excellent a Fish: A Natural History of Sea Turtles. University Press of Florida, New York, 256 pp.
- Chassin-Noria O, Abreu-Grobois A, Dutton pH and Oyama K (2004) Conservation genetics of the East Pacific Green Turtle (Chelonia mydas) in Michoacan, Mexico. Genetica 121:195–206.
- Clement M, Posada D and Crandall KA (2000) TCS: A computer program to estimate gene genealogies. Mol Ecol 9:1657–1660.
- Drummond AJ, Rambaut A, Shapiro B and Pybus OG (2005) Bayesian coalescent inference of past population dynamics from molecular sequences. Mol Biol Evol 22:1185–1192.
- Dutton PH, Roden SE, Stewart KR, LaCasella E, Tiwari M, Formia A, Thomé JC, Livingstone SR, Eckert S, Chacon-Chaverri D, et al. (2013) Population stock structure of leatherback turtles (Dermochelys coriacea) in the Atlantic revealed using mtDNA and microsatellite markers. Conserv Genet 14:625–636.
- Encalada SE, Lahanas PN, Bjorndal KA, Bolten AB, Miyamoto MM and Bowen BW (1996) Phylogeography and population structure of the Atlantic and Mediterranean green turtle Chelonia mydas: A mitochondrial DNA control region sequence assessment. Mol Ecol 5:473–483.
- Excoffier L, Laval G and Schneider S (2005) Arlequin ver. 3.5: An integrated software package for population genetics data analysis. Evol Bioinform Online 1:47–50.
- Formia A, Godley BJ, Dontaine JF and Bruford MW (2006) Mitochondrial DNA diversity and phylogeography of endangered green turtle (Chelonia mydas) populations in Africa. Conserv Genet 7:353–369.
- Fu YX (1997) Statistical tests of neutrality against population growth, hitchhiking and background selection. Genetics 147:915–925.
- Fu XY and Li WH (1993) Statistical tests of neutrality of selection. Genetics 133:6693–709.
- Guebert-Bartholo FM, Barletta M, Costa MF and Monteiro-Filho ELA (2011) Using gut contents to assess foraging patterns of juvenile green turtles Chelonia mydas in the Paranaguá Estuary, Brazil. Endang Species Res 13:131–143.
- Hall TA (1999) BioEdit: A user-friendly biological sequence alignment editor and analysis program for Windows. Nucleic Acids Symp Ser 41:95–98.
- Lahanas PN, Bjorndal KA, Bolten AB, Encalada SE, Miyamoto MM, Valverde RA and Bowen BW (1998) Genetic composition of a green turtle (Chelonia mydas) feeding ground population: Evidence for multiple origins. Mar Biol 130:345–352.
- Librado P and Rozas J (2009) DnaSP v5: A software for comprehensive analysis of DNA polymorphism data. Bioinformatics 25:1451–1452.
- Lee PLM (2008) Molecular ecology of sea turtles: New approaches and future directions. J Exp Mar Biol Ecol 356:25–42.
- Luke K, Horrocks JA, Leroux RA and Dutton pH (2004) Origins of green turtle (Chelonia mydas) feeding aggregations around Barbados, West Indies. Mar Biol 144:799–805.
- Monzón-Argüello C, López-Jurado LF, Rico C, Marco A, López P, Hays GC and Lee PLM (2010) Evidence from genetic and Lagrangian drifter data for transatlantic transport of small juvenile green turtles. J Biogeogr 37:1752–1766.
- Naro-Maciel E, Becker JH, Lima E, Marcovaldi MA and DeSalle R (2007) Testing dispersal hypotheses in foraging green sea turtles (Chelonia mydas) of Brazil. J Hered 98:29–39.
- Naro-Maciel E, Bondioli ACV, Martin M, Almeida APA, Baptistotte C, Bellini C, Marcovaldi MA, Santos AJB and Amato G (2012) The interplay of homing and dispersion in green turtles: A focus on the Southwestern Atlantic. J Hered 103:781–792.
- Naro-Maciel E, Reid BN, Alter SE, Amato G, Bjorndal KA, Bolten AB, Martin M, Nairn CJ, Shamblin B and Pineda-Catalan O (2014) From refugia to rookeries: Phylogeography of Atlantic green turtles. J Exp Mar Biol Ecol 461:306–316.
- Noernberg MA, Lautert LFL, Araújo AD, Marone E, Angelotti R, Netto JPB and Krug LA (2004) Remote sensing and GIS integration for modeling the Paranaguá Estuarine Complex-Brazil. J Coast Res 39:1627–1631.
- Okuyama T and Bolker BM (2005) Combining genetic and ecological data to estimate sea turtle origins. Ecol Appl 15:315–325.
- Pella J and Masuda M (2001) Bayesian methods for analysis of stock mixtures from genetic characters. Fish B-NOAA 99:151–167.
- Posada D (2008) jModelTest: Phylogenetic model averaging. Mol Biol Evol 25:1253–1256.
- Proietti MC, Lara-Ruiz P, Reisser JW, Pinto LS, Dellagostin OA and Marins LF (2009) Green turtles (Chelonia mydas) foraging at Arvoredo Island in Southern Brazil: Genetic characterization and mixed stock analysis through mtDNA control region haplotypes. Genet Mol Biol 32:613–618.
- Proietti MC, Reisser JW, Kinas PG, Kerr R, Monteiro DS, Marinsand LF and Secchi ER (2012) Green turtle Chelonia mydas mixed stocks in the western South Atlantic, as revealed by mtDNA haplotypes and drifter trajectories. Mar Ecol Prog Ser 447:195–209.
- Prosdocimi L, Carman VG, Albareda DA and Remis MI (2012) Genetic composition of green turtle feeding grounds in coastal waters of Argentina based on mitochondrial DNA. J Exp Mar Biol Ecol 412:37–45.
- Ruiz-Urquíola A, Riverón-Giro FB, Pérez-Bermúdez E, Abreu-Grobois FA, González-Pumariega M, James-Petric BL, Díaz-Fernández R, Álvarez-Castro JM, Jager M, Azanza-Ricardo J and Espinosa-López G (2010) Population genetic structure of Greater Caribbean green turtles (Chelonia mydas) based on mitochondrial DNA sequences, with an emphasis on rookeries form southwestern Cuba. Rev Invest Mar 31:33–52.
- Shamblin BM, Bjorndal KA, Bolten AB, Hillis-Starr ZM, Lundgren I, Naro-Maciel E and Nairn CJ (2012) Mitogenomic sequences better resolve stock structure of southern Greater Caribbean green turtle rookeries. Mol Ecol 21:2330–2340.
- Vargas SM, Araújo FCF, Monteiro DS, Almeida AP, Soares LS and Santos FR (2008) Genetic diversity and origin of leatherback turtles (Dermochelys coriacea) from the Brazilian coast. J Hered 99:215–220.
- Zaykin DV and Pudovkin AI (1993) Two programs to estimate significance of Chi-square values using pseudo-probability test. J Hered 84:152.
Internet Resources
- R Development Core Team (2005) R: A language and environment for statistical computing, reference index version 2.x.x. R Foundation for Statistical Computing, Vienna, Austria. [http://www.R-project.org] (October 3, 2012).
» http://www.R-project.org - Seminoff JA (2004) Chelonia mydas [www.iucnredlist.org/details/4615/0] (November 28, 2012).
» www.iucnredlist.org/details/4615/0 - UNESCO (United Nations Educational, Scientific and Cultural Organization) (1999) World Heritage List: Atlantic Forest South-East Reserves, http://whc.unesco.org/en/list/893 (April 28, 2013).
» http://whc.unesco.org/en/list/893
Publication Dates
-
Publication in this collection
Sept 2015
History
-
Received
01 Dec 2014 -
Accepted
31 May 2015