
 Methodology for Characterizing Night Vision Goggle Systems Using Modulation Transfer Function
ABSTRACT
This study presents an initial step toward an objective methodology for characterizing night vision goggle (NVG) systems using the modulation transfer function. Although NVGs remain essential in operational environments, their performance has traditionally been assessed through subjective judgments made by human observers. To overcome this limitation, the proposed approach replaces the human observer – specifically the human eye and its visual acuity – with a conventional camera operating in the visible region of the electromagnetic spectrum. The methodology is fully reproducible using a standard computer monitor and an ordinary camera. A simple optical assembly was developed to couple the camera to the NVG under evaluation. The results demonstrate that the methodology can detect performance degradation introduced by the NVG, including contrast loss, increased noise, and reduced sampling efficiency. The approach also supports the selection of appropriate color-target combinations and monitor-imaging conditions for repeatable characterization. The method detected sampling-efficiency reductions from 100% (reference) to 45%, 40%, and 23% under full-moon, quarter-moon, and starlight conditions, respectively. Rather than replacing human observers, this approach should be regarded as a complementary analytical procedure.
Keywords
Night vision goggles; Modulation transfer function; Slanted-edge method; Image quality; Sampling efficiency
INTRODUCTION
Night vision goggles (NVGs) have been essential to military aviation since the 1970s, allowing pilots to operate safely at low altitude under extremely low illumination. Despite this operational importance, NVG performance has traditionally been characterized through subjective assessments performed by human observers. Studies by Donohue-Perry et al. (1994), Fullenkamp et al. (2005), Rabin (1996), Task et al. (1993), and Wiley and Holly (1976) all relied on trained observers to evaluate visual acuity or resolution through NVGs (Abel 1994).
As noted by Rivamonte (1990), these approaches are inherently affected by individual variability, psychological influences, and decision bias. As a result, subjectivity makes it more difficult to compare NVG systems, monitor equipment degradation, and establish standardized performance metrics.
Given the growing dependence on NVGs in operational missions, the lack of an objective and repeatable evaluation method remains a significant gap. To address this need, the present study proposes a methodology based on the modulation transfer function (MTF), calculated through the slantededge method defined in ISO 12233 (2017). By replacing the human observer with a digital camera, the approach enables quantitative and reproducible measurements of NVG image quality.
The proposed method can be reproduced with any standard computer monitor and an ordinary camera. Because the characterization depends primarily on contrast, it does not require highly accurate color reproduction or specialized printed targets. By combining widely available devices with an MTFbased analysis, the framework offers an accessible and practical way to characterize NVG systems. Its main contribution is to show that no dedicated test pattern or standardized chart is required – only a color transition displayed on a screen or printed on a surface.
To validate the approach, known targets were imaged under controlled conditions both with and without NVG coupling. Reference images obtained without the NVG were analyzed with the slantededge method and the SFRMAT4 algorithm to calculate MTF and luminance sampling efficiency. These results were then compared with images captured through the NVG under illumination levels equivalent to full moon, quarter moon, and starlight conditions. In all cases, the image edges were kept slightly tilted, as required by the slantededge method.
This study hypothesizes that a visible‑band camera, when coupled to an NVG and analyzed via the ISO‑12233 MTF, can objectively quantify performance degradation across illumination levels without requiring specialized test charts.
The proposed approach also provides a practical framework for monitoring NVG degradation over time and improving operational use in NVG applications.
Materials
The experiments were conducted in a laboratory with controlled environmental conditions. Temperature was maintained at (23 ± 0.5) °C, and relative humidity was kept at (70 ± 10) %. Data acquisition was performed at night, with all light sources switched off and indicator lights covered.
Material selection and reproducibility
The materials used in this study were selected from equipment commonly found in everyday environments to ensure that the methodology could be reproduced easily. Because the slantededge method primarily requires the highest possible contrast at the color transition, some equipment parameters are not critical for reproducibility.
Colored targets were included to better represent nightflight conditions. Under low illumination, users may no longer distinguish colors clearly, yet those colors can still influence NVG performance. Although specific color‑parameter values are reported in this study, the methodology is not limited to those exact conditions.
Imaging equipment
Target images were captured using a Canon PowerShot A510 (3.2 MP, 35–140 mm f/2.6–5.5) integrated into the standard optical setup developed for the experiments. Although this is an older and relatively simple camera model, its specifications were sufficient for the objectives of the study. Since the emphasis was on how the camera was used rather than on the specific device itself, the methodology can be reproduced with other commonly available cameras.
The NVG system evaluated was a Generation 3 AN/AVS9/F4949. As with the camera, the focus of the study was not the specific model, but its operational use within the proposed methodology. Figure 1 shows the camera and NVG system integrated into the camera.

NVG system used in the standard optical setup. The gray device is the Canon PowerShot A510 camera, and the black device is a Generation 3 NVG.
Targets and selection criteria
The literature review revealed substantial variation in the targets used to evaluate NVG systems. However, no clear consensus was identified regarding either the most appropriate target type or the illumination conditions for these experiments.
To address this gap, the present study adopted both printed illuminated targets and screenprojected targets as experimental references. Although the studies identified in the literature relied exclusively on blackandwhite targets, this work also included colored targets to investigate how different colors may influence NVG performance under lowlight conditions.
In practical terms, the target design followed three guiding principles:
-
Printed and projected versions were created from the same source images;
-
Colored targets were included to better approximate operational nightflight conditions;
-
The priority was not to define an ideal color pair, but to identify targets with sufficiently high contrast for reliable analysis.
Accordingly, the methodology was designed to remain practical and reproducible: any available monitor or printer could be used, provided that the selected target offered the highest contrast and could therefore serve as a consistent reference.
The following targets were used: a rainbow target with analogous colors, a rainbow target with complementary colors, a blackandwhite target, a CMY basiccolor target (cyan, magenta, and yellow), and an RGB basiccolor target (red, green, and blue). The rainbow target is presented in Fig. 2.

Additional coated targets
This study also employed four targets manufactured on 1200H14 aluminum substrates and coated with colors similar to those used in military aviation. These targets, previously used by Silva (2021), were designated gray and green, orange and gray, orange and silver metallic, and silver metallic and gray (Fig. 3). In that earlier study, the slantededge method and MTF were also applied, but the objective was different: the focus was on determining emissivity rather than evaluating image quality.

Gray and green target, orange and gray target, orange and silver metallic target, and silver metallic and gray target.
Monitors, lamps, and target dimensions
During the experimental phase, two monitors (Monitor 1 and Monitor 2) and two lamps (Lamp 1 and Lamp 2) were used. Lamp 1 was a TL1030 TOYO circular white fluorescent lamp rated at 22 W and 110 V. Lamp 2 was a 5 W LLUM RGB LED bulb (E27, dual voltage, 16 colors) configured to emit white light.
The display devices were specified as follows. Monitor 1 was an LG FLATRON W2343TPF widescreen display with a 16:9 aspect ratio and a resolution of 1920 × 1080 pixels (Full HD 1080p). Monitor 2 was a 24inch Apple LEDbacklit TFT activematrix LCD with a 16:10 aspect ratio and a resolution of 1920 × 1200 pixels.
The targets were dimensioned to fit within the field of view (FOV) of the optical system, both with and without the NVG attached, when positioned at 60 cm. This ensured that only the target appeared in the captured image, preventing the edges of printed sheets or monitor borders from being included in the analysis.
Luminance conditions and measurement
As with target type and illumination, the literature showed no clear consensus regarding the luminance levels to be applied during the experimental phase. However, many studies have referenced luminance values associated with different moon phases. For this reason, the present work adopted the reference luminance levels listed in Table 1, together with homemade neutraldensity filters coupled to the optical system with the NVG attached (Table 2), to simulate those luminance conditions. The experimental opticaldensity values were measured using a Jasco V730 spectrophotometer.
To ensure objectivity and repeatability, the luminance and chromaticity coordinates of all targets used in the experimental phase were measured with a Konica Minolta Chroma Meter CS100A, a highprecision portable spot colorimeter and luminance meter.
METHODOLOGY
This study proposes an objective methodology for characterizing NVG systems through the MTF, using ordinary cameras and targets displayed on monitors or printed surfaces.
The methodological framework is based on the slantededge procedure defined in ISO 12233 (2017), which enables quantitative evaluation of image quality through edge analysis. In this approach, the human observer is replaced by a digital camera, allowing image degradation introduced by the NVG to be measured objectively and reproducibly.
Analytical basis of the MTF calculation
MTF can be derived from the spatial frequency response (SFR), which is obtained by analyzing edge characteristics in digital images. This is one of the procedures recommended in ISO 12233 (2017) for evaluating camera resolution. Within that standard, the slantededge method is treated as a specific case of edgegradient analysis applied to an image containing a welldefined edge.
The analysis is performed on a rectangular region of interest (ROI) containing a color transition slightly tilted – approximately 5° – relative to the photodetector array of the imaging sensor. From this region, a supersampled edge spread function (ESF) is obtained by reading the pixel values line by line. The MTF is then calculated from the first derivative of the ESF followed by a Fourier transform (Burns and Williams 2008; ISO 2017).
The SFRMAT4 algorithm, developed by Peter D. Burns for MATLAB, was implemented in accordance with ISO 12233 (2017). It computes the MTF for each RGB channel separately and for an additional channel corresponding to relative luminance, obtained as a weighted average of the RGB channels with weights of 0.213, 0.715, and 0.072 for R, G, and B, respectively (Santos 2017).
When MTF is analyzed as a function of spatial frequency, specific SFR values can be extracted for comparison with system tolerances. One commonly adopted limitingresolution criterion is the spatial frequency at which the SFR decreases to 10%. In SFRMAT4, this criterion is used to derive the samplingefficiency parameter, which compares the SFR value at 0.1 with the halfsampling frequency corresponding to the Nyquist frequency (Burns and Williams 2008; Silva 2021).
Sampling efficiency was selected because it directly reflects the system’s ability to preserve contrast near the Nyquist frequency, making it especially sensitive to blur and noise introduced by the NVG.
Experimental procedure and acquisition setup
The laboratory setup used during the experimental phase followed the recommendations of ISO 12233 (2017). Controlled lighting conditions were established by eliminating undesirable factors identified during preliminary observations with the NVG system. In all experiments, the distance between the target and the camera was fixed at (60.00 ± 0.02) cm to match the camera FOV. Figure 4 illustrates the experimental configurations.

Luminance values (Y) and chromaticity coordinates (x and y) were measured for both printed targets illuminated by Lamps 1 and 2 and screenprojected targets displayed on Monitors 1 and 2, using a Chroma Meter CS100A.
These luminance and chromaticity data were organized into tables, as illustrated by the blackandwhite printed target under Lamp 1 (Table 3) and the blackandwhite projected target on Monitor 1 (Table 4). To ensure comparability, both monitors were operated at maximum available contrast, and two brightness settings – maximum and minimum – were evaluated.
Camera and NVG operating conditions
During the experimental phase, the camera was operated in three modes: two manual modes and one automatic mode. These settings were defined based on previous studies and on the recommendations of ISO 12233 (2017). In manual modes 1 and 2, shutter speed was adjusted to control exposure. For comparison purposes, the focal plane was set to 60 cm in manual mode 1 and to infinity in manual mode 2.
Common camera settings applied to all three operating modes included the following:
-
Images were saved in JPG format.
-
No optical or digital zoom was used.
-
The flash was disabled.
-
The highest available resolution was selected (2048 × 1536 pixels).
-
The superfine compression setting was used to obtain the highest available image quality.
-
The timer was set to release the shutter 2 seconds after activation.
-
Automatic gain control (AGC) was disabled.
-
An f‑number of 2.6 was selected, corresponding to the lowest available value.
-
Ten images were acquired for statistical purposes.
For the NVG system, the focal plane was adjusted to both 60 cm and infinity, and the ocular setting was fixed at 0 diopters in all experiments to simulate normal vision.
Target images were first acquired using the optical system without NVG coupling. For each simulated experimental condition, the shutterspeed settings used in camera manual modes 1 and 2 were recorded.
The MTF of each generated image was calculated using the SFRMAT4 algorithm. ROIs were selected at the color transitions, with dimensions of 200 × 100 pixels for horizontal transitions and 100 × 200 pixels for vertical transitions. Figure 5 presents representative SFRMAT4 outputs used in the MTF analysis.
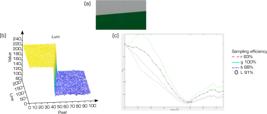
Representative SFRMAT4 outputs. (a) ROI image of the transition between white and green colors; (b) Luminance weights; (c) SFR calculated from the image in (a).
Figure 5a shows the ROI selected at the transition between the white and green regions of an image generated under a simulated experimental condition. Figure 5b presents the threedimensional plot of the luminance weights, which represent the contrast produced between the colors. The greater the difference between the luminance weights of distinct colors, the higher the contrast between them. Likewise, the more defined the edge between those colors, the more abrupt the threedimensional transition between the plateaus in the plot.
Figure 5c presents the MTF data as a function of spatial frequency. Noise peaks can be observed in both the yellow and blue regions of the plot. The higher and more numerous these peaks are, the lower the calculated luminance sampling efficiency will be. The upperright corner of the figure reports the luminance sampling efficiency for this ROI (91%), together with the individual values for the RGB channels.
The MTF was calculated for each ROI across the 414 color transitions identified in the 90 generated images, yielding one luminance samplingefficiency value per calculation.
Initially, the MTF results for color transitions obtained from rainbow targets with adjacent complementary colors were examined through the luminanceweight plots and the MTFversusspatialfrequency curves. For some transitions, these plots exhibited discrepancies.
The discrepancies observed in the luminance‑weight plots are illustrated in Fig. 6.

Luminance of the transition between red and blue colors of the rainbow projected target with adjacente complementary colors, Monitor 1, maximum brightness, camera manual mode 2.
Figure 6 illustrates one of these discrepancies. A valley (red circle) and a peak (green circle) appear in the threedimensional transition region between the color plateaus, indicating that the edge between the colors was not well defined. Silva (2021) reported similar discrepancies and suggested that they could be caused by the camera’s AGC. However, because AGC was disabled in the present study, that explanation could not account for the observed effect. For this reason, the corresponding ROI was further examined through an amplified view, shown in Fig. 7.

Amplified ROI of red and blue target transition rainbow with adjacent complementary colors, Monitor 1, maximum brightness, camera manual mode 2.
Inspection of Fig. 7 revealed the presence of a white line at the color transition. This line was not present in the original image used to create the target, as shown in Fig. 8.

Cutout of the transition between the red and blue colors of the image used in the making of the rainbow target with adjacent complementary colors.
After discussion with the author of the algorithm, a plausible explanation for the white line was identified as digital sharpening, which may become more pronounced in some images. This effect can create intermediate pixels along a color transition, generating an artificial line between adjacent regions. As a result, the transition is no longer well defined, which explains the discrepancies observed in the plots.
It was initially expected that targets based on basic RGB and CMY colors would exhibit fewer and less pronounced digitalsharpening artifacts than rainbow targets with adjacent complementary colors, because the basic colors were more visually pure. However, the same discrepancies in the luminanceweight plots and the same whiteline artifacts continued to appear in some transitions. The study therefore proceeded using only the rainbow targets with analogous colors, the rainbow targets with adjacent complementary colors, and the blackandwhite targets. This decision reduced the number of analyses while preserving the representativeness of colored targets in the experimental phase. Accordingly, the CMY and RGB basiccolor targets were excluded from the remainder of the study.
It was also observed, for some of the transitions imaged, that the MTF graphs as a function of spatial frequency presented a discrepancy, as exemplified in Fig. 9.
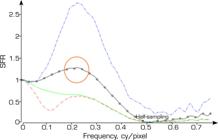
MTF as a function of the spatial frequency of the transition between the red and blue colors of the rainbow projected target with adjacent complementary colors, Monitor 1, maximum brightness, camera manual mode 2.
Figure 9 shows anomalous behavior in the luminance curve, highlighted by the orange circle, over the spatialfrequency range of approximately 0.1 to 0.3 cycle/pixel. Because the graph is normalized at 0 cycle/pixel, this deviation is readily visible. Santos (2017) reported a similar discrepancy and suggested that it is likely caused by an edgesharpening process automatically applied by the camera and not available for deactivation. This processing artificially intensifies one of the colors at the transition between the two regions, producing the abnormal behavior observed in the curve.
The MTF results obtained from transitions affected by digital sharpening or edge sharpening indicated that these images were not suitable for the proposed methodology. After excluding the images that produced anomalous MTF values, the analysis retained only those with the highest luminance sampling efficiency. The blackandwhite target shown in Table 5 illustrates this selection criterion.
The target images were then acquired using the optical system with the NVG coupled. For each simulated experimental condition, the shutterspeed settings used in camera manual modes 1 and 2 were recorded. Unlike the previous stage, in which all targets were imaged without NVG coupling, this stage was limited to the targets whose images had already been selected as references.
Figure 10 compares two images of the rainbow target with adjacent complementary colors: one obtained with the optical system alone and the other with the NVG coupled. After evaluation of luminance sampling efficiency, the corresponding results were plotted in Fig. 11. The uncertainty analysis indicated that the uncertainty values were smaller than the symbols used to represent the data points in the graph.

Example of rainbow images with nearby complementary colors generated by the optical system without NVG coupling (a) and with NVG coupling (b).

Results for sampling efficiency values in rainbow target luminance with adjacent complementary colors.
Table 6 presents the nine images acquired for the simulated experimental conditions of the printed rainbow target with adjacent complementary colors illuminated by Lamp 1. For each luminance condition – full moon, quarter moon, and starlight – three images were captured, one in each camera operating mode: automatic, manual mode 1, and manual mode 2.
Images generated optical system with NVG coupling rainbow printed target with adjacent complementary colors, Lamp 1.
All acquired images were processed with the SFRMAT4 algorithm to compute the MTF and obtain a luminance samplingefficiency value for each analysis. The ROIs were defined at the colortransition regions corresponding to those identified in the reference images.
The MTF results for each color transition were evaluated through the luminanceweight plots and the MTF curves as a function of spatial frequency. Images whose color transitions showed discrepancies caused by digital sharpening or edge sharpening were excluded from the analysis. The remaining images were then screened to identify those with the highest luminance sampling efficiency, which were subsequently compared with the corresponding reference images. Table 7 illustrates this selection process for the blackandwhite target.
The best reference images obtained without NVG coupling were then compared with the best images acquired with NVG coupling under luminance conditions equivalent to full moon, quarter moon, and starlight. Table 8 illustrates this comparison using the selected silver metallic and gray target images.
Comparison of selected optical system images with and without NVG coupling for silver metallic and gray targets.
The results were organized into tables to facilitate analysis of system behavior under each experimental condition and to support future monitoring of equipment wear through repeated application of the proposed methodology under the same recorded conditions.
RESULTS AND DISCUSSION
The proposed methodology enabled objective characterization of NVG performance under different luminance conditions and across multiple target types. Analysis of the reference images acquired without NVG coupling showed that the camera produced welldefined edge transitions, with luminance samplingefficiency values frequently above 90% and reaching 100% for some transitions, such as the blackandwhite target projected on Monitor 2 at maximum brightness.
These reference results confirm that the optical setup and imageanalysis procedure were sufficiently stable to support subsequent comparisons with NVGcoupled acquisitions.
Effect of NVG coupling and luminance reduction
After NVG coupling, luminance sampling efficiency decreased systematically, consistent with the additional noise, contrast loss, and sharpness degradation introduced by the image intensifier. This reduction became more pronounced as the simulated luminance decreased. For the blackandwhite target, for example, the efficiency dropped to approximately 45% under fullmoon luminance, 40% under quartermoon luminance, and 23% under starlight conditions.
The observed decrease in luminance sampling efficiency after NVG coupling was expected, since image intensifiers introduce noise, limit spatial resolution, and reduce contrast. The methodology made it possible to quantify this degradation in a reproducible and comparable manner across targets and lighting conditions.
Influence of target type on measured performance
A similar pattern was observed for the selected colored targets, including the rainbow targets with analogous and complementary colors. In all cases, sampling efficiency decreased as luminance was reduced, indicating greater performance loss by the NVG under more severe lighting conditions, as expected for a Generation 3 device.
The metallic targets, such as silver metallic and gray and orange and gray, showed that surfaces with higher reflectance or specular brightness tend to produce noisier transitions when imaged through the NVG, especially under lowluminance conditions. This effect was reflected in MTF curves with more pronounced noise peaks and a sharper reduction in sampling efficiency.
These findings indicate that target material and color combination directly influence the stability of the measured transition and, consequently, the quality of the resulting MTF analysis.
Artifacts, interpretation, and practical implications
Another important outcome was the identification of discrepancies caused by digital sharpening and edge sharpening. These effects reinforce the need for careful target selection and visual inspection of ROIs before MTF calculation. Excluding affected transitions proved essential to avoid misinterpretation of the results.
The analysis of metallic targets also provided relevant practical insights. The interaction between NVGs and highly reflective surfaces can generate artifacts that degrade MTF, an effect of particular importance in military aviation environments, where metallic surfaces are common in aircraft, vehicles, and infrastructure.
The consolidated tables assembled for each target and luminance condition provide a basis for comparing NVG performance across scenarios and for establishing a reference baseline for future monitoring of equipment wear.
Feasibility, limitations, and future applications
Overall, the results confirm the feasibility of the proposed methodology for objective NVG characterization using MTF derived from the slantededge method. The use of a digital camera proved effective in reducing the subjectivity inherent to visualacuitybased assessments, as noted by previous studies.
Nevertheless, this methodology should not be interpreted as a replacement for human observers, but rather as a complementary analytical procedure. It should also be noted that the NVG evaluated in this study is designed for binocular operation, whereas the present protocol assessed visual performance through a single eyepiece.
Finally, the methodology showed potential as a tool for monitoring NVG wear over time. Because intensifier performance tends to degrade with continued use, periodic repetition of the proposed tests may help identify performance losses before they compromise operational safety.
Despite these strengths, the methodology still depends on the characteristics of the camera used, requires strict control of lighting conditions, and cannot fully eliminate digital artifacts. Future work may explore the use of higherquality cameras, automated ROI selection, and application of the methodology to NVGs of different generations.
CONCLUSION
This study demonstrated the feasibility of an objective methodology for characterizing the performance of a thirdgeneration NVG system through the MTF obtained with the slantededge method. Based on the results presented, the main conclusions are summarized below.
Replacing the human observer with a digital camera proved effective in reducing subjectivity and improving measurement repeatability.
Luminance sampling efficiency decreased systematically after NVG coupling and became more strongly affected as luminance was reduced, especially under starlight conditions.
Colored and metallic targets exhibited distinct behaviors, indicating that target selection directly influences the quality and stability of the MTF analysis.
Digitalsharpening and edgesharpening effects introduced by the camera can compromise the analysis, making visual inspection of ROIs and exclusion of affected transitions essential.
The methodology establishes a reference baseline for monitoring NVG wear and supports periodic, comparable evaluations over time.
The proposed method is reproducible and may be extended to other NVG models, provided that the experimental conditions and precautions described in this study are maintained.
ACKNOWLEDGEMENTS
Nothing to declare.
-
DECLARATION OF USE OF ARTIFICIAL INTELLIGENCE TOOLS
Automatic revision performed by Copilot in Word.
-
FUNDING
Not applicable.
-
Peer Review History:
Single Blind Peer Review.
DATA AVAILABILITY STATEMENT
The data will be available upon request.
REFERENCES
-
[ISO] International Organization for Standardization (2017). ISO 12233:2017. Photography – electronic still picture imaging – resolution and spatial frequency responses. Geneva: ISO. [accessed Oct 19 2021]. https://www.iso.org/standard/88626.html
» https://www.iso.org/standard/88626.html -
Abel DH (1994). An image quality analysis of ANVIS-6 night vision goggles. Wright-Patterson Air Force Base (OH): Air Force Institute of Technology. [accessed Jul 12 2021]. https://vtechworks.lib.vt.edu/items/41ead8a3-73a8-4eef-958d-473786c64c77
» https://vtechworks.lib.vt.edu/items/41ead8a3-73a8-4eef-958d-473786c64c77 -
Burns PD, Williams D (2008). Sampling efficiency in digital camera performance standards. In: Image Quality and System Performance V. Bellingham (WA): SPIE. p. 37-41. https://doi.org/10.1117/12.766359
» https://doi.org/10.1117/12.766359 -
Donohue-Perry MM, Task HL, Dixon SA (1994). Visual acuity versus field of view and light level for night vision goggles (NVGs). In: Helmet-and Head-Mounted Displays and Symbology Design Requirements. Bellingham (WA): SPIE. p. 71-81. https://doi.org/10.1117/12.177350
» https://doi.org/10.1117/12.177350 -
Fullenkamp SC, Trissell TL, Aleva DL, Dixon S, Task HL (2005). Modulation transfer function as a predictor of visual acuity using a night vision device. In: Helmet-and Head-Mounted Displays X: Technologies and Applications. Bellingham (WA): SPIE. p. 55-64. https://doi.org/10.1117/12.603776
» https://doi.org/10.1117/12.603776 -
Marasco PL, Task HL (2003). The impact of target luminance and radiance on night vision device visual performance testing. In: Helmet-and Head-Mounted Displays VIII: Technologies and Applications. Bellingham (WA): SPIE. p. 174-183. https://doi.org/10.1117/12.487869
» https://doi.org/10.1117/12.487869 -
Rabin JC (1996). Image contrast and visual acuity through night vision goggles. Fort Rucker (AL): Army Aeromedical Research Laboratory. [accessed on July 21 2021]. https://apps.dtic.mil/sti/tr/pdf/ADA309417.pdf
» https://apps.dtic.mil/sti/tr/pdf/ADA309417.pdf -
Rivamonte LA (1990). Resolution and signal-to-noise measurement of US Army nightvision goggles. In: Helmet-Mounted Displays II. Bellingham (WA): SPIE. p. 206-215. https://doi.org/10.1117/12.20967
» https://doi.org/10.1117/12.20967 -
Santos HMK (2017). Utilização do método slanted-edge para caracterização e avaliação da MTF de sistemas eletro-ópticos aeroembarcados [master dissertation]. São José dos Campos: Instituto Tecnológico de Aeronáutica. In Portuguese. [accessed Apr 15 2021]. URL: https://www.sige.ita.br/wp-content/uploads/2021/09/217829_1.pdf?x66089
» https://www.sige.ita.br/wp-content/uploads/2021/09/217829_1.pdf?x66089 - Silva HSN (2021). Mid infrared emissivity analysis of aeronautical coatings for obtaining the modulation transfer function of electro-optical sensors using the slanted-edge method [master’s thesis]. São José dos Campos: Instituto Tecnológico de Aeronáutica. In Portuguese.
-
Silva HSN, Eick FBL, Damião AJ (2021). Slanted-edge method for MTF measurements in the infrared. Infrared Phys Technol. 118:103877. https://doi.org/10.1016/j.infrared.2021.103877
» https://doi.org/10.1016/j.infrared.2021.103877 -
Task HL, Hartman RT, Marasco PL, Zobel AR (1993). Methods for measuring characteristics of night vision goggles. Dayton (OH): Logicon Technical Services Inc. [accessed Jun 28 2021]. https://apps.dtic.mil/sti/html/tr/ADA277046/
» https://apps.dtic.mil/sti/html/tr/ADA277046/ -
Wiley RW, Holly FF (1976). Vision with the AN/PVS-5 night vision goggles. Fort Rucker (AL): Army Aeromedical Research Laboratory. https://doi.org/10.21236/ADA022782
» https://doi.org/10.21236/ADA022782
Edited by
-
Section editor:
Raul Bonadia Rodrigues https://orcid.org/0009-0003-6018-1683

 Source: Elaborated by the authors.
 Source: Elaborated by the authors.
 Source: Elaborated by the authors.
 Source: Elaborated by the authors.
 Source: Elaborated by the authors.
 Source: Elaborated by the authors.
 Source: Elaborated by the authors.
 Source: Elaborated by the authors.
 Source: Elaborated by the authors.
 Source: Elaborated by the authors.
 Source: Elaborated by the authors.


