
 Near-Infrared Reflectance for Silica Surface Area Determination in Aerospace Materials
ABSTRACT
The specific surface area of a filler influences its dispersion and interaction with the rubber and consequently the properties of thermal insulation in aerospace components. However, its determination generally requires complex instrumental methods. Therefore, the development of simpler methodologies with equivalent or higher precision remains of scientific interest. This study investigates the application of Fourier transform infrared spectroscopy using near-infrared (NIR) reflectance and the more conventional diffuse reflectance for silica analysis, a filler widely used in polymeric formulations. The analyzed samples presented surface area values between 170 and 800 m2·g-1. Results showed a methodological error within the instrumental limit (2%), lower than that reported for conventional methods (4-7%). The NIR reflectance methodology based on the relative band (A5260/A4540) provided the most accurate results and can be considered a practical alternative to conventional gas adsorption techniques, enabling shorter analysis times, a feature that is particularly relevant for aerospace processes subject to demanding project schedules.
Keywords
Near infrared; Reflectance; Specific surface area; Silicon dioxide
INTRODUCTION
Silica is a naturally occurring mineral that is abundant on Earth. It is also the main component of glass, cement, and ceramics, and is widely exploited commercially. Silica has several applications of great technological interest, for instance, in the aerospace field, as fillers in different formulations of flexible thermal protection (rubbers such as acrylonitrile-butadiene copolymer, nitrile butadiene rubber) for rocket engines (Bar et al. 2023; Elashker et al. 2024; Harris 2025; Magalhães 2023; Moretto et al. 2023; Okoli et al. 2023).
The important effect of the specific surface area (SSA) of fillers on the vulcanization characteristics and performance of rubbers and resins has been widely reported in the literature, including studies focused on aerospace materials and applications. Sowinska-Baranowska and Maciejewska (2021) studied the influence of the silica SSA (180 m2·g-1 and 380 m2·g-1) on the curing characteristics and properties of styrene-butadiene rubber (SBR). The results showed that the introduction of silica as a filler in SBR prolongs the optimal vulcanization time and reduces the crosslinking density in comparison with the formulation without the filler. This effect can be associated with the adsorption of species on the filler surface, especially in the case of silica with higher SSA (380 m2·g-1). The SSA of the silica has an impact on the tensile strength, elongation, and rupture of SBR vulcanizates. Improved thermal stability is also achieved due to the filler network created within the crosslinked elastomer matrix.
Padmanathan et al. (2021) investigated the effect of the SSA of silica, determined by the nitrogen adsorption method, on the viscoelastic and fatigue behavior of silica-filled SBR composites. Silica fillers with SSA values of 125 m2·g-1, 165 m2·g-1, and 200 m2·g-1 were selected. The authors employed different instrumental techniques in the study, including computed tomography (CT) and digital image correlation (DIC). They concluded that both the volumetric fraction of cracks, obtained by CT, and the volumetric strain measured by DIC increase with increasing silica SSA. The results were discussed based on the role of the reinforcing network in the viscoelastic behavior and fatigue damage mechanisms of SBR composites.
More recently, a review by Uniyal et al. (2025) provided a comprehensive analysis of nanosilica as a reinforcing component in epoxy composites, with emphasis on its suitability for aerospace applications. The study highlights that nanosilica, due to its high SSA and mechanical durability, leads to significant improvements in the resilience and overall mechanical performance of epoxy composites, making them highly promising materials for the aerospace sector.
The particle size of silica is important for its application. Different instrumental techniques are used to determine this parameter (Domíngues et al. 2020; Fiedler et al. 2022; Kestens et al. 2016; Magalhães et al. 2022; Osswald and Fehr 2006; Ramos et al. 2023; Sharma and Polizos 2020; Stach et al. 2020; Yassin et al. 2021). The smaller the particle size, the greater the SSA (Acevedo et al. 2021). Specific surface area is an important factor for the characterization of ceramic raw materials, as it influences the behavior of properties such as creep and reactivity in different phases of a production process. Specific surface area can be determined by various instrumental techniques (Gómez-Tena et al. 2014).
The most widely used analytical technique for determining the SSA of solid and powdered materials is volumetric gas adsorption. This technique evaluates the amount of gas adsorbed on the surface of the material as a function of the partial pressure applied, using appropriate theoretical models according to the type of test sample, such as the Brunauer, Emmett, and Teller (BET) model. The BET model is based on the adsorption of a nitrogen monomolecular layer on the sample surface. The type of gas used (nitrogen, krypton, argon, etc.) depends on the affinity of the surface being analyzed (Gómez-Tena et al. 2014).
Other indirect techniques can also be applied to determine the SSA of materials, such as the laser diffraction technique, which allows obtaining an approximate value of the SSA of different materials from data on particle size distribution and other physical parameters, such as the density of the material (Gómez-Tena et al. 2014).
The use of the aforementioned indirect techniques provides information on different properties from a single measurement, allowing the material to be characterized more effectively in a shorter period. However, according to the study by Gómez-Tena et al. (2014), the values calculated from both techniques are not comparable in absolute terms. The results from the nitrogen adsorption technique are closer to the nominal values. Nevertheless, a possible linear relationship is observed between the SSA values determined by both techniques, with the values obtained by nitrogen adsorption being six times greater than those obtained by laser diffraction. The correction factor between the two values depends on the type of material.
This scenario emphasizes that clearly reporting the SSA determination method is essential for the correct interpretation of the obtained values and for ensuring reproducibility in the prediction of material properties.
Due to the multiple steps involved in the BET technique and the costs associated with gas acquisition, the search for new methodologies that are less expensive and equally accurate for determining the SSA of materials remains attractive. Fourier transform infrared (FT-IR) spectroscopy in the near-infrared (NIR) region associated with chemometrics is one such option cited in the literature (Christy 2008). The surface area of six silica gel samples, determined by BET (reference data) and ranging from 300 to 750 m2·g-1, was measured by transmission NIR. The calibration curve plotted with the results was used to determine the SSA of unknown silica gel samples.
According to Christy (2008), the error estimated in the surface area for the unknown samples is within the same range as the error limits of BET determination. This indicates that the transmission NIR technique offers a fast and simple method for determining the surface area of silica gel particles. Furthermore, studies in the NIR region are particularly interesting, as they are traditionally fewer in number compared with those carried out in the mid-infrared (MIR) region.
A study by McCool et al. (2006) estimated the SSA of silica samples in the MIR region by transmission. The sample was prepared as a KBr pellet, and the analysis was performed by diffuse reflectance infrared FT (DRIFT). The measurement of the analytical band area is associated with the group to be determined (Pavia et al. 2015; Silverstein et al. 2005; Smith 1979). In this specific case, it corresponds to silanol groups. The methodology uses a relative area, which in this study is defined as the ratio between the integrated area of the first overtone of the silica band at 1870 cm-1 and the area of absorption of the isolated hydroxyl located at 3747 cm-1. The reported error is 4-7%. The study showed that relative humidity can interfere with the measurement of the band area at 3747 cm-1; therefore, the ambient relative humidity must be controlled during analysis.
Although the results of McCool et al. (2006) demonstrate that infrared analysis can be used as an alternative technique to BET measurement, some considerations regarding the developed methodology can be made. The use of KBr pellets may introduce moisture bands around 3300 and 1650 cm-1, and the measurement of band area may result in higher errors by allowing, in some cases, the interference of non-analytical bands (Smith 1979). Measuring band height can prevent such occurrences.
According to Magalhães et al. (2022), the state of the art in determining silica particle size involves FT-IR spectroscopy by reflectance in both MIR and NIR regions, using the DRIFT technique in the MIR region and near-infrared reflectance spectroscopy (NIRS) in the NIR region. The study indicates that the latter methodology is the most accurate, based on the analysis of test samples. In addition, there is a tendency to find smaller errors for absorbance measurements in samples with small and intermediate particle sizes.
In another study, FT-MIR analysis was used qualitatively by transmission, which is a more conventional mode of analysis (Schadosin et al. 2023). The study also included quantitative analysis using different instrumental techniques to investigate soil particle size fractions.
Chen et al. (2025) described the measurement of the SSA of silica gel using a solution adsorption method. Paper-based microfluidic analytical devices were employed, a calibration curve was constructed, and the methylene blue content was quantified after adsorption by silica gel. The advantages reported include low cost, high speed, ease of operation, and environmental friendliness compared with ultraviolet-visible spectroscopy for determining SSA. The analysis time was established at 3 hours. The authors reported a relative error < 30% and a coefficient of determination (R2) > 0.96.
With regard to this recent study by Chen et al. (2025), one observation can be made concerning the methodological error. Although 96% of the data are explained by the developed methodology, the reported error can be considered high, indicating opportunities for the development of more precise methods.
In this context, there is a need for studies that fill the existing gaps in SSA determination. This study presents a viable alternative to the well-known BET method by using reflectance FT-IR spectroscopy in the NIR region, employing both NIRA and DRIFT accessories. The methodology involves the measurement of absorption height and the use of relative FT-IR bands to achieve lower errors, thereby contributing to the state of the art in research on SSA determination in silica.
METHODOLOGY
Five silica samples provided by Kenvue (formerly Johnson & Johnson Consumer Health) were coded according to their SSA values: Sample A (170 m2·g-1), Sample B (200 m2·g-1), Sample C (230 m2·g-1), Sample D (700 m2·g-1), and Sample E (800 m2·g-1).
The FT-IR analyses were performed by reflectance in the MIR and NIR regions using a PerkinElmer Frontier FT-IR spectrometer with 20 scans. Each sample was analyzed five times. The analytical bands A5260 and A4540 were used in the quantitative analyses by NIR/DRIFT and NIR/NIRA.
The band around 5260 cm-1 is probably assigned to the fourth overtone (a multiple of the fundamental band) of the absorption at 1060 cm-1, while the band around 4540 cm-1 is probably assigned to both the combination of silica fundamental bands and the third overtone of the same absorption at 1060 cm-1 (Ferraresi et al. 2012; Goddu 1960; Magalhães et al. 2022).
The baselines used for the NIR/DRIFT methodology were: a) band at 5260 cm-1 – from 5420 to 5150 cm-1; and b) band at 4540 cm-1 – from 4642 to 4306 cm-1. The baselines used for the NIR/NIRA methodology were: a) band at 5260 cm-1 – from 5415 to 4695 cm-1; and b) band at 4540 cm-1 – from 4695 to 4240 cm-1.
The use of the relative band A5260/A4540 was also evaluated. The deviation and error of the methodology were calculated according to the procedures typically adopted in infrared spectroscopy (Horák and Vítek 1978; Magalhães et al. 2022). A test sample was analyzed under the same conditions used for constructing the calibration curve.
RESULTS AND DISCUSSION
Quantitative analysis by NIR/DRIFT
Figure 1 shows the NIR/DRIFT spectra, which were adequate and free from negative bands or specular reflection interferences that may occur in DRIFT spectra (Smith 1979). The spectra exhibited bands showing variations in height according to the SSA values for the A5260 and A4540 bands, suggesting that these bands can probably be evaluated quantitatively.

NIR/DRIFT spectra of silica samples: a = Sample A – 170 m2·g-1 b = Sample B – 200 m2·g-1 c = Sample C – 230 m2·g-1 d = Sample D – 700 m2·g-1 e = test sample 1; f = Sample E ‒ 800 m2·g-1.
The spectrum of test sample 1 was included in Fig. 1 for the evaluation and subsequent comparison of the intensity of the analytical bands 5260 and 4540 cm-1. This result represents a semi-quantitative assessment at this stage, that is, an indication of which absorbance value of the test sample would be closest to and correspond to an SSA value if this methodology were applied quantitatively. By analyzing Fig. 1, it is possible to assume that test sample 1 has a high SSA value, between 700 and 800 m2·g-1.
The NIR/DRIFT data for the A5260 band are presented in Table 1 and Fig. 2 (calibration curve – Eq. 1).

where y represents the median value of A5260, and x is the SSA value of the silica samples measured by the BET method.
The NIR/DRIFT results for the A4540 band, obtained using the same calculation method described by Horák and Vítek (1978) as in Table 1, resulted in a higher error of approximately 9%. This statistical treatment by Horák and Vítek (1978) is specific to infrared spectroscopy analyses of different systems (Barros et al. 2025; Carvalho et al. 2025). Thus, it is concluded that the A5260 band is the most suitable band for determining the SSA of silica samples by NIR/DRIFT. The methodology error using the A5260 band (4%) was also relatively close to that found in DRIFT particle size measurements (3%) (Magalhães et al. 2022).
The calibration curve (Fig. 2) showed a linearity trend, with the coefficient of determination (R2) indicating that 77% of the data were explained by the NIR/DRIFT methodology developed for the analyzed SSA range (170-800 m2·g-1).
Next, in an attempt to improve the linearity of the calibration curve and reduce the methodological error, a less conventional accessory, NIRA, was evaluated using the same reflectance mode in the NIR region.
Quantitative analysis by NIR/NIRA
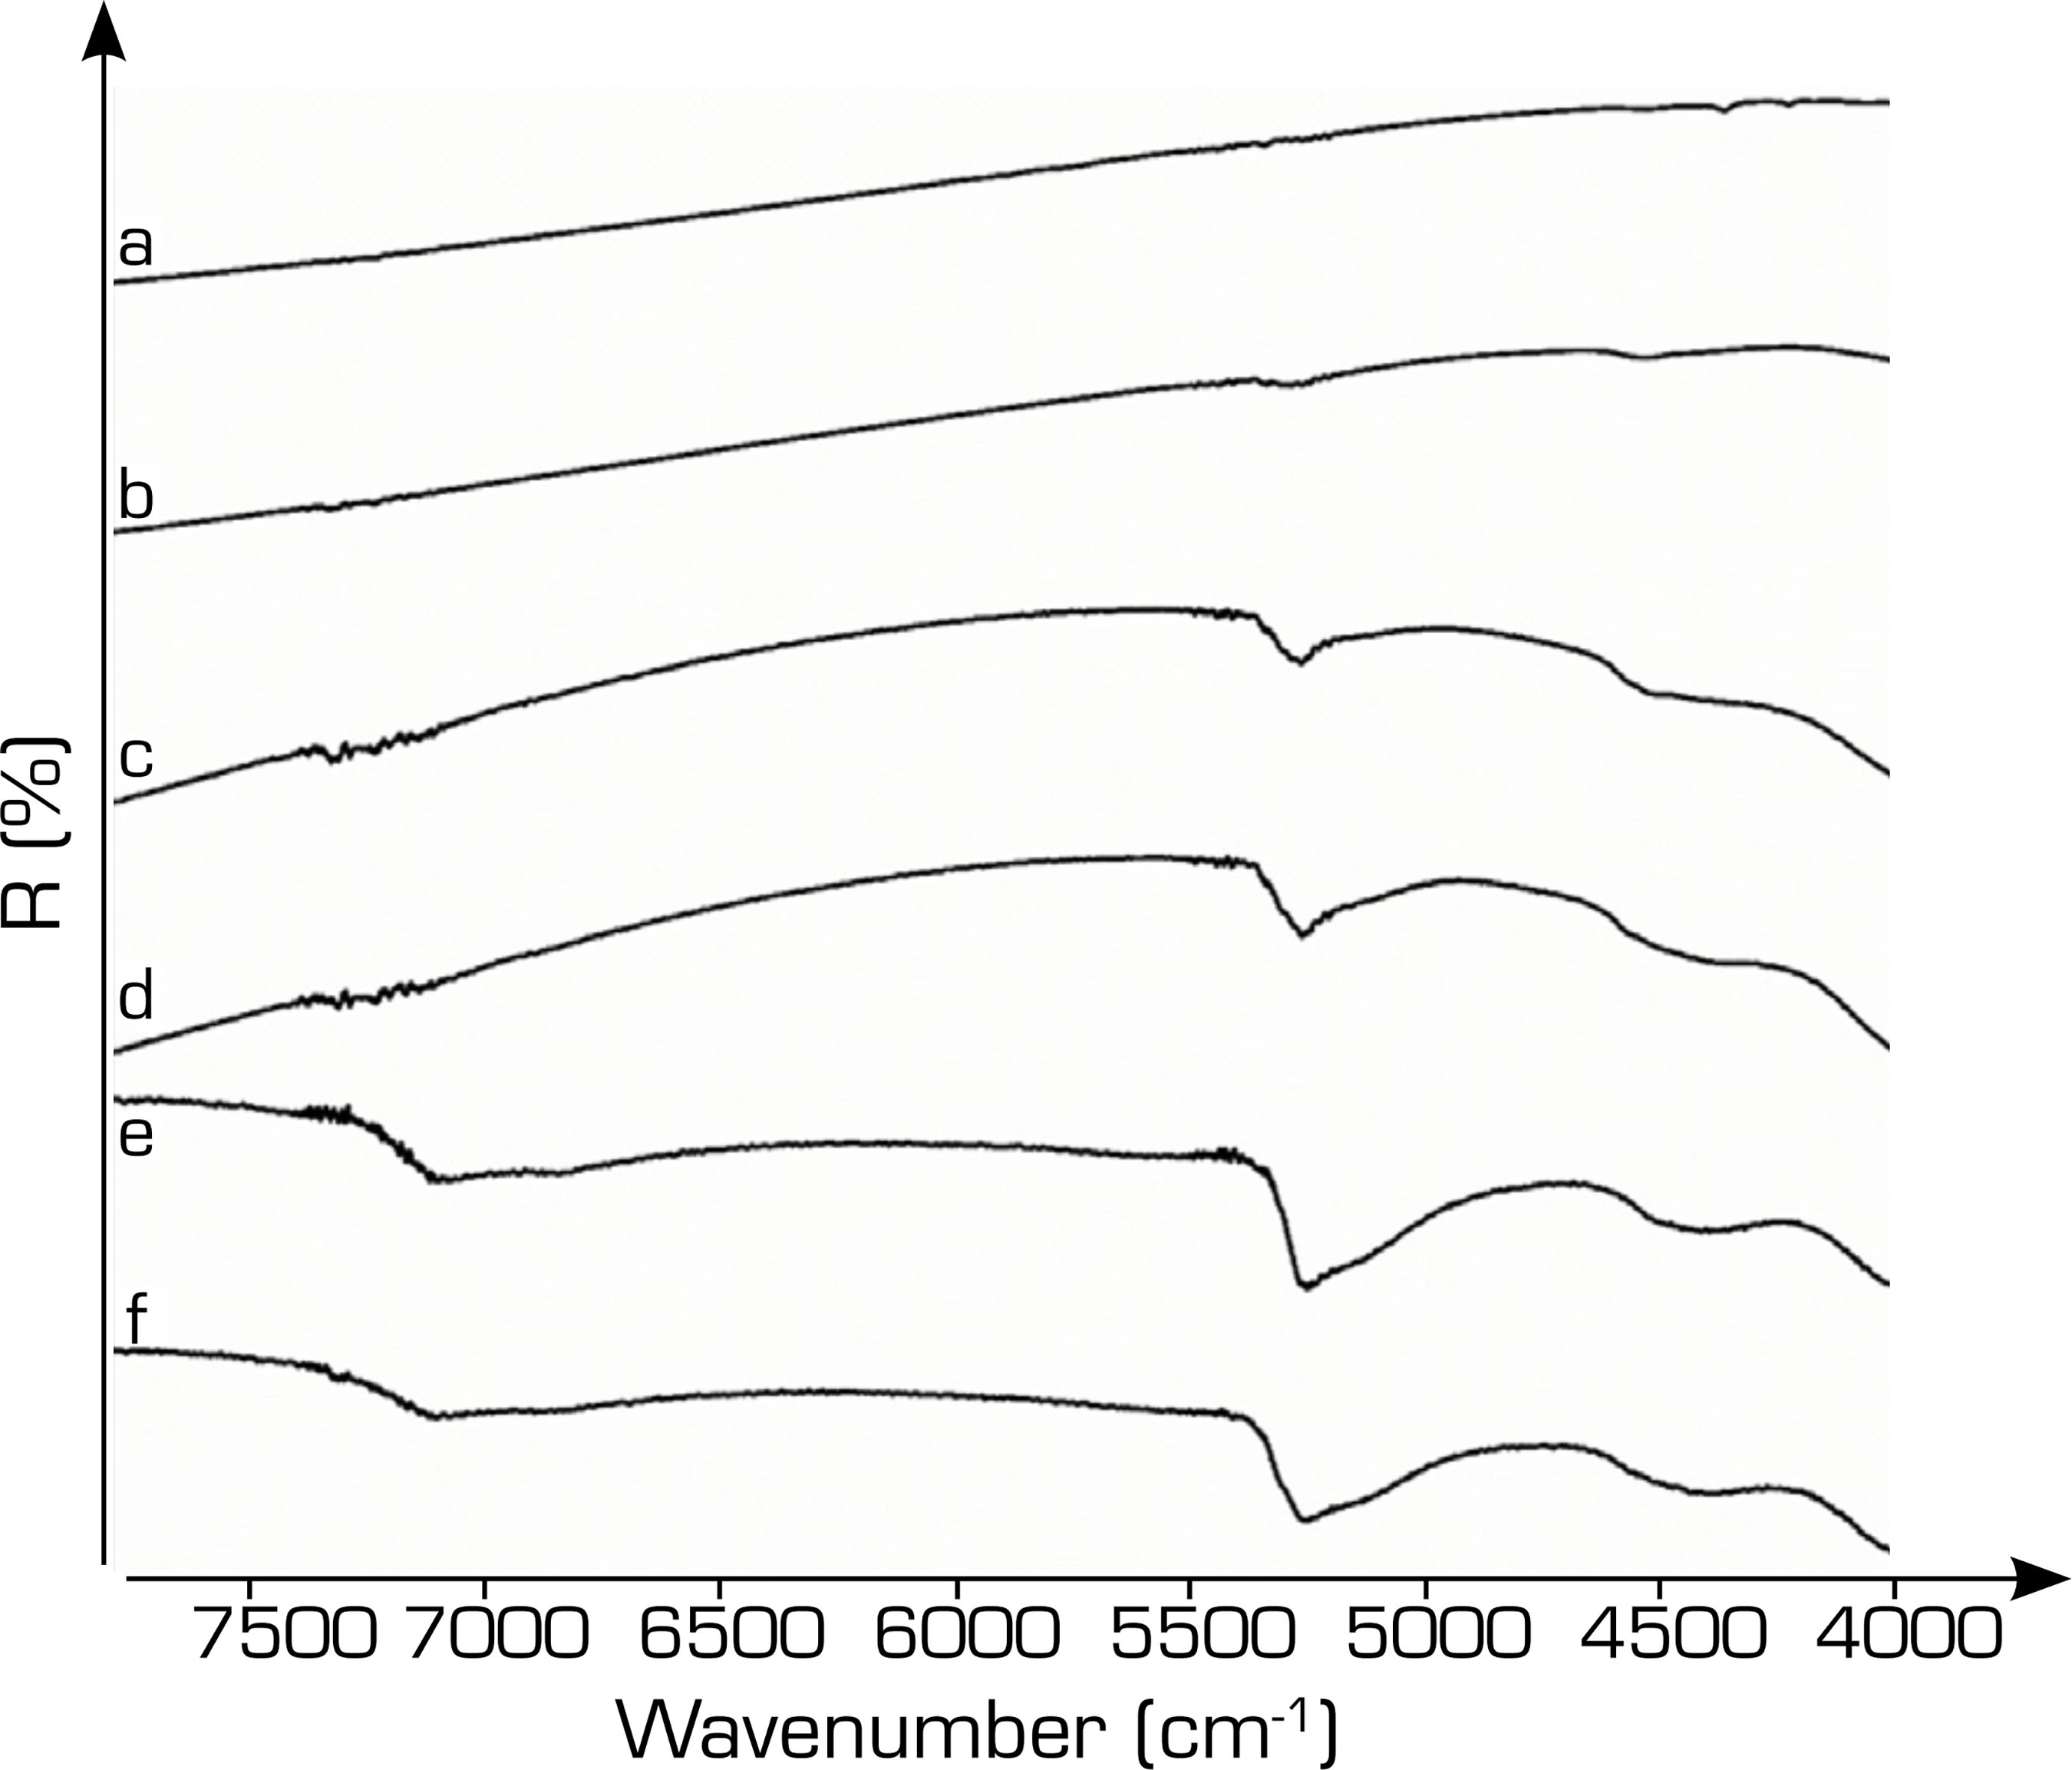
Figure 3 shows the spectra obtained by NIR/NIRA. As in the NIR/DRIFT methodology, it was observed that the absorbance height of the A5260 and A4540 bands indicates a tendency to vary according to the SSA value of the samples, which suggests that they can probably be tested quantitatively.

NIR/NIRA spectra of silica samples: a = Sample A – 170 m2·g-1; b = Sample B – 200 m2·g-1; c = Sample C – 230 m2·g-1 d = test sample 1; e = Sample D – 700 m2·g-1; f = Sample E – 800 m2·g-1.
As in Fig. 1, the spectrum of test sample 1 was included in Fig. 3 for the evaluation and subsequent comparison of the intensity of the analytical bands 5260 and 4540 cm-1. The semi-quantitative comparison provides an indication of which absorbance value relative to the test sample would be closest and would correspond to which SSA value. By analyzing Fig. 3, it is also noticeable that the SSA value of test sample 1 is between 700 and 800 m2·g-1.
It was again observed, using the same calculation methodology, that the band at 5260 cm-1 was the most suitable for determining SSA in silica samples, as it more clearly reflected the variation in band height (intensity) with the increase in nominal SSA value. Although both bands (5260 and 4540 cm-1) yielded the same methodology error (4%), which was relatively close to that found in DRIFT particle size measurements (3%) (Magalhães et al. 2022), the absorption at 4540 cm-1 showed deviations, i.e., quantification limits for higher SSA values starting at 230 m2·g-1. Thus, the band at 5260 cm-1 was initially selected for SSA determination. Figure 4 shows the NIR/NIRA calibration curve plotted of A5260 versus SSA (Eq. 2). The calibration curve exhibited a linearity trend, with the coefficient of determination indicating that 87% of the data were explained by the NIR/NIRA methodology developed for the analyzed SSA range (170-800 m2·g-1).
where y represents the median value of A5260, and x corresponds to the SSA value of the silica samples measured by the BET method.
Considering that: a) the band at 4540 cm-1 presented a more measurable height (intensity) in the NIR/NIRA methodology (Fig. 3) than in the NIR/DRIFT methodology (Fig. 1); b) the band at 5260 cm-1 presented a more adequate R2 value in the NIR/NIRA methodology (87%) than in the NIR/DRIFT methodology (77%); and c) the band at 4540 cm-1 in the NIR/NIRA methodology exhibited lower error (4%) compared with the NIR/DRIFT methodology (9%), it was assumed that the relative band formed by the two bands, A5260/A4540, would present improved linearity. The use of relative bands in NIRA analyses minimizes intensity variation in reflection/reflectance processes, and this approach has also been reported in silica particle size determination studies (Magalhães et al. 2022).

The data obtained from the application of the A5260/A4540 relative band are presented in Table 2 and resulted in an error of 2%, which is within the accuracy limits of the equipment under ideal analysis conditions. The use of the relative band improved the linearity of the calibration curve, as shown in Fig. 5. Equation 3 represents the dataset, which yielded in R2 = 0.91, indicating that 91% of the data were explained by the NIR/NIRA methodology using the A5260/A4540 relative band. These results demonstrate that the use of the relative band is more suitable for determining the SSA of silica samples in the range of 170-800 m2·g-1 than using a single band.

where y represents the median value of A5260/A4540, and x corresponds to the SSA value of the silica samples measured by the BET method.
As the use of the relative band yielded better results, the accuracy of the FT-NIR/NIRA methodology (A5260/A4540) was verified through the analysis of a sample with an unknown SSA value, designated as “Test 1”. Table 3 presents the NIR/NIRA results.
The data obtained from the analysis of the Test 1 sample indicated an SSA of 758 m2·g-1 and a methodological error considered low (less than 1%). This confirms the strong and adequate intensity of the analytical band of the Test 1 sample at 5260 cm-1, as shown in Fig. 3d. The intensity value of band A5260 corresponds approximately to the height value reported in Table 3 (second column), i.e., a median of 0.180 for Test 1 sample. This value was very close to the median value of 0.183 found for sample D (Table 2), which has a nominal SSA value of 700 m2·g-1. Furthermore, the value obtained from the relative band A5260/A4540 for the test sample was 3.660 (Table 3), which is an intermediate value between samples D and E (Table 2), indicating an SSA result between 700 and 800 m2·g-1. These results are within the acceptable error margin for specification ranges normally used in industry.
In addition, a good agreement (R2 = 91%) was observed between the SSA values obtained by the FT-IR and BET methodologies (Fig. 6, Eq. 4 with FT-IR data obtained by Eq. 3), consistent with previous literature reports (Christy 2008; McCool et al. 2006).

Relationship between the SSA values obtained by the two studied analytical techniques: FT-IR/NIR/NIRA (A5260/A4540) and gas adsorption (BET).
where y represents the SSA obtained by the FT-IR methodology, and x corresponds to the SSA value of the silica samples measured by the BET method.
Deviations may occur at low SSA values, particularly in the FT-IR methodology, likely because it responds more effectively to more extended surfaces (smaller particle sizes), which provide a greater number of available sites for interaction with molecules, resulting in higher absorbance and facilitating measurement. This behavior is consistent with that observed by Magalhães et al. (2022) in particle size determination, where more accurate results were obtained for smaller particle sizes.
On the other hand, the calculation of surface area by the BET method, used as a reference in this study but without the experimental conditions provided by the silica supplier, depends on several parameters, such as the type of gas used, the affinity of the analyzed surface for this gas, pressure, and the constant (C) related to the energy of the adsorbed monolayer. Therefore, multiple factors must be properly controlled, as inadequate control may lead to deviations. For example, according to Thommes et al. (2015), C values ≤ 50 indicate that the monolayer is not well defined, which compromises the accuracy of SSA determination.
In any case, it is considered good practice to report the method used for SSA determination, since discrepancies among techniques can lead to variations in the measured values, as observed between the results obtained by laser diffraction and BET in the study by Gómez-Tena et al. (2014).
The comparison of the analytical conditions and methodological errors of this study with those reported in the literature shows that the NIR/NIRA analysis using the relative band A5260/A4540 yielded better results (methodological error of 2%) for the determination of the SSA of silica samples (170-800 m2·g-1). McCool et al. (2006) determined the SSA of silica samples (90-900 m2·g-1) by infrared spectroscopy in the MIR region using conventional methods such as transmission mode and absorbance-area measurements, obtaining higher errors (4-7%). Christy (2008) employed NIR transflectance and chemometrics, which requires additional processing steps, to estimate SSA values between 300 and 750 m2·g-1, also reporting higher methodological errors (2.5-9%).
It should be emphasized that the development of faster and more precise methodologies, such as the FT-NIR/NIRA approach presented in this study, is particularly relevant for the determination of silica SSA in quality control processes for advanced materials, especially in the aerospace sector. The results obtained, demonstrating low methodological error and reduced analysis time, reinforce the potential of this technique as a practical alternative to conventional methods.
The SSA of silica plays a key role in defining its interaction with polymers and other components in high-performance composites. In this context, SSA is a critical parameter for material performance, particularly in applications involving surface treatments designed to withstand extreme conditions. Accurate SSA determination contributes to optimizing the adhesion of thermal protection systems and improving combustion efficiency through the use of high surface area materials, highlighting the practical implications of the methodology proposed in this work.
CONCLUSION
This study aimed to develop an FT-IR reflectance methodology in the NIR region for determining the SSA of silica samples with lower methodological errors and shorter analysis time. The results demonstrate that the NIR/NIRA approach using the relative band A5260/A4540 provides a robust and reliable methodology for estimating the SSA of silica samples in the range of 170-800 m2·g-1, achieving an error within the precision limit of the FT-IR spectrometer (2%).
Beyond its analytical performance, this methodology stands out for its simplicity, reduced operational cost, and adaptability to laboratories with different levels of instrumentation. It enables rapid and precise SSA determination without requiring gas adsorption systems, offering a practical alternative to the conventional BET technique.
A particularly relevant contribution of this work is the application of the NIR region to quantitative surface analysis, an area that remains less explored than the MIR range. By demonstrating the feasibility and accuracy of NIR reflectance for this purpose, the study expands the use of infrared spectroscopy in materials characterization, providing a new and efficient route for surface area determination in both academic and industrial contexts.
Therefore, the proposed methodology not only fulfills the initial objective of reducing analysis time and improving precision but also contributes to the advancement of analytical approaches in materials research, reinforcing the potential of NIR spectroscopy as a quantitative tool for surface studies. In addition, it emerges as an alternative technique for aerospace processes that require rapid methodologies to meet short project timelines, while maintaining precision comparable to that of conventional gas adsorption techniques.
ACKNOWLEDGEMENTS
Not applicable.
-
DECLARATION OF USE OF ARTIFICIAL INTELLIGENCE TOOLS
The artificial intelligence (AI) tool ChatGPT was used solely to support language refinement. No AI tool was involved in the conceptualization, methodology, data analysis, or interpretation of results.
-
FUNDING
Coordenação de Aperfeiçoamento de Pessoal de Nível SuperiorFinance Code 001Conselho Nacional de Desenvolvimento Científico e TecnológicoGrant No: 301626/2022-7
-
Peer Review History:
Single Blind Peer Review.
DATA AVAILABILITY STATEMENT
All data sets were generated or analyzed in the current study.
REFERENCES
-
Acevedo NIA, Rocha MCG, Bertolino LC (2021) Determinação da área superficial específica e da porosidade de duas amostras de argilas provenientes da bacia de Taubaté - São Paulo. Braz Appl Sci Rev 5(1):39-57. https://doi.org/10.34115/basrv5n1-004
» https://doi.org/10.34115/basrv5n1-004 -
Bar G, Amar L, Marszewski M, Bolker A, Dashti A, Dror R, Pilon L (2023) Synthesis of silica aerogel films in liquid molds. J Colloid Interface Sci 648:418-426. https://doi.org/10.1016/j.jcis.2023.06.004
» https://doi.org/10.1016/j.jcis.2023.06.004 -
Barros AH, Magalhães RF, Murakami LMS, Diniz MF, Sanches NB, Carvalho TA, Dutra JCN, Dutra RCL (2025) Determination of elastomer content in NR/SBR/BR blends. Polimeros 35(2):e20250023. https://doi.org/10.1590/0104-1428.20240110
» https://doi.org/10.1590/0104-1428.20240110 -
Carvalho TA, Barros AH, Magalhães RF, Diniz MF, Murakami LMS, Dutra JCN, Sanches NB, Dutra RCL(2025) Quantification of elastomers in CR/NR/BR blends. Polimeros 35(3):e20250026. https://doi.org/10.1590/0104-1428.20240130
» https://doi.org/10.1590/0104-1428.20240130 -
Chen Y, Lin M, Cai L (2025) Measurement of specific surface area of silica gel using a paper-based microscale laboratory. J Chem Educ 102:957-961. https://doi.org/10.1021/acs.jchemed.4c01355
» https://doi.org/10.1021/acs.jchemed.4c01355 -
Christy AA (2008) Quantitative determination of surface area of silica gel particles by near-infrared spectroscopy and chemometrics. Colloids Surf A Physicochem Eng Asp 322:248-252. https://doi.org/10.1016/j.colsurfa.2008.03.021
» https://doi.org/10.1016/j.colsurfa.2008.03.021 -
Domínguez JMA, Ramaye Y, Dabrio M, Kestens V (2020) Validation of a homogeneous incremental centrifugal liquid sedimentation method for size analysis of silica (nano)particles. Materials (Basel) 13(17):3806. https://doi.org/10.3390/ma13173806
» https://doi.org/10.3390/ma13173806 -
Elashker A, Zaghloul B, Eldakhakhny AM, Gobara M, Mokhtar M (2024) Study of thermal protection materials in solid propellant rocket engines. ASAT J 20:202403. [accessed Mar 15 2025]. https://www.researchgate.net/publication/378862930_Study_of_thermal_protection_materials_in_solid_propellant_rocket_engines
» https://www.researchgate.net/publication/378862930_Study_of_thermal_protection_materials_in_solid_propellant_rocket_engines -
Ferraresi TM, Silva WTL, Martin-Neto L, Silveira PM, Madari BE (2012) Espectroscopia de infravermelho na determinação da textura do solo. Rev Bras Cienc Solo 36:1769-1777. https://doi.org/10.1590/S0100-06832012000600010
» https://doi.org/10.1590/S0100-06832012000600010 -
Fiedler R, Beizinger B, Walther P, Lindén M (2022) Synthesis of highly monodisperse superparamagnetic iron oxide core@mesoporous silica shell particles with independently tunable size and porosity. Microporous Mesoporous Mater 340:112027. https://doi.org/10.1016/j.micromeso.2022.112027
» https://doi.org/10.1016/j.micromeso.2022.112027 - Goddu RF (1960) Near-infrared spectrophotometry. Adv Anal Chem Instr 1:347-424.
-
Gómez-Tena MP, Gilabert J, Toledo J, Zumaqueri E, Machi C (2014) Relationship between the specific surface area parameters determined using different analytical techniques. Paper presented 2014 XII Foro Global del Recubrimiento Cerámico. Cámara Oficial de Comercio, Industria y Navegación de Castellón; Castellón, Spain. [accessed Mar 10 2025]. https://www.qualicer.org/recopilatorio/ponencias/pdfs/56%20POSTER%20ING.pdf
» https://www.qualicer.org/recopilatorio/ponencias/pdfs/56%20POSTER%20ING.pdf -
Harris S (2025) Thermal protection systems for reusable spacecraft: materials and performance. Am J Aerosp Aeronaut Eng 6(1):6-10. [accessed Aug 20 2025]. https://australiansciencejournals.com/ajaae
» https://australiansciencejournals.com/ajaae - Horák MA, Vítek A (1978) Interpretation and processing of vibrational spectra. New York: Wiley.
-
Kestens V, Roebben G, Herrmann J, Jämting Å, Coleman V, Minelli C, Clifford C, De Temmerman PJ, Mast J, Liu JJ (2016) Challenges in the size analysis of a silica nanoparticle mixture as candidate certified reference material. J Nanopart Res 18(6):161. https://doi.org/10.1007/s11051-016-3474-2
» https://doi.org/10.1007/s11051-016-3474-2 - Magalhães RF (2023) Avaliação de técnicas FT-IR de transmissão, reflexão e refletância para a caracterização/quantificação de polímeros e carga de diferentes setores industriais [doctoral dissertation]. São José dos Campos: Instituto Tecnológico de Aeronáutica. In Portuguese.
-
Magalhães RF, Barros AH, Takematsu MM, Passero A, Diniz MF, Sciamareli J, Dutra RCL (2022) Infrared reflectance techniques applied to silica particle diameter determination: theoretical and experimental data. An Acad Bras Cienc 94:e20210545. [accessed Mar 05 2025]. https://pubmed.ncbi.nlm.nih.gov/36259823/
» https://pubmed.ncbi.nlm.nih.gov/36259823/ -
McCool B, Murphy L, Tripp CP (2006) A simple FTIR technique for estimating the surface area of silica powders and films. J Colloid Interface Sci 295:294-298. https://doi.org/10.1016/j.jcis.2005.08.010
» https://doi.org/10.1016/j.jcis.2005.08.010 -
Moretto E, Stoffels C, Federico CE, Rogé V, Staropoli M, Imiete IE, Audinot JN, Steiner P, Duez B, Lenoble D, et al. (2023) Interplay of regio-selectively modified dendritic silica particles with styrene-butadiene rubber: the route towards better tires with lower rolling resistance and higher grip. Chem Eng J 461:141964. https://doi.org/10.1016/j.cej.2023.141964
» https://doi.org/10.1016/j.cej.2023.141964 -
Okoli U, Rishi K, Beaucage G, Kammler HK, McGlasson A, Chauby M, Kuppa VK (2023) Dispersion of modified fumed silica in elastomeric nanocomposites. Polymer (Guildf) 264:125407. https://doi.org/10.1016/j.polymer.2022.125407
» https://doi.org/10.1016/j.polymer.2022.125407 -
Osswald J, Fehr KT (2006) FTIR spectroscopic study on liquid silica solutions and nanoscale particle size determination. J Mater Sci 41(5):1335-1339. https://doi.org/10.1007/s10853-006-7327-8
» https://doi.org/10.1007/s10853-006-7327-8 -
Padmanathan HR, Federico CE, Addiego F, Rommel R, Kotecký O, Westermann S, Fleming Y (2021) Influence of silica specific surface area on the viscoelastic and fatigue behaviors of silica-filled SBR composites. Polymers 13:3094. https://doi.org/10.3390/polym13183094
» https://doi.org/10.3390/polym13183094 -
Pavia DL, Lampman GM, Kriz GS (2015) Introduction to spectroscopy. 5th ed. Stamford: Cengage Learning. [accessed Jan 10 2025]. https://dl.iranchembook.ir/ebook/organic-chemistry-2753.pdf
» https://dl.iranchembook.ir/ebook/organic-chemistry-2753.pdf -
Ramos DM, Sadtler V, Marchal P, Lemaitre C, Benyahia L, Roques-Carmes T (2023) Properties of non-conventional direct O/W Pickering emulsions stabilized by partially hydrophobic silica particles controlled by rotor-stator or ultrasonic emulsification. Colloids Surf A Physicochem Eng Asp 673:131782. https://doi.org/10.1016/j.colsurfa.2023.131782
» https://doi.org/10.1016/j.colsurfa.2023.131782 -
Schadosin J, Saab SC, Brinatti AM, Pires LF (2023) Quantitative and qualitative characterization of the granulometry of an Inceptisol. Quim Nova 46:329-335. https://doi.org/10.21577/0100-4042.20230018
» https://doi.org/10.21577/0100-4042.20230018 -
Sharma J, Polizos G (2020) Hollow silica particles: recent progress and future perspectives. Nanomaterials (Basel) 10(8):1599. https://doi.org/10.3390/nano10081599
» https://doi.org/10.3390/nano10081599 -
Silverstein RM, Webster FX, Kiemle DJ (2005) Spectrometric identification of organic compounds. 7th ed. Hoboken: John Wiley & Sons. [accessed Feb 15 2025]. https://eclass.upatras.gr/modules/document/file.php/PHY1973/Silverstein%20-%20Spectrometric%20Identification%20of%20Organic%20Compounds%207th%20ed.pdf
» https://eclass.upatras.gr/modules/document/file.php/PHY1973/Silverstein%20-%20Spectrometric%20Identification%20of%20Organic%20Compounds%207th%20ed.pdf - Smith AL, editor (1979) Applied infrared spectroscopy: fundamentals, techniques and analytical problem-solving. New York: John Wiley & Sons.
-
Sowinska-Baranowska A, Maciejewska M (2021) Influence of the silica specific surface area and ionic liquids on the curing characteristics and performance of styrene-butadiene rubber. Materials 14:5302. https://doi.org/10.3390/ma14185302
» https://doi.org/10.3390/ma14185302 -
Stach R, Barone T, Cauda E, Krebs P, Pejcic B, Daboss S, Mizaikoff B (2020) Direct infrared spectroscopy for size-independent identification and quantification of respirable particles relative mass in mine dusts. Anal Bioanal Chem 412(14):3499-3508. https://doi.org/10.1007/s00216-020-02565-0
» https://doi.org/10.1007/s00216-020-02565-0 -
Thommes M, Kaneko K, Neimark AV, Olivier JP, Rodriguez-Reinoso F, Rouquerol J, Sing KSW (2015) Physisorption of gases, with special reference to the evaluation of surface area and pore size distribution (IUPAC Technical Report). Pure Appl Chem 87(9-10):1051-1069. https://doi.org/10.1515/pac-2014-1117
» https://doi.org/10.1515/pac-2014-1117 -
Uniyal P, Gaur P, Yadav J, Bhalla NA, Khan T, Junaedi H, Sebaey TA (2025) A comprehensive review on the role of nanosilica as a toughening agent for enhanced epoxy composites for aerospace applications. ACS Omega 10:15810-15839. https://doi.org/10.1021/acsomega.4c10073
» https://doi.org/10.1021/acsomega.4c10073 -
Yassin FM, Fathy MM, Fahmy HM, Elshemy WM (2021) Low-angle X-ray scattering for determining the size of mesoporous silica nanoparticles. Radiat Phys Chem 179:109235. https://doi.org/10.1016/j.radphyschem.2020.109235
» https://doi.org/10.1016/j.radphyschem.2020.109235
Edited by
-
Section editor:
Cristina Andrade http://orcid.org/0000-0003-1563-755X

 Source: Elaborated by the author.
 Source: Elaborated by the author.
 Source: Elaborated by the author.
 Source: Elaborated by the author.
 Source: Elaborated by the author.
 Source: Elaborated by the author.