Abstracts
This paper provides a comparative study of different photochemical oxidation processes and a detailed characterization of the by-products of diesel oil degradation performed using comprehensive two-dimensional gas chromatography coupled to time-of-flight mass spectrometry (GC×GC-TOFMS). Diesel degradation was conducted in a photolytic reactor using UV, H2O2, UV/H2O2, O3 or O3/UV. The best conditions for each process were obtained applying multivariate analysis and the experimental results indicated that the O3/UV process was the most feasible for the treatment of wastewater containing diesel fuel, with a degradation percentage of > 90%. Almost complete degradation of the aromatics was achieved. Phenolic compounds were identified as by-products of the diesel samples treated with the UV, H2O2, O3 and O3/UV processes. Besides the phenolic compounds, other by-products identified included carboxylic acids and ethers in the UV/peroxide treatment, ethers in the UV irradiation treatment and ketones in the ozone treatment.
GC×GC; diesel oil; degradation; by-products; comprehensive two-dimensional gas chromatography
Este trabalho apresenta um estudo comparativo de diferentes processos de oxidação fotoquímica e uma detalhada caracterização dos subprodutos da degradação de óleo diesel utilizando cromatografia gasosa bidimensional abrangente acoplada à espectrometria de massas por tempo de voo (GC×GC-TOFMS). A degradação de óleo diesel foi realizada em um reator fotolítico usando UV, H2O2, UV/H2O2, O3 ou O3/UV. As melhores condições para cada processo foram otimizadas por análise multivariada e os resultados experimentais indicaram que o processo O3/UV foi o mais viável para o tratamento de efluentes contendo óleo diesel, com uma porcentagem de degradação maior que 90%. A degradação quase completa dos compostos aromáticos foi alcançada. Compostos fenólicos foram identificados como subprodutos das amostras de óleo diesel tratadas com os processos UV, H2O2, O3 e O3/UV. Além desses compostos, outros subprodutos identificados incluem ácidos carboxílicos e éteres no tratamento com UV/peróxido, éteres no tratamento com radiação UV e cetonas no tratamento com ozônio.
ARTICLE
Photochemical degradation of diesel oil in water: a comparative study of different photochemical oxidation processes and their degradation by-products
Morgana FrenaI,* * e-mail: morganafrena@hotmail.com; morganafrena09@gmail.com ; Cristiane R. OliveiraII,III; Cesar A. da SilvaI; Luiz A. S. MadureiraI; Débora A. AzevedoII
IUniversidade Federal de Santa Catarina, Departamento de Química, Campus Universitário Trindade, Florianópolis, 88040-900 Santa Catarina-SC, Brazil
IIUniversidade Federal do Rio de Janeiro, Instituto de Química, Ilha do Fundão, 21941-909 Rio de Janeiro-RJ, Brazil
IIICenpes/Petrobras, 21941-915 Rio de Janeiro-RJ, Brazil
ABSTRACT
This paper provides a comparative study of different photochemical oxidation processes and a detailed characterization of the by-products of diesel oil degradation performed using comprehensive two-dimensional gas chromatography coupled to time-of-flight mass spectrometry (GC×GC-TOFMS). Diesel degradation was conducted in a photolytic reactor using UV, H2O2, UV/H2O2, O3 or O3/UV. The best conditions for each process were obtained applying multivariate analysis and the experimental results indicated that the O3/UV process was the most feasible for the treatment of wastewater containing diesel fuel, with a degradation percentage of > 90%. Almost complete degradation of the aromatics was achieved. Phenolic compounds were identified as by-products of the diesel samples treated with the UV, H2O2, O3 and O3/UV processes. Besides the phenolic compounds, other by-products identified included carboxylic acids and ethers in the UV/peroxide treatment, ethers in the UV irradiation treatment and ketones in the ozone treatment.
Keywords: GC×GC, diesel oil, degradation, by-products, comprehensive two-dimensional gas chromatography
RESUMO
Este trabalho apresenta um estudo comparativo de diferentes processos de oxidação fotoquímica e uma detalhada caracterização dos subprodutos da degradação de óleo diesel utilizando cromatografia gasosa bidimensional abrangente acoplada à espectrometria de massas por tempo de voo (GC×GC-TOFMS). A degradação de óleo diesel foi realizada em um reator fotolítico usando UV, H2O2, UV/H2O2, O3 ou O3/UV. As melhores condições para cada processo foram otimizadas por análise multivariada e os resultados experimentais indicaram que o processo O3/UV foi o mais viável para o tratamento de efluentes contendo óleo diesel, com uma porcentagem de degradação maior que 90%. A degradação quase completa dos compostos aromáticos foi alcançada. Compostos fenólicos foram identificados como subprodutos das amostras de óleo diesel tratadas com os processos UV, H2O2, O3 e O3/UV. Além desses compostos, outros subprodutos identificados incluem ácidos carboxílicos e éteres no tratamento com UV/peróxido, éteres no tratamento com radiação UV e cetonas no tratamento com ozônio.
Introduction
Petroleum pollutants and their derivatives are discharged daily into the environment as a consequence of several processes, such as the extraction, exploration and transportation of these products.1 Due to the high demand for diesel, it is important to develop studies on the oxidative processes which lead to its degradation in the environment. Of these processes, photooxidation is a potentially significant technique for the degradation of crude oil.2 Pollutant destruction and the consequent reduction in the generation of toxic residues are the main advantages of this technology.3 Furthermore, photochemical processes may also be important in relation to the subsequent biological consumption of oil in treatment procedures.4
Diesel oils are sometimes refractory and resistant to degradation by available effluent treatment technologies involving biological processes.5 In this regard, saturated compounds are more resistant, while aromatic compounds are susceptible to photooxidation.2 Also, according to Stepnowski et al.,6 the toxicity of the aromatics is higher than that of the aliphatic fraction.
Photooxidation has been extensively applied in petroleum degradation.2,7-10 Advanced oxidation processes are based on the enhanced formation of hydroxyl radicals,11 which are highly reactive and able to react with practically all classes of organic compounds,12 resulting in complete mineralization of these compounds or their conversion into less aggressive products.11 Hydrogen peroxide, for example, is a strong oxidant usually applied, among other purposes, to reduce the levels of pollutants present in wastewater. However, the use of H2O2 alone is not efficient in oxidizing more complex and recalcitrant materials. The use of H2O2 becomes more effective when it acts in conjunction with energy sources capable of dissociating it to generate hydroxyl radicals.3 Ozone is widely used as an oxidant and disinfectant in water treatment. Transformation of organic compounds occurs via direct reaction with O3 or with hydroxyl radicals, resulting from ozone decay in water.13 The O3/UV process is more complex than the previously described technique, since hydroxyl radicals are produced through different reaction pathways.14,15
Due to the complexity of diesel oil and other petrochemical products, analytical techniques with better separation capacity and higher resolution power are required. In this context, comprehensive two-dimensional gas chromatography is a potentially useful technique because of its improved resolution and enhanced sensitivity.16 Impressive results have been obtained in terms of separation efficiency and also compound classification based on the structured chromatograms obtained by GC×GC, which greatly facilitate group-type analysis.17-19 GC×GC has been extensively applied to petrochemical matrices, since these samples are amongst the most complex multi-class samples known to analytical chemists.20-23 von Mühlen et al.24 applied GC×GC to the characterization of petrochemical and related samples. Wang et al. 25 studied diesel composition by GC-MS and compared this technique with GC×GC. Gaines et al.26 used GC×GC to identify sources of oil spills for the first time. According to D'Auria et al.,8 analysis of crude oil treated under UV irradiation showed that the n-alkanes are little affected, while the majority of the aromatic hydrocarbons were converted to resins or polar molecules.
The information obtained on the chemical composition of the by-products can be used to determine the most appropriate technology for the cost-effective treatment of diesel in aquatic environments. In this study, the GC×GC-TOFMS technique was employed to characterize the by-products.
In previous studies on diesel oils, different compound classes have been identified, such as saturated hydrocarbons, mono and polyaromatics (including naphthalene, phenanthrene, fluorene, pyrene, their alkyl-derivatives and chrysene) and sulfur-containing (benzothiophenes and dibenzothiophenes) and nitrogen-containing (indoles and carbazoles) compounds.25,27-30 Despite the high abundance of aliphatic hydrocarbons, this study focused on the aromatic compounds due to their higher susceptibility to degradation, being converted into other compounds. Furthermore, polycyclic aromatic hydrocarbons (PAH) are a class of persistent organic pollutants of special concern, since some of them are carcinogenic and mutagenic.31
The objective of this study was to investigate the application of five photochemical oxidation processes: direct photolysis (UV), peroxide (H2O2), UV/H2O2, ozonation (O3) and O3/UV for the treatment of waters contaminated by diesel oil and also to obtain a detailed characterization of the by-products of diesel oil degradation.
Experimental
Sampling and sample preparation
Commercial diesel oil obtained from a fuel station was used for this study. The photodegradation experiments were carried out in a thermostated photolytic reactor containing 200 mL of a 100 mg L-1 solution of diesel oil in high purity distilled and deionized water (Milli-Q-Millipore, Bedford, MA, USA). The photoreactor system consisted of a 500 mL cylindrical glass body. A 13 W germicidal low pressure mercury vapor lamp able to produce UV at 253.7 nm, surrounded with a quartz jacket, was located in the center of the reactor. The reactor walls were covered with aluminum foil to avoid the release of the radiation. The reaction mixture inside the reactor was maintained by magnetic stirring and the temperature was kept at 25 ± 1 ºC. All degradation conditions were optimized in our laboratory.
Method optimization
In order to select the optimum experimental conditions for the degradation, a multivariate optimization strategy using a central composite design was applied. The central composite design consisted of 2k+2k+n runs, where k is the number of factors, 2k is the number of factorial points at the corners of the cube, 2k is the number of axial points on the axis of each design factor at a distance of ±α (α = 2k/4 = 1.68179 for k = 3) from the center of the cube, and n is the number of replications of the center points at the center of the cube. The factors included were: diesel-in-water emulsion (13 to 100 mg L-1; ultrassonicated during two intervals of 30 minutes), peroxide concentration (62.5 to 987.5 mg L-1), pH (2 to 12) and oxygen flow for ozone generation (1.3 to 4.7 mL min-1). Five levels of each variable were studied, including a triplicate center point. Method optimization was carried out in five steps, one step for each oxidative process. Blank samples were also evaluated in order to avoid losses by evaporation. Statistical procedures were performed using the Statistica 6.0® computer program (StatSoft, Tulsa, OK, USA).32
A Perkin Elmer luminescence spectrometer LS-5B (Beaconsfield, England, UK) was used to monitor the oil degradation in aqueous solution during the optimization of the oxidative processes. Emission wavelength at 329 nm was monitored, with excitation at 265 nm. Readings were taken every five minutes during the ozone oxidative processes and at intervals of fifteen minutes during the other processes, due to the fast degradation of the ozone process.
After the degradation procedure, each sample was extracted three times with 10 mL of dichloromethane, concentrated to 1 mL by solvent evaporation under nitrogen flow and injected into the gas chromatograph.
Instrumentation and chromatographic conditions
Chromatographic analysis was first performed by GC-MS using a Thermo Finnigan model Trace GC Ultra GC interfaced to a Thermo Finnigan Polaris Q (ion trap mass analyzer) operated in full scan mode (50 to 500 Dalton). A Restek RTX-5MS (Restek, Bellefonte, PA, USA), 5%-phenyl-95%-methylpolysiloxane capillary column (30 m × 0.25 mm i.d. × 0.25 µm df) was used under the following conditions: helium as the carrier gas, splitless mode (1 min) and temperature program with heating from 50 ºC (5 min) then ramping at 5 ºC min-1 to 300 ºC, which was held for 20 min. The transfer line temperature was 280 ºC and ion source 200 ºC, and the electron ionization mode (70 eV) was used.
The GC×GC analysis was carried out on a Pegasus 4D (Leco, St. Joseph, MI, USA) GC×GC-TOFMS, composed of an Agilent Technologies 6890 GC (Palo Alto, CA, USA) equipped with a secondary oven, a non-moving quad-jet dual-stage modulator and a Pegasus III (Leco, St. Joseph, MI, USA) time-of-flight mass spectrometer. The GC column set consisted of an HP5, 5%-phenyl-95%-methylpolysiloxane (30 m × 0.25 mm i.d. × 0.25 µm df), as the first dimension (1D) column and a BPX50 (Austin, Texas, USA), 50%-phenyl-50%-methylpolysiloxane (1.5 m × 0.1 mm i.d. × 0.1 µm df), as the second dimension (2D) column. The second column was connected to the TOFMS through an uncoated deactivated silica tube (0.5 m × 0.25 mm i.d.). The columns and the uncoated deactivated silica tube were connected by SGE unions using SilTite metal ferrules (Austin, Texas, USA) for 0.10-0.25 mm i.d. GC columns.
The GC conditions for the first dimension included: splitless mode injection of 1 µL at 280 ºC, purge time of 60 s and purge flow of 5 mL min-1. Helium (99.9999% purity) was used as the carrier gas at a constant flow rate of 1.5 mL min-1. The primary oven temperature program was 100 ºC for 1 min, ramping at 8 ºC min-1 to 310 ºC. The secondary oven operated at a temperature 5 ºC higher than the primary one. The modulation period was 6 s with 1.5 s of hot pulse, and the modulator temperature was 15 ºC higher than the primary oven temperature. The MS transfer line was held at 280 ºC, and the TOFMS was operated in the electron ionization mode with a collected mass range of 50-600 Dalton. The ion source temperature was 230 ºC, the detector was operated at 1700 V, the applied electron energy was 70 eV and the acquisition rate was 100 spectra s-1. All conditions were based on results obtained in previous studies.21-23
Data processing
GC×GC-TOFMS data acquisition and processing were performed with ChromaTOFTM software, version 4.21 (Leco, St. Joseph, MI, USA). After the data acquisition, samples were submitted to data processing where the individual peaks were automatically detected on the basis of a 10:1 signal to noise ratio. Compound identification was performed by examination of the mass spectra, and their comparison with those in the literature (NIST Mass Spectra Library), the retention times and the elution orders. The tentative identification was based on the mass spectra similarity, with factors higher than 85%.
Results and Discussion
Method optimization
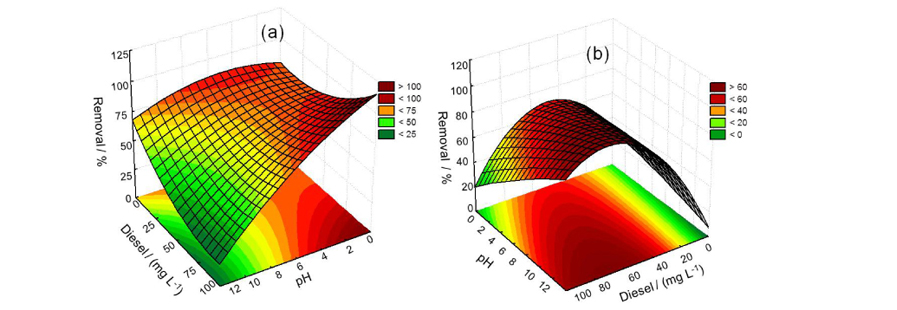
In order to determine the optimized conditions for each oxidative process, several parameters were tested, including diesel and peroxide concentrations and the pH, aiming to increase the degradation performance (Table 1). All response surfaces generated were mathematically best described by the quadratic model and the coefficients of determination (R2) were better than 0.9. This means that the statistical model can explain at least 90% of the variability in the response.
The reaction was maintained until the maximum degradation was obtained, and the reaction rate was monitored by fluorescence spectrometry until reaching a constant value. The estimation of the reaction time was based on the signal obtained by the fluorescence spectrophotometer remaining constant. The point at which the degradation process stopped was probably influenced by the amount and type of by-products generated which competed with the hydroxyl radicals, thereby decreasing the efficiency of the removal process. The best removal efficiency obtained for each process and the time of degradation shown in Table 1 are discussed in the next sections.
UV
The diesel-in-water emulsion concentration and pH were estimated for the UV photodegradation process. The response surface generated (Figure 1a) showed that at lower pH values the degradation was more efficient. Therefore, the variables set in this study were pH 2 and diesel-in-water emulsion of 100 mg L-1 under UV irradiation for 60 min.
The photodegradation of diesel oil performed under UV achieved 75% of removal after 60 min of irradiation. After 45 min an increase in fluorescence intensity at around 375 nm was observed due to the formation of transient by-products during the direct photolysis, which in 60 min are almost entirely degraded (Figure S1 (a)). These results are satisfactory, since only irradiation was employed in this process. Legrini et al.33 studied the decomposition of chlorinated hydrocarbons by UV radiation and observed that 85% tetrachloroethene and 55% trichloroethene were degraded within 60 min of irradiation time.
H2O2 and UV/H2O2
The effect of hydrogen peroxide as an oxidant was evaluated and the variables studied were pH and diesel-in-water emulsion and hydrogen peroxide concentrations. Figure 1b illustrates the response surface generated as a function of pH and diesel-in-water emulsion concentration. In this process, as shown by the statistical analysis (Figure 1c), there is an optimum region that represents the maximum degradation. This was observed because the concentration of the conjugate anion of hydrogen peroxide increases with pH, and this species enhances the production of hydroxyl radicals, increasing the degradation power.34 Hence, pH 12 and a hydrogen peroxide concentration of 987.5 mg L-1 were adopted in subsequent tests.
The lowest removal efficiency for the diesel oil in aqueous solution was observed for the peroxide process (49% after 90 min), as shown in FigureS1 (b). In this process, degradation was monitored 1 min after the addition of H2O2 to the sample, with further measurements being taken every 15 min. The poor degradation efficiency of this process was expected since previous studies had revealed that H2O2 alone is not effective in removing organic compounds.35 The results indicated that the best results for the peroxide process were achieved at higher H2O2 concentrations (987.5 mg L-1) for 100 mg L-1 of diesel-in-water emulsion.
The combination of H2O2 and the UV process can increase the rate of contaminant degradation significantly. H2O2 absorbs UV light and is broken down into OH radicals, degrading the contaminant via OH radical oxidation.36 Thus, we also performed the diesel irradiation with UV in the presence of peroxide. The reaction achieved a higher level of removal, but in a longer degradation time (95% in 105 min), as shown in Figure S1 (c). Goi and Trapido37 reported that the degradation of nitrophenols is markedly accelerated by adding hydrogen peroxide to the treatment with UV radiation. Also, Benitez et al.38 observed a considerable improvement on combining hydrogen peroxide with UV light, compared to the simple photodegradation of carbofurans. Sundstrom et al.39 investigated the removal efficiency of UV/H2O2 for a variety of aliphatic and aromatic compounds and found that the degradation rate increased with increasing hydrogen peroxide concentration and UV light intensity and that the degradation was highly dependent on the chemical structure of the substrates. Xu et al.40 studied the degradation of diethyl phthalate with UV/H2O2 and the results obtained showed that this process is very promising for the complete removal of DEP from contaminated water.
Ozonation and O3/UV
In the case of ozone, the variables studied were pH, diesel-in-water emulsion concentration and ozone flow rate. The relation between degradation time and pH is shown in Figure 1d. On analyzing the response surface it can be noted that a wide range of pH values can be applied with minimal effect on the degradation percentage. However, the maximum efficiency was observed at slightly alkaline pH. Thus, pH 8 and an ozone flow rate of 2.5 mL min-1 were selected for the subsequent experiments.
The ozonation process degraded the compounds in a shorter time (Table 1) than the previous processes studied herein. However, the process was less efficient (71% in 40 min). Fluorescence spectra (FigureS1 (d)) were obtained every 5 min due to the high speed of the reaction. However, at 40 min the reaction was complete and no further degradation was observed after this time.
Ozonation was improved by combining this process with UV light, which increased the removal percentage to 96% in only 30 min of reaction (FigureS1 (e)). The degradation was probably enhanced due to the large amount of hydroxyl radicals generated, as observed by Stepnowski et al.6 In this system three degradation processes occur simultaneously: direct photolysis, direct ozonation and oxidation by hydroxyl radicals, which generates fast and nonselective reactions.41,42 The best results were achieved at alkaline pH, which corroborates the findings of Assalin and Durán43 who compared the efficiency of the ozonation process in the degradation of phenol at two different pH values, 3 and 10. In seven minutes of treatment, the process performed at alkaline pH resulted in 39% total organic carbon (TOC) removal, while the process performed at pH 3 resulted in only 4% removal for the same treatment period. Gurol and Ravikumar44 also performed the oxidative degradation of mixtures of phenolic compounds using the O3/UV process and complete removal (> 99%) of substrate phenol mixtures (50 mg L-1) occurred within 140 min.
Identification of by-products
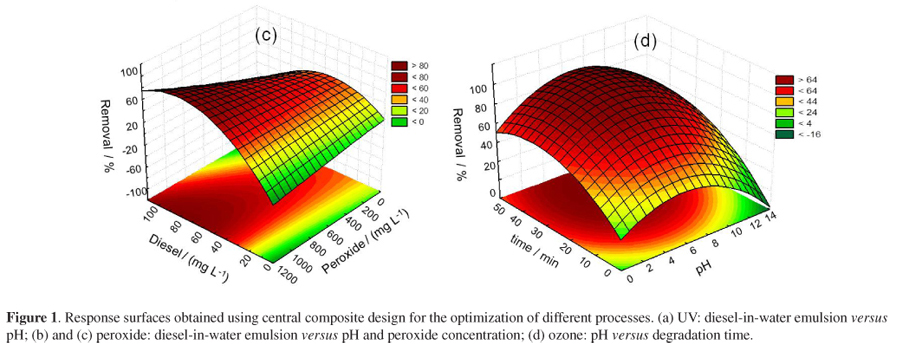
In order to identify the by-products formed during the degradation processes, samples were first analyzed by GC-MS (Figure 2). Due to the complexity of the matrix and the limited separation achieved in the conventional GC mode, no further chemical information regarding aromatic compounds could be obtained from the chromatograms, as they were present in lower concentrations in relation to the saturated hydrocarbons.
Compounds in the diesel oil composition were identified and are in agreement with the findings reported for previous studies.20 Several polycyclic aromatic hydrocarbons, including naphthalene, phenanthrene and alkyl-derivatives, which are listed by the US EPA as carcinogenic and mutagenic compounds due to their adverse effects on humans and other living organisms, were detected.45 The compounds generated after each treatment were tentatively identified by GC×GC-TOFMS, comparing their mass spectra with those available in the NIST Mass Spectra Library. The major by-product classes found were phenols, ketones, ethers and carboxylic acids. Even considering related photochemical studies, publications involving by-products are scarce and the results are sometimes difficult to compare.31
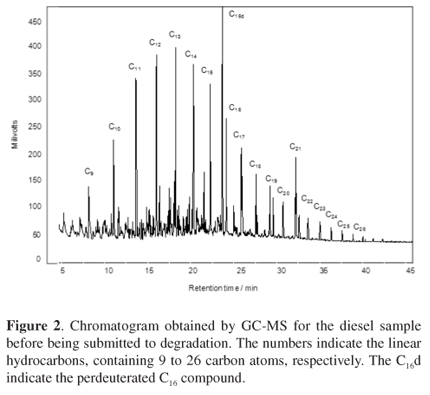
Several papers have shown that marine organisms can bioaccumulate PAH compounds containing 1 to 3 condensed aromatic rings, predominantly phenanthrenes, as reported by Nudi et al.46Figures 3a and 4a show the GC×GC-TOFMS extracted ion chromatograms (EIC) m/z 128+142+156+170+184 for naphthalene and their alkyl-derivatives and m/z 178+192+206 for phenanthrene and their alkyl-derivatives, respectively, for the diesel oil previously submitted to the degradation processes. Although the identifications were based on library information, structured analytical information can also be obtained from the chromatogram. Separations were based on chemical classes, considering the roof tile effect, where each tile represents a certain class of structurally related compounds, having a given number of carbon atoms but with a different structural arrangement. After the different degradation treatment processes almost all of the naphthalene and phenanthrene, as well as their alkyl-derivatives were degraded, as can be verified by the 2D chromatograms shown in Figures 3b-e and Figures 4b-e, respectively.


The by-products obtained from the diesel oil degradation applying the peroxide process monitored via EIC m/z 79 are shown in Figure 5a. This was the main peak observed on the total ion chromatogram. Compared to the other processes the use of H2O2 was slower but able to degrade a higher amount of aromatic compounds. Only two compounds remained after the degradation reaction: 9,12-octadecadienoic acid methyl ester and butylated hydroxytoluene.

Nicodem et al.47 demonstrated that irradiation of alkyl-naphthalenes in the presence of oil or a singlet oxygen sensitizer gave polar oxidation products including alcohols, aldehydes, acids and quinones. In fact, in this study, for the sample submitted to UV irradiation, the photodegradation of diesel oil occurred with the formation of phenol, ether and ketone (Figure 5b). The ozone process was also characterized in terms of the by-products. Compound classes such as phenols and aromatic ketones were tentatively identified in the sample. Ozonation with UV irradiation was also performed and the by-products identified included the classes of phenols, aromatic ketones and aromatic ethers (Figure 5c). These results suggest that O3/UV is the most appropriate method for diesel oil degradation, since few by-products were produced and the degradation time was shorter compared to the other methods investigated in this study.
Conclusions
Results obtained from applying the advanced processes of direct photolysis, peroxide, UV/H2O2, ozonation and O3/UV indicated that by-products with low signal intensities were formed. The compound classes identified by GC×GC-TOFMS included phenols, ethers, ketones, quinones, esters and carboxylic acids. The best results were achieved applying O3/UV, since for this process the maximum degradation was achieved in the shortest time. The peroxide treatment was less efficient and is not feasible for the degradation of these compounds. The GC×GC-TOFMS technique allowed the separation of the classes of compounds present in diesel oil and their chemical identification based on their mass spectra after degradation. Thus, we can conclude that this technique is an important tool for the identification of the by-products of oxidative degradation processes, particularly for complex samples, such as diesel oil, even when present in low concentration. The information obtained on the chemical composition of the by-products can be used to determine the most appropriate technology for the cost-effective treatment of diesel in aquatic environments. Moreover, these results are important to understanding and assigning possibly toxic effects remaining in the treated sample.
Supplementary information (SI)
Supplementary data (fluorescence spectra) is available free of charge at http://jbcs.sbq.org.br as PDF file.
Acknowledgments
The authors are grateful to Petrobras (TC nº 4600300827/2009), CNPq (Process nº 304648/2011-6 Produtividade em Pesquisa - PQ D1) for financial support and to Capes and CNPq for scholarships (CNPq Process 140657/2011-8).
References
1. Allen, L.; Cohen, M. J.; Abelson, D.; Miller, B. In The World´s Water; Allen, L.; Cohen, M. J.; Abelson, D.; Miller, B.; Gleick, P. H., eds.; Island Press: Washington D.C., USA, 2011, ch. 4.
2. Garret, R. M.; Pickering, I. J.; Haith, C. E.; Prince, R. C.; Environ. Sci. Technol. 1998, 32, 3719.
3. Mota, A. L. N.; Albuquerque, L. F.; Beltrame, L. T. C.; Chiavone-Filho, O.; Machulek Jr, A.; Nascimento, C. A. O.; Braz. J. Petrol. Gas 2008, 3, 122.
4. Nicodem, D. E.; Fernandes, M. C. Z.; Guedes, C. L. B.; Correa, R. J.; Biogeochemistry 1997, 39, 121.
5. Zhong, P.; Kong, L. R.; Lin, Z. F.; Liu, G. M.; Bull. Environ. Contam. Toxicol. 2003, 70, 1128.
6. Stepnowski, P.; Siedlecka, E. M.; Behrend, P.; Jastorff, B.; Water Res. 2002, 36, 2167.
7. Lee, R. F.; Spill Sci. Technol. Bull. 2003, 8, 157.
8. D'Auria, M.; Emanuele, L.; Racioppi, R.; Velluzzi, V.; J. Hazard. Mater. 2009, 164, 32.
9. Radovic, J. R.; Aeppli, C.; Nelson, R. K.; Jimenrz, N.; Reddy, C. M.; Bayona, J. M.; Mar. Pollut. Bull. 2014, 79, 268.
10. Ray, P. Z.; Tarr, M. A.; Chemosphere 2014, 103, 220.
11. Andreozzi, R.; Caprio,V.; Insola, M.; Marotta, R.; Catal. Today 1999, 53, 51.
12. Diya'uddeen, B. H.; Daud, W. M. A. W.; Aziz, A. R. A.; Process Saf. Environ. Prot. 2011, 89, 95.
13. von Gunten, U.; Water Res. 2003, 37, 1443.
14. Andreozzi, R.; Insola, A.; Caprio, V.; D'Amore, M. G.; Water Res. 1992, 26, 639.
15. Andreozzi, R.; Caprio, V.; D'Amore, M. G.; Insola, A.; Water Res. 1995, 29, 1.
16. Panic, O.; Górecki, T.; Anal. Bioanal. Chem. 2006, 386, 1013.
17. Philips, J. B.; Xu, J.; J. Chromatogr. A 1995, 703, 327.
18. Dalluge, J.; Beens, J.; Brinkman, U. A. Th.; J. Chromatogr. A 2003, 1000, 69.
19. Adahchour, M.; Beens, J.; Brinkman, U. A. Th.; J. Chromatogr. A 2008, 1186, 67.
20. Edam, R.; Blomberg, J.; Janssen, H. G.; Schoenmakers, P. J.; J. Chromatogr. A 2005, 1086, 12.
21. Ávila, B. M. F.; Pereira, R.; Gomes, A. O.; Azevedo, D. A.; J. Chromatogr. A 2011, 1218, 3208.
22. Silva, R. S. F.; Tamanqueira, J. B.; Dias, J. C. M.; Passarelli, F. M.; Bidard, A. M. F.; Aquino Neto, F. R.; Azevedo, D. A.; J. Braz. Chem. Soc. 2011, 22, 2121.
23. Oliveira, C. R.; Oliveira, C. J. F.; Ferreira, A. A.; Azevedo, D. A.; Aquino Neto, F. R.; Org. Geochem. 2012, 53, 131.
24. von Mühlen, C.; Zini, C. A.; Caramão, E. B.; Marriott, P. J.; J. Chromatogr. A 2006, 1105, 39.
25. Wang, F. C. Y.; Qian, K.; Green, L. A.; Anal. Chem. 2005, 77, 2777.
26. Gaines, R. B.; Frysinger, G. S.; Stuart, J. D.; Environ. Sci. Technol. 1999, 33, 2106.
27. Frysinger, G. S.; Gaines, R. B.; J. High Resolut. Chromatogr. 1999, 22, 251.
28. Frysinger, G. S.; Gaines, R. B.; Environ. Forensics 2002, 3, 27.
29. Hua, R.; Li, Y.; Liu, W.; Zheng, J.; Wei, H.; Wang, J.; Lu, X.; Kong, H.; Xu, G.; J. Chromatogr. A 2003, 1019, 101.
30. Vendeuvre, C.; Ruiz-Guerrero, R.; Bertoncini, F.; Duval, L.; Thiébaut, D.; Oil Gas Sci. Technol. 2007, 62, 43.
31. García-Martinez, M. J.; Da Riva, I.; Canoira, L.; Llamas, J. F.; Alcántara, R.; Gallego, J. L. R.; Appl. Catal., B 2006, 67, 279.
32. Statistica 6.0® Computer Program (StatSoft, Tulsa, OK, USA).
33. Legrini, O.; Oliveros, E.; Braun, A. M.; Chem. Rev. 1993, 93, 671.
34. Hutzinger, O.; The Handbook of Environmental Chemistry, vol. 2.; Springer-Verlag: Berlin, Heidelberg, 2005.
35. Benatti, C. T.; Tavares, C. R. G.; Guedes, T. A.; J. Environ. Manage. 2006, 80, 66.
36. Helz, G. R.; Zepp, R. G.; Crosby, D. G.; Aquatic and Surface Photochemistry; CRC Press, Inc. : Boca Raton, FL, 1994.
37. Goi, A.; Trapido, M.; Chemosphere 2002, 46, 913.
38. Benitez, F. J.; Beltran, J.; Acero, J. L.; Rubio, F. J.; Ind. Eng. Chem. Res. 1999, 38, 1341.
39. Sundstrom, D. W.; Weir, B. A.; Klei, H. E.; Environ. Prog. 1989, 8, 6.
40. Xu, B.; Gao, N. Y.; Sun, X. F.; Xia, S. J.; Rui, M.; Simonnot, M. O.; Causserand, C.; Zhao, J. F.; J. Haz. Mat. 2007, 139, 132.
41. Beltran, F. J.; García-Araya, J. F.; Acedo, B.; Water Res. 1994, 10, 2165.
42. Beltran, F. J.; Ovejero, G.; García-Araya, J. F.; Rivas, J.; Ind. Eng. Chem. Res. 1995, 5, 1607.
43. Assalin, M. R.; Durán, N.; Analytica 2007, 26, 76.
44. Gurol, M. D.; Ravikumar, J.; Env. Sci. Technol. 1994, 28, 394.
45. Kennish, M. J.; Ecology of Estuaries: Anthropogenic Effects; CRC Press, Inc. : Boca Raton, Fl, 2000.
46. Nudi, A. H.; Wagener, A. L. R.; Francioni, E.; Scofield, A. L.; Sette, C. B.; Veiga, A.; Environ. Int. 2007, 33, 315.
47. Nicodem, D. E.; Guedes, C. L. B.; Fernandes, M. C. Z.; Severino, D.; Correa, R. J.; Coutinho, M. C.; Silva, J.; Prog. React. Kinet. 2001, 26, 219.
Submitted on: April 15, 2014
Published online: May 27, 2014
Supplementary Information
The supplementary material is available in pdf: [Supplementary material]
- 1. Allen, L.; Cohen, M. J.; Abelson, D.; Miller, B. In The World´s Water; Allen, L.; Cohen, M. J.; Abelson, D.; Miller, B.; Gleick, P. H., eds.; Island Press: Washington D.C., USA, 2011, ch. 4.
- 2. Garret, R. M.; Pickering, I. J.; Haith, C. E.; Prince, R. C.; Environ. Sci. Technol. 1998, 32, 3719.
- 3. Mota, A. L. N.; Albuquerque, L. F.; Beltrame, L. T. C.; Chiavone-Filho, O.; Machulek Jr, A.; Nascimento, C. A. O.; Braz. J. Petrol. Gas 2008, 3, 122.
- 4. Nicodem, D. E.; Fernandes, M. C. Z.; Guedes, C. L. B.; Correa, R. J.; Biogeochemistry 1997, 39, 121.
- 5. Zhong, P.; Kong, L. R.; Lin, Z. F.; Liu, G. M.; Bull. Environ. Contam. Toxicol. 2003, 70, 1128.
- 6. Stepnowski, P.; Siedlecka, E. M.; Behrend, P.; Jastorff, B.; Water Res. 2002, 36, 2167.
- 7. Lee, R. F.; Spill Sci. Technol. Bull. 2003, 8, 157.
- 8. D'Auria, M.; Emanuele, L.; Racioppi, R.; Velluzzi, V.; J. Hazard. Mater. 2009, 164, 32.
- 9. Radovic, J. R.; Aeppli, C.; Nelson, R. K.; Jimenrz, N.; Reddy, C. M.; Bayona, J. M.; Mar. Pollut. Bull. 2014, 79, 268.
- 10. Ray, P. Z.; Tarr, M. A.; Chemosphere 2014, 103, 220.
- 11. Andreozzi, R.; Caprio,V.; Insola, M.; Marotta, R.; Catal. Today 1999, 53, 51.
- 12. Diya'uddeen, B. H.; Daud, W. M. A. W.; Aziz, A. R. A.; Process Saf. Environ. Prot 2011, 89, 95.
- 13. von Gunten, U.; Water Res. 2003, 37, 1443.
- 14. Andreozzi, R.; Insola, A.; Caprio, V.; D'Amore, M. G.; Water Res. 1992, 26, 639.
- 15. Andreozzi, R.; Caprio, V.; D'Amore, M. G.; Insola, A.; Water Res. 1995, 29, 1.
- 16. Panic, O.; Górecki, T.; Anal. Bioanal. Chem 2006, 386, 1013.
- 17. Philips, J. B.; Xu, J.; J. Chromatogr. A 1995, 703, 327.
- 18. Dalluge, J.; Beens, J.; Brinkman, U. A. Th.; J. Chromatogr. A 2003, 1000, 69.
- 19. Adahchour, M.; Beens, J.; Brinkman, U. A. Th.; J. Chromatogr. A 2008, 1186, 67.
- 20. Edam, R.; Blomberg, J.; Janssen, H. G.; Schoenmakers, P. J.; J. Chromatogr. A 2005, 1086, 12.
- 21. Ávila, B. M. F.; Pereira, R.; Gomes, A. O.; Azevedo, D. A.; J. Chromatogr. A 2011, 1218, 3208.
- 22. Silva, R. S. F.; Tamanqueira, J. B.; Dias, J. C. M.; Passarelli, F. M.; Bidard, A. M. F.; Aquino Neto, F. R.; Azevedo, D. A.; J. Braz. Chem. Soc. 2011, 22, 2121.
- 23. Oliveira, C. R.; Oliveira, C. J. F.; Ferreira, A. A.; Azevedo, D. A.; Aquino Neto, F. R.; Org. Geochem 2012, 53, 131.
- 24. von Mühlen, C.; Zini, C. A.; Caramão, E. B.; Marriott, P. J.; J. Chromatogr. A 2006, 1105, 39.
- 25. Wang, F. C. Y.; Qian, K.; Green, L. A.; Anal. Chem. 2005, 77, 2777.
- 26. Gaines, R. B.; Frysinger, G. S.; Stuart, J. D.; Environ. Sci. Technol 1999, 33, 2106.
- 27. Frysinger, G. S.; Gaines, R. B.; J. High Resolut. Chromatogr. 1999, 22, 251.
- 28. Frysinger, G. S.; Gaines, R. B.; Environ. Forensics 2002, 3, 27.
- 29. Hua, R.; Li, Y.; Liu, W.; Zheng, J.; Wei, H.; Wang, J.; Lu, X.; Kong, H.; Xu, G.; J. Chromatogr. A 2003, 1019, 101.
- 30. Vendeuvre, C.; Ruiz-Guerrero, R.; Bertoncini, F.; Duval, L.; Thiébaut, D.; Oil Gas Sci. Technol 2007, 62, 43.
- 31. García-Martinez, M. J.; Da Riva, I.; Canoira, L.; Llamas, J. F.; Alcántara, R.; Gallego, J. L. R.; Appl. Catal., B 2006, 67, 279.
-
32Statistica 6.0® Computer Program (StatSoft, Tulsa, OK, USA).
- 33. Legrini, O.; Oliveros, E.; Braun, A. M.; Chem. Rev 1993, 93, 671.
- 34. Hutzinger, O.; The Handbook of Environmental Chemistry, vol. 2.; Springer-Verlag: Berlin, Heidelberg, 2005.
- 35. Benatti, C. T.; Tavares, C. R. G.; Guedes, T. A.; J. Environ. Manage. 2006, 80, 66.
- 36. Helz, G. R.; Zepp, R. G.; Crosby, D. G.; Aquatic and Surface Photochemistry; CRC Press, Inc. : Boca Raton, FL, 1994.
- 37. Goi, A.; Trapido, M.; Chemosphere 2002, 46, 913.
- 38. Benitez, F. J.; Beltran, J.; Acero, J. L.; Rubio, F. J.; Ind. Eng. Chem. Res. 1999, 38, 1341.
- 39. Sundstrom, D. W.; Weir, B. A.; Klei, H. E.; Environ. Prog. 1989, 8, 6.
- 40. Xu, B.; Gao, N. Y.; Sun, X. F.; Xia, S. J.; Rui, M.; Simonnot, M. O.; Causserand, C.; Zhao, J. F.; J. Haz. Mat 2007, 139, 132.
- 41. Beltran, F. J.; García-Araya, J. F.; Acedo, B.; Water Res. 1994, 10, 2165.
- 42. Beltran, F. J.; Ovejero, G.; García-Araya, J. F.; Rivas, J.; Ind. Eng. Chem. Res 1995, 5, 1607.
- 43. Assalin, M. R.; Durán, N.; Analytica 2007, 26, 76.
- 44. Gurol, M. D.; Ravikumar, J.; Env. Sci. Technol 1994, 28, 394.
- 45. Kennish, M. J.; Ecology of Estuaries: Anthropogenic Effects; CRC Press, Inc. : Boca Raton, Fl, 2000.
- 46. Nudi, A. H.; Wagener, A. L. R.; Francioni, E.; Scofield, A. L.; Sette, C. B.; Veiga, A.; Environ. Int 2007, 33, 315.
- 47. Nicodem, D. E.; Guedes, C. L. B.; Fernandes, M. C. Z.; Severino, D.; Correa, R. J.; Coutinho, M. C.; Silva, J.; Prog. React. Kinet 2001, 26, 219.
Publication Dates
-
Publication in this collection
04 Aug 2014 -
Date of issue
Aug 2014
History
-
Received
15 Apr 2014 -
Accepted
27 May 2014