Preparation, Characterization, and Application of Tucum Activated Carbon (Astrocaryum vulgare Mart.) for Ca2+ Removal from Aqueous Solutions
Abstract
The ingestion of hard water from underground sources, such as wells and cisterns, may lead to the development of diseases. Therefore, the investigation of remediation methods is necessary, among which adsorption stands out due to its simplicity and flexibility. In this context, the present study aimed to synthesize, characterize, and evaluate the adsorptive performance of tucum activated carbon (TAC1:1-3-350), produced by chemical activation with phosphoric acid, for the removal of Ca2+ ions. The material obtained, exhibited a point of zero charge (pHpzc) of 2.36, a Brunauer, Emmett and Teller (BET) specific surface area of 167 m2 g-1, and an average pore diameter of 1.43 nm. The adsorption kinetics of Ca2+ ions were best described by the Elovich model, while the equilibrium data showed a better fit to the Langmuir isotherm model. A removal efficiency of 84% was achieved, with a maximum adsorption capacity of 25.26 mg g-1. Thermodynamic analysis indicated that Ca2+ adsorption is spontaneous (∆G0ads < 0) and exothermic (∆H0ads = -18.76 kJ mol-1), suggesting a predominantly physical adsorption process, accompanied by an increase in disorder at the solid solution interface (∆S0ads = 0.126 kJ mol-1 K-1). These results highlight the potential of tucum activated carbon as a low-cost alternative adsorbent for water softening applications.
Keywords:
adsorption; water softening; calcium adsorption; biomass; activated carbon
Introduction
Water is an essential natural resource for the maintenance of life and ecological balance, and it also plays a strategic role in sustainable economic development. Its use ranges from domestic consumption to industrial and agricultural applications, making it a central element in social and productive dynamics.1 In Brazil, approximately 14.5% of households, equivalent to about 10.9 million residences, are still not served by the public water supply network. In this context, a measure frequently adopted to compensate for the lack of public water supply infrastructure is the extraction of water from artesian wells or shallow wells.2 However, in many cases, water extracted from these groundwater sources is consumed without prior physicochemical or microbiological analyses and without undergoing any treatment processes, which represents a potential risk to public health.3
The World Health Organization (WHO)4 estimates that approximately one million deaths occur globally each year as a result of diarrheal diseases, with a significant proportion of these cases associated with the consumption of contaminated water. Consequently, the intake of water from wells or surface sources such as rivers without adequate treatment can lead to a range of adverse effects on human health. In addition to contamination by biological pathogens, there is also a considerable risk of exposure to inorganic contaminants.5
Excessive accumulation of metals in the human body resulting from the ingestion of contaminated water can cause a range of adverse health effects, impairing the function of organs such as the brain, kidneys, lungs, and liver. Moreover, it has been associated with physical, muscular, and neurological degenerative disorders, including Parkinson’s disease, multiple sclerosis, muscular dystrophy, and Alzheimer’s disease.6 Water containing high concentrations of calcium (Ca2+) and magnesium (Mg2+) ions is classified as hard water. The ingestion of hard water has been associated with conditions such as sarcoidosis, endocrine dysfunctions, thyroid disorders, prolonged immobilization, and genetic disturbances.7,8
Considering this issue, which is closely linked to human health, the adoption of effective preventive measures with applicability in the short, medium, and long term is necessary. With the aim of promoting removal and minimizing the environmental impacts associated with the presence of metals in surface and groundwater, several treatment methods have been developed. In water softening processes focused on the removal of Ca2+ ions, certain techniques have gained prominence, including flotation,9 electroflocculation,10 membrane-based processes,11 and dissolved air flotation (DAF).12
In this scenario, adsorption has emerged as a promising technique for the removal of metal ions from water due to its operational simplicity, relatively low cost, and the possibility of using adsorbents derived from natural or waste sources, often achieving performance comparable to or even superior to conventional methods.13 In recent years, the development of engineered adsorbents has advanced significantly, including doped oxides for gas capture14 and biochars with properties tailored by the feedstock for treating complex wastewater.15 In parallel, advanced nanocomposites have been developed for catalytic pollutant degradation,16 while high-performance composites have shown remarkable capacities for heavy metal adsorption.17 In this context, activated carbons derived from underexplored biomass sources, such as coconut shells,18 eucalyptus wood,19 palm shells,20 and rice husk,21 represent a promising and low-cost approach for ion removal in aqueous media.
In this context, the exploration of regional raw materials offers not only scientific potential but also economic and environmental advantages. The state of Maranhão has a wide availability of lignocellulosic biomass, which can be used in the production of adsorbents, either in its raw (in natura) form or after activation processes. Among these resources, tucum or tucumã, the fruit of the palm Astrocaryum vulgare Mart., stands out due to its abundance in the northern and northeastern regions of Brazil.22 Therefore, the aim of this study was to synthesize and characterize phosphoric-acid-activated carbon obtained from tucum endocarp and to evaluate its adsorptive potential for the removal of calcium ions (Ca2+) from aqueous solutions.
Experimental
Chemicals and reagents
All reagents used in this study were of analytical grade. Phosphoric acid (H3PO4, 85% P.A., Synth), calcium chloride dihydrate (CaCl2.2H2O, Dinâmica), ethylenediaminetetraacetic (disodium EDTA, Dinâmica), Eriochrome black T indicator (Êxodo), calcium carbonate (CaCO3, Dinâmica) used for EDTA standardization, hydrochloric acid (HCl, Neon), and sodium hydroxide (NaOH, Dinâmica) were employed. Distilled water was used in the preparation of all solutions.
Instrumentation
Thermogravimetric analysis was performed using a Shimadzu TGA-51 thermobalance under an inert argon atmosphere at a flow rate of 50 mL min-1, with a heating rate of 10 °C min-1 up to 1000 °C. Moisture and ash contents were determined using a drying oven (model MA 035, Marconi) and a muffle furnace (model J400, Jung), respectively. Nitrogen physisorption analysis was carried out using a surface area and porosity analyzer (ASAP 2020 Plus, Micromeritics Instrument Corporation). The sample was pretreated at 200 °C for 3 h under vacuum during degassing, and the measurements were performed at 77.8 K. Fourier transform infrared spectroscopy (FTIR) spectra were recorded using a Shimadzu IRAffinity-1S FTIR spectrometer, with samples prepared as KBr pellets at a ratio of 1:99 (m/m). Scanning electron microscopy (SEM) analysis was performed using a Shimadzu SSX-550 scanning electron microscope at magnifications of 5.00, 9.99, and 40.0 k×, with an electron beam energy of 20 keV.
Synthesis of tucum activated carbon
The fruits were collected in the city of Codó, Maranhão, Brazil, where their pulp was manually removed. Subsequently, the endocarp was separated from the internal kernel. The endocarp was ground using a jaw crusher (model MA4080, Marconi), washed with running water, and dried in an oven at 100 °C for 24 h. After drying, the tucum endocarp was impregnated with a H3PO4 solution at a 1:1 (m/m) ratio for 24 h. The material was then filtered, dried, and pyrolyzed at 350 °C for 3 h in a muffle furnace. Subsequently, it was thoroughly washed with distilled water until the pH of the supernatant stabilized at approximately 5.5. Finally, the carbon material was dried in an oven at 100 °C for 24 h, sieved to obtain a particle size in the 100 200 mesh range. Thus, the final material obtained was designated as tucum activated carbon (TAC1:1-3-350). The study was registered under code A32F4C5 in the National System for the Management of Genetic Heritage and Associated Traditional Knowledge (SisGen).
Thermogravimetric analysis (TGA/DTG)
Thermogravimetric analysis was performed on the tucum endocarp biomass (TB) using a Shimadzu TGA-51 thermobalance under an inert argon atmosphere at a flow rate of 50 mL min-1. Approximately 10.2 mg of the sample was placed in a platinum crucible and analyzed at a heating rate of 10 °C min-1 up to 1000 °C.
Gravimetric yield, moisture content and ash content
The gravimetric yield, moisture content, and ash content were calculated according to ASTM C831-1822 (equation 1), ASTM D2867-2322 (equation 2) and ASTM D2866-1122 (equation 3), respectively.
In the yield expression, Mc represents the mass of the obtained carbon, and Mb corresponds to the mass of the dry biomass. In the moisture content expression, Md denotes the mass of the dried carbon. In the ash content expression, B is the mass of the crucible, C is the mass of the crucible containing the sample, and D is the mass of the crucible containing the sample after calcination. All mass values were expressed in grams (g).
N2 adsorption-desorption
The textural properties of TAC1:1-3-350, were analyzed using a Micromeritics ASAP 2020 Plus instrument. The samples were pretreated at 200 °C for 3 h under vacuum during degassing, and the measurements were performed at 77.8 K, using a sample mass of 0.1344 g.
Fourier transform infrared spectroscopy
FTIR spectra were recorded for the samples of raw tucum biomass (TB), non-activated tucum carbon (TC), and tucum activated carbon (TCA1:1-3-350) using a Shimadzu IRAffinity-1S FTIR spectrometer. The samples were prepared as KBr pellets at a ratio of 1:99 (m/m) and analyzed at a resolution of 2 cm-1 over the spectral range from 400 to 4000 cm-1.
pH at the point of zero charge (pHpzc)
The pHpzc determination was carried out using a 0.1 mol L-1 KCl background electrolyte. Aliquots of 20 mL of this solution were distributed into 11 beakers, and the initial pH was adjusted from 2 to 12 using 0.1 mol L-1 HCl or NaOH solutions. Subsequently, 30 mg of the sample was added to each solution. After a contact time of 48 h, the pH of the supernatant was measured again. The pHpzc was determined by plotting the initial pH versus ∆pH.
Scanning electron microscopy
SEM images were acquired to examine the surface morphology of the TB, TC, and TAC1:1-3-350. High-resolution images were acquired using a Shimadzu SSX-550 scanning electron microscope, with the electron beam energy varied between 5 and 20 keV and the electron beam diameter ranging from 11.6 to 112 nm.
Adsorption experiments
The quantification of Ca2+ ions was performed by EDTA complexometric titration using murexide as the indicator. To determine the amount of adsorbate removed per unit mass of adsorbent at equilibrium, qe (mg g-1), and the removal percentage (%), equations 4 and 5 were used, respectively.
where C0 and Ce are the initial and equilibrium concentrations (mg L-1), respectively; m is the mass of the adsorbent (g), and V is the solution volume (L).
Adsorbent mass
To evaluate the effect of adsorbent mass on Ca2+ ion adsorption, the adsorbent mass was varied. Amounts of 10, 20, 30, 40, 50, 60, 80, 100, 150, 200, 300, and 500 mg were brought into contact with 20 mL of a CaCl2.2H2O solution at a concentration of 20 mg L-1 and pH 7. The experiments were maintained under agitation at 1100 rpm for 24 h. Subsequently, the solutions were filtered using an 8 µm filter. For metal ion quantification, 5 mL aliquots were withdrawn after adjusting the solution pH to 12, and the samples were rapidly titrated with 0.001 mol L-1 EDTA (disodium salt). The titration endpoint was identified by the color change from orange to violet.
Adsorption kinetics
Adsorption equilibrium was determined by varying the contact time between the Ca2+ ion solution and TAC1:1 3 350. A mass of 300 mg of TAC1:1-3-350 was contacted with 100 mL of a 40 mg L-1 CaCl2.2H2O solution, and the contact time was varied at 1, 3, 5, 10, 15, 30, 60, 120, and 240 min under constant agitation at 1100 rpm. At each time interval, aliquots were withdrawn for quantification by complexometric titration with 0.001 mol L-1 EDTA. The experimental data obtained from the adsorption tests were fitted to the pseudo-first-order, pseudo-second-order, and Elovich kinetic models, as well as to the intraparticle diffusion model, as described by equations 6-9, respectively.
where qe and qt represent the adsorption capacities at equilibrium and at a given time t, respectively; k1 and k2 correspond to the pseudo-first-order and pseudo-second-order rate constants; and α and β are the Elovich parameters, associated with the initial adsorption rate and the desorption-related constant, respectively.23
Adsorption isotherm
To construct the adsorption isotherms for Ca2+ ions, 300 mg of TAC1:1-3-350 was brought into contact with 100 mL of a CaCl2.2H2O solution at pH 7, while varying the initial concentrations in the range of 10 to 100.20 mg L-1. The experiments were carried out under constant agitation at 1100 rpm and temperatures of 298, 308, 318, and 328 K. The experimental data were then fitted to the adsorption isotherm models proposed by Langmuir, Freundlich and Temkin, equations 10, 12 and 13, respectively.
where KL (L mg-1) is the Langmuir equilibrium constant related to the affinity between the adsorbate and the adsorbent; qm (mg g-1) represents the maximum monolayer adsorption capacity; RL is the separation factor predicted by the Langmuir model; KF and n are the Freundlich constants; R and T are the universal gas constant (8.324 J mol-1 K-1) and the absolute temperature (K), respectively, and aT and b are the Temkin constants.
Thermodynamic parameters
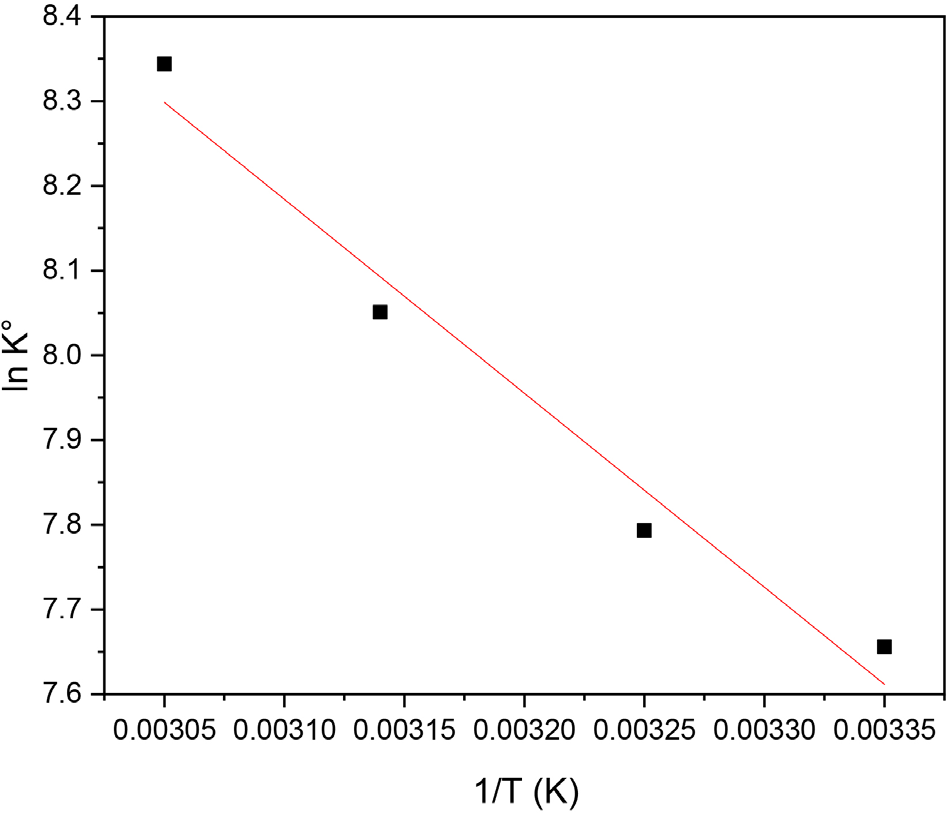
Using the equilibrium concentration (Ce) and the amount adsorbed at equilibrium (qe), the equilibrium constan (Kc) was calculated as the ratio between the adsorbed concentration and the residual concentration in solution, as defined by equation 14.24 The Kc constant was adjusted using the correction factor, making it dimensionless according to equation 15. The thermodynamic parameters standard enthalpy change (∆H0) and standard entropy change (∆S0) were determined using the van’t Hoff graphical method, which is based on the linear relationship between ln Kc and the reciprocal of the absolute temperature. Accordingly, the experimentally determined values of ln Kc were plotted as a function of 1/T (K). The ∆H0 was obtained from the slope of the linear fit, while the ∆S0 was derived from the intercept, as described by equation 16. The standard Gibbs free energy change (∆G0) was subsequently calculated using equation 17, which relates the previously obtained parameters to the absolute temperature.25
where MCa is the molar mass of the solute, R is the universal gas constant (8.314 J mol-1 K-1), T is the absolute temperature (K), Kc represents the equilibrium constant and K0 is the dimensionless equilibrium constant.
Results and Discussion
Characterization
Thermogravimetric analysis
Thermogravimetric analysis was performed to evaluate the thermal stability of the biomass, as well as to investigate the mass loss behavior associated with the release of volatile compounds during heating. Figure 1 presents the TGA and DTG curves obtained for the TB sample.

The thermogravimetric curve obtained for TB clearly shows three mass-loss events characteristic of lignocellulosic biomass profiles. The first mass-loss event occurs up to approximately 100-110 °C and is associated with the release of moisture and volatile compounds from the biomass, corresponding to a mass loss of 6.66%.26 The second mass-loss event starts at approximately 200 °C and extends up to around 330 °C, being mainly attributed to the thermal decomposition of hemicellulose and cellulose, which are the least thermally stable components of lignocellulosic biomass. This stage represents a substantial mass loss of 51.25%.27 The third mass-loss event occurs in the temperature range of 330-550 °C and is associated with lignin degradation, which takes place over a broader temperature interval due to the complex aromatic structure and higher thermal stability of this biopolymer.28 Studies such as those reported by Bentes et al.,29 who investigated açaí and tucum seeds, and by Faraji and Saidi,30 who used peanut shells, exhibit thermogravimetric behaviors similar to those observed in the present study, particularly regarding the shape of the TGA curves and the onset and end temperatures of the main thermal degradation events.
Gravimetric yield, moisture content and ash content
For carbonaceous materials, several parameters are directly influenced by the synthesis conditions, including the gravimetric yield, which reflects the final mass remaining after thermal treatment, as well as the moisture and ash contents, which are associated with the affinity of the carbon material for water molecules and the presence of inorganic mineral matter in its composition, respectively. For TAC1:1-3-350, a gravimetric yield of 32.79% was obtained, along with a moisture content of 8.13 ± 0.39% and an ash content of 2.68 ± 0.56%. These values fall within the range commonly reported for activated carbons in the literature.31
N2 adsorption-desorption
Nitrogen adsorption-desorption analysis is widely employed for the characterization of porous materials, enabling the determination of parameters such as specific surface area, pore volume, and pore diameter. Figures 2a and 2b present the N2 adsorption-desorption isotherm and the pore size distribution of TAC1:1-3-350, respectively. The isotherm exhibits a type I profile with an H4 hysteresis loop (Figure 2a). A reversible type I isotherm is characteristic of microporous materials, in which pore diameters are smaller than 2 nm, according to the International Union of Pure and Applied Chemistry (IUPAC) classification. In addition, the presence of H4-type hysteresis, identified by the asymmetry between the adsorption and desorption branches, suggests the existence of narrow slit-shaped pores and a significant contribution of microporosity.32

Hysteresis loops are more commonly observed in adsorption isotherms of mesoporous materials; however, the H4-type hysteresis, characterized by its elongated horizontal shape, is typical of materials exhibiting a mixed micro-mesoporous structure. Therefore, the presence of this hysteresis allows the material to be classified as predominantly microporous with a contribution from mesopores.33 This interpretation is further supported by the pore size distribution plot (Figure 2b), which shows a pronounced contribution in the micropore range (dp < 2 nm), along with a less intense but noticeable distribution within the mesopore region (2 nm < dp ≤ 50 nm).
TAC1:1-3-350 exhibited a specific surface area of 167 m2 g-1, indicating a significant development of porosity in the material. Similar results have been reported in the literature for activated carbons chemically activated with phosphoric acid. Tounsadi et al.,34 using activated carbon derived from the stem biomass of Glebionis coronaria L., reported a specific surface area of approximately 100.15 m2 g-1, employing an activation ratio of 2:1 (m/m) of H3PO4. The total pore volume determined for TAC1:1-3-350 was 0.102 cm3 g-1. Rajesh et al.,35 using phosphoric-acid-activated carbon derived from bamboo biomass, reported a pore volume of approximately 0.233 cm3 g-1, which is of the same order of magnitude as that observed in the present study. Regarding the average pore diameter, Silva et al.27 reported an average pore size of 1.44 nm for phosphoric acid-activated carbon derived from tamboril (Enterolobium contortisiliquum) and applied to methylene blue removal. In the present work, an average pore diameter of 1.43 nm was obtained, allowing TAC1:1-3-350 to be classified as a predominantly microporous material.
It is important to highlight that the environment within slit-shaped micropores (H4 hysteresis) differs significantly from the unconfined aqueous medium. In these pores, partially hydrated Ca2+ ions can access cavities with widths below 1 nm. Under such conditions, the dielectric constant of confined water tends to decrease, enhancing electrostatic interactions between the adsorbate and the carbon surface.36 Although relevant at the nanoscale, these confinement effects do not compromise the macroscopic conclusions of this study, which are based on equilibrium behavior in solution.
Fourier transform infrared spectroscopy
Infrared spectroscopy was used to identify the surface functional groups involved in in the adsorption process, and Figure 3 presents the FTIR spectra of TB, TC, and TAC1:1-3-350.

Infrared spectroscopy of tucum biomass (TB), tucum carbon (TC), and tucum activated carbon (TAC1:1-3-350).
The FTIR spectra of the three samples exhibit broad bands around 3295 cm-1, attributed to O-H stretching vibrations of hydroxyl groups in lignin, cellulose, and hemicellulose.37 In the TC and TAC1:1-3-350 spectra, bands at approximately 2905 and 2870 cm-1 correspond to C-H stretching vibrations of methyl (-CH3) and methylene (-CH2-) groups. The absorption band near 1721 cm-1 is associated with C=O stretching, indicating the presence of carbonyl-containing functional groups such as carboxylic acids, esters, or aromatic compounds, while the intense band at around 1527 cm-1 is assigned to C=C stretching vibrations of aromatic rings. Bands observed at approximately 1147 cm-1 are characteristic of C-O-C stretching vibrations of aromatic ethers in lignin and aliphatic ethers from cellulose or hemicellulose, being more intense in the TB spectrum, which suggests the effect of pyrolysis on the decomposition of volatile components.13,26 The bands at approximately 971 cm-1, attributed to P=O stretching in the TB and TC spectra, shift to around 940 cm-1 in the TAC1:1-3-350 spectrum, corresponding to P-O-C and asymmetric P-O-P stretching vibrations, evidencing the effect of chemical activation with H3PO4.13 Finally, bands around 667 cm-1 are assigned to out-of-plane C-H bending vibrations in aromatic systems, characteristic of benzene ring structures.34
pH at the point of zero charge
The pHpzc indicates the pH at which the surface of a material exhibits a net zero charge. Figure 4 presents the pHpzc value determined for TAC1:1-3-350, which was found to be 2.36.

The pHpzc plays a crucial role in adsorption processes, as it strongly influences the surface charge of the adsorbent and the nature of the species to be adsorbed. For anionic species at pH values below the pHpzc (pH < pHpzc), the adsorbent surface tends to become positively charged, whereas for cationic species at pH values above the pHpzc (pH > pHpzc), the surface acquires a negative charge, thereby enhancing electrostatic interactions between the adsorbent and the species in solution.38 Consequently, TAC1:1-3-350 exhibits favorable interactions with Ca2+ cations in solution at the natural pH of 7. Based on these considerations, TAC1:1-3-350 is expected to show effective interactions with metal ions over a wide pH range above 2.36.
Several studies39,40 reported in the literature describe the effect of acid activation on biomass-derived materials, indicating that chemical activation, particularly with oxidizing agents such as phosphoric acid, promotes the formation of oxygen-rich acidic functional groups on the surface of the material.
Scanning electron microscopy
SEM images of TB, TC, and TAC1:1-3-350 are presented in Figure 5.

The SEM micrographs of TB (Figure 5a) reveal a predominantly compact and heterogeneous surface with low apparent porosity. Smooth and continuous regions are also observed, indicating the absence of open channels or cavities, which limits the available surface area for adsorption. This behavior is expected, as raw biomass preserves the natural organization of cell walls, with internal pores that are mostly closed or poorly accessible.41 The SEM images of TC (Figure 5b) show a mainly compact surface morphology with the presence of rough regions, fractures, and poorly developed cavities, suggesting an incipient porous structure. The lack of chemical activation results in limited pore opening, with most pores remaining closed or partially blocked, likely due to the presence of organic residues and tar formed during pyrolysis.
In contrast, the SEM micrographs of TAC1:1-3-350 (Figure 5c) reveal a highly rough and fragmented surface with an abundant and well-distributed porous structure. The formation of cavernous features and interconnected channels indicates that the activation process was effective in removing volatile components and opening internal spaces. Previously compact regions became fragmented, demonstrating that the combined chemical and thermal treatment promoted pore expansion and the development of porosity within the lignocellulosic structure.42 Overall, the micrographs highlight the effects of chemical activation, which not only enhances surface functionalization and modifies surface charge but also significantly improves the porous structure of the material.13
Although SEM images reveal a significant morphological change after activation with H3PO4, with the appearance of cavities and increased surface roughness, it is important to note that SEM does not provide direct information about porosity. The well distributed porous structure observed in the micrographs refers to surface morphology, which is indirectly consistent with the activation process that also generates micro and mesopores, as quantified by N2 physisorption.
Adsorption studies
Adsorbent mass
The influence of adsorbent dosage was evaluated by varying the mass of TAC1:1-3-350 during Ca2+ ion adsorption. Figure 6 presents the relationship between the adsorbed amount (mg g-1) and removal efficiency (%) as a function of adsorbent mass.

For the range of adsorbent masses investigated in this study, lower adsorbent dosages resulted in higher adsorption capacities but lower removal efficiencies. Conversely, for higher adsorbent dosages, particularly above 0.05 g, an inverse trend was observed, with a decrease in adsorption capacity accompanied by an increase in removal efficiency. This behavior can be attributed to the increase in available surface area and the number of active sites as the adsorbent mass increases, leading to higher removal efficiencies.43,44 Based on these results, an adsorbent mass of 0.3 g was selected as the optimal dosage for subsequent adsorption studies.
Adsorption kinetics
Contact time is an important parameter directly related to the kinetic behavior of the adsorption process. Figure 7 presents the effect of contact time on the amount adsorbed (mg g-1), along with the fitting of the experimental data to the pseudo-first-order, pseudo-second-order, and Elovich kinetic models, as well as the intraparticle diffusion mechanism.

(a) Effect of contact time on Ca2+ ion adsorption onto TAC1:1-3-350; (b) intraparticle diffusion mechanism.
The graph indicates that adsorption equilibrium for Ca2+ ions is reached at 120 min; after this time, the amount adsorbed remains constant due to the saturation of active sites. The time-dependent adsorption curve shows a rapid and significant increase in adsorption capacity at the initial stages, followed by a gradual attenuation as the active sites become progressively occupied, ultimately reaching adsorption equilibrium when all sites are filled.45 The experimental data obtained from the contact time study were fitted to the pseudo-first-order, pseudo-second-order, Elovich, and intraparticle diffusion kinetic models. Table 1 summarizes the parameters associated with each model.
Kinetic parameters of pseudo-first-order, pseudo-second-order, Elovich, and intraparticle diffusion models for Ca2+ adsorption in TAC1:1-3-350
The experimental data showed the best fit to the Elovich model (R2 = 0.940). Although this model was originally proposed to describe gas adsorption processes on heterogeneous surfaces, it has been widely applied to solid-liquid adsorption systems, including the removal of metal ions by carbonaceous adsorbents. Therefore, the good agreement between the Elovich model and the experimental data suggests that this model adequately describes the adsorption kinetics under the investigated conditions. However, the isolated analysis of the fit of the experimental data to the Elovich model is insufficient to establish the adsorption mechanism and should not be interpreted as definitive evidence of chemisorption.23
The intraparticle diffusion model indicates that Ca2+ adsorption onto TAC1:1-3-350 occurs in three stages: an initial rapid adsorption due to abundant available active sites, a second stage with gradual site occupation, and a final stage corresponding to adsorption equilibrium. The non-zero intercept (C) indicates that intraparticle diffusion is not the only rate-controlling step.27 However, the lower C value in the first stage suggests that pore diffusion is more influential during the initial adsorption period.
Adsorption isotherm and thermodynamic parameters
The study of adsorption thermodynamics is essential for understanding the mechanisms governing the interactions between the adsorbate and the adsorbent surface. Figure 8 presents the calcium adsorption isotherms obtained at different temperatures.

Adsorption isotherms of Ca2+ onto TAC1:1-3-350. [Ca2+] = 10.02 100.2 mg L-1; V = 100 mL; t = 298, 308, 318, and 328 K; adsorbent mass = 0.3 g; contact time = 120 min; pH = 7.0.
The Ca2+ adsorption isotherms exhibited typical favorable behavior, with the formation of a plateau after the fifth experimental point at 318 and 328 K and after the sixth point at 298 and 308 K, indicating saturation of the available adsorption sites. Under these conditions, the maximum experimental adsorption capacity (qe) reached 25.26 mg g-1 at an equilibrium concentration (Ce) of 24.04 mg L-1. Beyond this concentration, the adsorbed amount remained nearly constant, confirming that adsorption equilibrium had been attained due to effective occupation of the active sites.46Table 2 compares biomass derived activated carbons, their activating agents, operating pH, and maximum adsorption capacities.
Table 2 shows that the TAC1:1-3-350 developed in the present study exhibited the highest Ca2+ adsorption capacity among the compared biomass-derived adsorbents, reaching 25.26 mg g-1 at pH 7.0. This value is higher than those reported for activated carbons produced from Leucaena leucocephala wood biochar47 (6.68 mg g-1), pitomba pits48 (19.05 mg g-1), sugarcane bagasse49 (12.23 mg g-1) and, peanut shells50 (17.74 mg g-1). The superior performance of TAC may be associated with the effectiveness of H3PO4 activation, which promotes the development of porous structure and the incorporation of oxygenated/phosphorus-containing surface groups favorable to Ca2+ adsorption. In addition, the adsorption capacity obtained at neutral pH highlights the practical potential of TAC, since water treatment processes near pH 7 are operationally advantageous and minimize the need for pH adjustment.
In order to elucidate the adsorption mechanism and the nature of the interactions between the adsorbate and the adsorbent, the experimental data were fitted to the Langmuir, Freundlich and Temkin isotherm models. Figure 9 presents the corresponding experimental fittings for each model.

From the nonlinear fitting of the isothermal models of Langmuir, Freundlich and Temkin, the characteristic parameters that describe the adsorptive behavior of Ca2+ ions on TAC1:1-3-350 were determined. Table 3 presents the values of the parameters obtained for each model.
Parameters of the Langmuir, Freundlich, and Temkin isothermal models for Ca2+ adsorption in TAC1:1-3-350
The analysis of the experimental data showed that the adsorption process at different temperatures fitted the Langmuir model better, with a R2 closer to 1. Such behavior indicates that, after the complete filling of the available sites, no new adsorbate layers are formed, characterizing an adsorption system restricted to a single molecular layer.46
The separation factor RL obtained for the studied system was 0.43, 0.22, 0.28, and 0.21 at temperatures of 298, 308, 318, and 328 K, respectively, indicating that the adsorption process is favorable according to the Langmuir criteria. Since values of 0 < RL < 1 characterize favorable adsorption, these results demonstrate that the adsorbent exhibits significant affinity toward the adsorbate, although the process is not strongly irreversible.24
Although the Langmuir model provided a good fit to the equilibrium data, suggesting monolayer adsorption on apparently homogeneous sites, this finding does not contradict the surface heterogeneity indicated by the Elovich kinetic model and the phosphorus-rich surface revealed by FTIR analysis. This consistency can be explained by the predominance of adsorption sites associated with negatively charged oxygenated groups, such as carboxylates and deprotonated phenolic groups, which are energetically similar and account for most of the adsorption capacity. Other sites, such as phosphate groups with different degrees of protonation and hydrophobic domains, are less abundant or exhibit lower interaction energy with Ca2+, contributing only marginally to the overall process. From a kinetic perspective, access to these sites may involve diffusion limitations and steric effects, in agreement with the Elovich model. Thus, the Langmuir model describes the equilibrium behavior of the dominant sites, whereas the Elovich model reflects the kinetics of a heterogeneous surface with multiple energy barriers.51
In addition to the isotherm model fittings, the adsorption data were also subjected to thermodynamic analysis to determine the associated thermodynamic parameters. Figure 10 presents the van’t Hoff plot obtained from the relationship between ln Kc and 1/T.

From the slope and intercept of the linear plot, the ∆H0 and ∆S0 of the system can be determined, allowing a reliable interpretation of the nature of the adsorption process and its temperature dependence. The ∆G0 was calculated using the Gibbs free energy equation. Table 4 summarizes the thermodynamic parameters obtained.
The thermodynamic parameters were calculated using a dimensionless equilibrium constant (K0), obtained after correcting the adsorption equilibrium constant according to thermodynamic requirements. The ∆G0 values for Ca2+ adsorption were -18.81 kJ mol-1 at 298 K, -20.08 kJ mol-1 at 308 K, -21.35 kJ mol-1 at 318 K, and -22.62 kJ mol-1 at 328 K. Across all temperature ranges investigated, the negative values of ∆G0ads indicate that the adsorption process is thermodynamically spontaneous and feasible. Although the calculated ∆G0 values remain negative throughout the investigated temperature range, the experimentally observed decrease in adsorption capacity with increasing temperature is consistent with the exothermic nature of the process.25
The negative value of ∆H0ads indicates an exothermic process, meaning that heat is released during adsorption. As the temperature increases, the system tends to favor desorption in order to counterbalance the added thermal energy, in accordance with Le Chatelier’s principle, thereby shifting the equilibrium toward desorption. This behavior explains the reduction in the amount adsorbed with increasing temperature.52
The positive value of ∆S0ads obtained in this study is consistent with a mechanism in which the adsorption of Ca2+ is accompanied by the displacement of water molecules from both the hydration shell of the ion and the surface of the activated carbon, resulting in a net increase in the disorder of the system.53 Although classical thermodynamics provides indirect evidence of this phenomenon, molecular dynamics (MD) simulations could offer a direct molecular-level perspective, as this approach, combined with the thermodynamic parameters reported here, would enable a broader mechanistic understanding of Ca2+ adsorption onto activated carbons. Thus, the thermodynamic parameters indicate that the adsorption process is thermodynamically favorable and involves molecular reorganization at the solid liquid interface, consistent with recent studies on endothermic and exothermic adsorption processes in aqueous systems.54
Regarding the nature of the adsorption process (physical or chemical), its determination in activated carbons is challenging due to the coexistence of multiple mechanisms and and interactions that act simultaneously in these materials. The magnitude of ∆H0ads suggests that the adsorption process cannot be attributed exclusively to either pure physisorption or strong chemisorption. Instead, the observed thermodynamic behavior is consistent with the coexistence of multiple interactions, including electrostatic attraction between Ca2+ and negatively charged surface sites, ion exchange involving oxygenated and phosphate-containing functional groups, and weak surface complexation. Therefore, the thermodynamic parameters should be interpreted as reflecting the overall energetic contribution of these interactions rather than providing definitive evidence for a single adsorption mechanism. The observed ∆H0ads value represents an average energetic effect resulting from the combined contribution of these processes and does not necessarily indicate strong and irreversible chemisorption. Although the temperature range is relatively narrow and ∆H0ads is moderate (-18.76 kJ mol-1), the high correlation coefficient of the van’t Hoff plot (R2 = 0.969) indicates satisfactory agreement with the linear model, supporting the approximation that ∆H0ads remains approximately constant within the investigated temperature range. Thus, possible variations in the relative contributions of electrostatic attraction, ion exchange, and ion dehydration are not expected to significantly affect the interpretation of the adsorption process as spontaneous and exothermic.
The activation of biomass with H3PO4, in addition to increasing the porosity of the charcoal, can promote the incorporation of functional groups (phosphate and phosphonate) on the surface of the charcoal, as evidenced by the FTIR peak at 940 cm-1, attributed to P-O-C and P-O-P bonds. These groups can act as active sites for the removal of Ca2+, through an ion-exchange mechanism, involving the release of H+ from P-O-H groups and subsequent binding with Ca2+, or through inner-sphere complexation, in which the Ca2+ ion directly coordinates with the oxygens of phosphated groups.55 Therefore, the efficiency of activated carbon in removing Ca2+ should be attributed to a combination of factors, ranging from the increase in surface area and porosity, physical interactions, to the incorporation of phosphate groups as active sites for the complexation of cationic species.
TAC1:1-3-350 represents a promising biomass-based adsorbent. However, strategies can be envisioned to further develop TAC1:1-3-350 into an adsorbent with tailored properties, designed either for selective resource recovery56 or for targeted drug delivery systems.57,58 Such approaches, combined with the renewable and low-cost feedstock used for TAC production, could position this material as a versatile platform for both environmental remediation and water resource recovery applications.
Conclusions
This study demonstrated that TAC1:1-3-350, produced by chemical activation with phosphoric acid, is an effective and low-cost adsorbent for the removal of Ca2+ ions from aqueous solutions, with direct applicability to water softening. The material exhibited favorable physicochemical properties, including low pHpzc, adequate surface area, and predominantly microporous characteristics, which contributed to its high adsorption performance. The adsorption process followed Elovich kinetics and was well described by the Langmuir isotherm, with a maximum adsorption capacity of 25.26 mg g-1 and a removal efficiency of 84%. Thermodynamic results showed that Ca2+ adsorption is spontaneous and exothermic, predominantly governed by physical interactions, and accompanied by increased disorder at the solid-solution interface. Overall, the findings highlight the potential of tucum-derived activated carbon as a sustainable and efficient alternative adsorbent for mitigating hardness in groundwater and surface water, contributing to safer water supplies and environmental protection.
Although the results indicate the potential of the produced activated carbon for the removal of Ca2+ in aqueous medium, it becomes evident that further studies are necessary for real applications, including evaluation at higher concentrations and in complex matrices that present Mg2+, Na+ ions, as well as organic matter. Regeneration and reuse tests of the adsorbent also represent important future studies to be conducted. Practical application in groundwater treatment requires the development of continuous-flow systems, including adsorbent pelletization, hydrodynamic studies in fixed-bed columns, and validation in real matrices. These advances, combined with the present results, may establish TAC1:1 3 350 as a viable and low-cost alternative for water softening in decentralized settings or in regions with limited access to conventional technologies.
This study focuses on adsorption as the primary mechanism for Ca2+ removal in aqueous media; however, other technologies, such as membrane distillation59 and advanced oxidative processes combined with chelating agents,60 also offer alternative approaches depending on the target contaminant. The choice of method depends on factors such as contaminant concentration, presence of interfering species, operational cost, and available infrastructure. In this context, tucum-derived activated carbon, due to its simplicity of production and efficiency, shows promise for decentralized applications in vulnerable areas or as a pre-treatment step. Based on experimental data and estimated regional prices (residual biomass: US$ 0 0.02 kg 1; H3PO4: US$ 1.60 kg-1; electricity: US$ 0.16 kWh 1), the TAC1:1-3-350 production cost was approximately US$ 2.00 kg 1. With an adsorption capacity of 25.26 mg g-1 and a dosage of 3.2 g L-1 to reduce Ca2+ concentration from 100 to 20 mg L-1, the treatment cost was estimated at US$ 0.0006-0.006 per m3, significantly lower than commercial activated carbon (US$ 0.10 0.40 per m3)61 and ion-exchange resins (US$ 0.06-0.30 per m3).62 However, this preliminary estimate excludes labor, transportation, spent adsorbent disposal, and scale-related uncertainties; thus, pilot-scale studies are required to confirm economic feasibility under real conditions.
Acknowledgments
We acknowledge FAPEMA (BM-04049/23, fellowship to W. F. M.), PPGQ, the laboratory infrastructure of IFMA Campus Codó and IFMA Campus São Luís-Monte Castelo, and LABPEMOL and LabTAm (UFRN). We also acknowledge ChatGPT (OpenAI, version GPT-5.3) for assistance with language translation and graphical abstract development. The scientific analysis, interpretation of the results, and conclusions were not compromised by its use. The authors take full responsibility for the content of the manuscript.
Data Availability Statement
All data are available in the text.
References
-
1 Han, X.; Boota, M. W.; Soomro, S. E. H.; Ali, S.; Soomro, S. G. H.; Soomro, N. E. H.; Soomro, M. H. A. A.; Soomro, A. R.; Batool, S.; Bai, Y.; Shi, X.; Guo, J.; Li, Y.; Hu, C.; Tayyab, M.; Appl. Water Sci. 2024, 14, 154. [Crossref]
» Crossref -
2 Instituto Brasileiro de Geografia e Estatística (IBGE); Pesquisa Nacional por Amostra de Domicílios Contínua - PNAD Contínua; IBGE: Rio de Janeiro, 2022. [Link] accessed in July 2026
» Link -
3 Müller, A. L. C.; Severo, L. G. R.; Souza, B. S.; Bueno, C. G.; Osório, D. M. M.; Berlese, D. B.; Rev. Águas Subterranêas 2022, 36, e-30182. [Crossref]
» Crossref -
4 World Health Organization (WHO); Guidelines for Drinking-Water Quality: 4th Edition Incorporating the 1st and 2nd Addenda; WHO: Geneva, 2022. [Link] accessed in July 2026
» Link -
5 Rajan, M.; Karunanidhi, D.; Jaya, J.; Preethi, B.; Subramani, T.; Aravinthasamy, P.; Phys. Chem. Earth 2024, 135, 103637. [Crossref]
» Crossref -
6 Patle, A.; Kurrey, R.; Deb, M. K.; Oatle, T. K.; Sinha, D.; Shrivas, K.; J. Indian Chem. Soc. 2022, 99, 100545. [Crossref]
» Crossref -
7 Quinn, C. W.; Cate, M. D.; Miller-Lionberg, D. D.; Reilly, T.; Volckens, J.; Henry, C. S.; Environ. Sci. Technol. 2018, 52, 3567. [Crossref]
» Crossref -
8 Walker, M. D.; Shane, E.; JAMA, J. Am. Med. Assoc. 2022, 328, 1624. [Crossref]
» Crossref -
9 Mafi, A.; Khayati, G.; Korean Chem. Eng. Res. 2021, 59, 219. [Crossref]
» Crossref -
10 Yu, Y.; Jun, H.; Jin, X.; Yan, R.; Zhang, L.; Chen, X.; Ind. Eng. Chem. Res. 2018, 57, 6585. [Crossref]
» Crossref -
11 Wang, L.; Lin, S.; Environ. Sci. Technol. 2019, 53, 5797. [Crossref]
» Crossref -
12 Alves, J. V. S.; Pires, N. J.; Oliveira, M. S.; Tecnol. Metal., Mater. Min. 2023, 20, e2744. [Crossref]
» Crossref -
13 Wei, F.; Zhu, Y.; He, T.; Zhu, S.; Wang, T.; Yao, C.; Yu, C.; Huang, P.; Li, Y., Zhao, Q.; Song, W.; ACS Omega 2022, 7, 46288. [Crossref]
» Crossref -
14 Zhang, C.; Fang, J.; Xu, X.; Zhang, M.; Han, Z.; Liao, J.; Ann. N. Y. Acad. Sci. 2025, 1552, 388. [Crossref]
» Crossref -
15 Medeiros, D. C. C. S.; Usman, M.; Chelme-Ayala, P.; El-Din, M. G.; Energy Environ. Sustainability 2025, 1, 100028. [Crossref]
» Crossref -
16 Lu, J. Y.; Bu, Z. Q.; Lei, Y. Q.; Wang, D.; He, B.; Wang, J.; Huang, W. T.; J. Mol. Liq. 2024, 409, 125503. [Crossref]
» Crossref -
17 Al-Mhyawi, S. R.; Bader, D. M. D.; Bajaber, M. A.; Dayem, S. M. A. E.; Ragab, A. H.; El-Rahem, K. A. A.; Gado, M. A.; Atia, B. M.; Cheira, M. F.; J. Mater. Res. Technol. 2023, 22, 3058. [Crossref]
» Crossref -
18 Yağmur, H. K.; Kaya, I.; J. Mol. Struct. 2021, 1232, 130071. [Crossref]
» Crossref -
19 Ilyas, M.; Liao, Y.; Xu, J.; Wu, S.; Liao, W.; Zhao, X.; Desalin. Water Treat. 2024, 317, 100115. [Crossref]
» Crossref -
20 Ahmad, M. A.; Daud, W. W.; Aroua, M. K.; Colloids Surf., A 2008, 312, 131. [Crossref]
» Crossref -
21 Shukla, N.; Sahoo, D.; Remya, N.; J. Cleaner Prod. 2019, 235, 1073. [Crossref]
» Crossref -
22 Oliveira, M. S. P.; Olivera, N. P.; Abreu, L. F.; Paracampo, N. E. N. P. In Espécies Nativas da Flora Brasileira de Valor Econômico Atual ou Potencial: Plantas para o Futuro: Região Norte; Coradin, L.; Camillo, J.; Vieira, I. C. G., eds.; Ministério do Meio Ambiente: Brasília, 2022, ch. 5 [Link] accessed in July 2026; ASTM C831-18: Standard Test Methods for Residual Carbon, Apparent Residual Carbon, and Apparent Carbon Yield in Coked Carbon-Containing Brick and Shapes, Philadelphia, 2023; ASTM D2867-23: Standard Test Methods for Moisture in Activated Carbon, Philadelphia, 2023; ASTM D2866-11: Standard Test Method for Total Ash Content of Activated Carbon, Philadelphia, 2025.
» Link -
23 Wang, J.; Guo, X.; J. Hazard. Mater. 2020, 390, 122156. [Crossref]
» Crossref -
24 Han, Q.; Wang, J.; Goodman, B. A.; Xie, J.; Liu, Z.; Powder Technol. 2020, 366, 239. [Crossref]
» Crossref -
25 Ebelegi, A. N.; Ayawei, N.; Wankasi, D.; Open J. Phys. Chem. 2020, 10, 166. [Crossref]
» Crossref -
26 Machado, R. B.; Dias, S. L. P.; Vaghetti, J. C. P.; Machado, G. B.; Bianchi, O.; Quim. Nova 2021, 47, e-20230086. [Crossref]
» Crossref -
27 Silva, F. A.; Cantanhede, L. B.; Marques, I. S.; de Figueredo, G. P.; Quim. Nova 2024, 47, e-20230106. [Crossref]
» Crossref -
28 Poothorn, W.; Sriruttha, M.; Homchan, P.; Chanthai, S.; Ruangviriyachai, C.; Chem. Eng. Res. Des. 2011, 89, 335. [Crossref]
» Crossref -
29 Bentes, V. L. I.; Nobre, F. X.; Barros, I. C. L.; Couceiro, P. R. C.; Environ. Nanotechnol., Monit. Manage. 2021, 16, 100520. [Crossref]
» Crossref -
30 Faraji, M.; Saidi, M.; Process Saf. Environ. Prot. 2023, 171, 874. [Crossref]
» Crossref -
31 Montfort, G. R. C.; Azamar-Barrio, J. A; Quintana-Owen, P.; Rejón-Moo, V.; González-Gómez, W. S.; Madera-Santana, T. J.; Chemistry 2025, 7, 88. [Crossref]
» Crossref -
32 Sing, K. S. W.; Everett, D. H.; Haul, R. A. W.; Moscou, L.; Pierotti, R. A.; Rouquérol, J.; Siemieniewska, T.; Pure Appl. Chem. 1985, 57, 603. [Crossref]
» Crossref -
33 Thommes, M.; Kaneko, K.; Neimark, A. V.; Oliver, J. P.; Rodriguez-Reinoso, F.; Rouquerol, J.; Sing, S. W.; Pure Appl. Chem. 2015, 87, 1051. [Crossref]
» Crossref -
34 Tounsadi, H.; Khalidi, A.; Machruouhi, A.; Farnane, M.; Elmoubarki, R.; Elhalil, A.; Sadiq, M.; Barka, N.; J. Environ. Chem. Eng. 2016, 4, 4549. [Crossref]
» Crossref -
35 Rajesh, Y.; Pilli, S. R.; Ali, W.; Motana, S.; Khan, M. E.; Bashiri, A. H.; Zakri, W.; Chemosphere 2023, 341, 139944. [Crossref]
» Crossref -
36 Zhu, H.; Yang, F.; Zhu, Y.; Li, A.; He, W.; Huang, J.; Li, G.; RSC Adv. 2020, 10, 8628. [Crossref]
» Crossref -
37 Haryanti, N. H.; Suarso, E.; Manik, T. N.; Suryajaya; Sari, N.; Darminto; J. Renewable Mater. 2024, 12, 203. [Crossref]
» Crossref -
38 Mamaní, A.; Ramírez, N.; Deiana, C.; Giménez, M.; Sardella, F.; J. Environ. Chem. Eng. 2019, 7, 103148. [Crossref]
» Crossref -
39 Mbarki, F.; Selmi, T.; Kesraoui, A.; Seffen, M.; Ind. Crops Prod. 2022, 178, 114546. [Crossref]
» Crossref -
40 Elhefnawy, O. A.; Elabd, A. A.; Pigm. Resin Technol. 2024, 53, 576. [Crossref]
» Crossref -
41 Shao, F.; Zhang, X.; Sun, X.; Shang, J.; J. Dispersion Sci. Technol. 2021, 42, 1274. [Crossref]
» Crossref -
42 Wang, Y.; Zhang, Y.; Li, S.; Zhong, W.; Wei, W.; J. Mol. Liq. 2018, 268, 658. [Crossref]
» Crossref -
43 Wang, M.; Huanh, Z. H.; Liu, G.; Kang, F.; J. Hazard. Mater. 2011, 190, 1009. [Crossref]
» Crossref -
44 Zhao, F.; Shan, R.; Gu, J.; Zhang, Y.; Yuan, H.; Chen, Y.; ACS Omega 2022, 7, 8844. [Crossref]
» Crossref -
45 Laksaci, H.; Khelifi, A.; Belhamdi, B.; Trari, M.; J. Environ. Chem. Eng. 2017, 5, 5061. [Crossref]
» Crossref -
46 Wang, J.; Guo, X.; Chemosphere 2020, 258, 127279. [Crossref]
» Crossref -
47 Udawatta, M. M.; Silva, R. C. L.; Silva, D. S. M.; J. Sci. Univ. Kelaniya 2021, 14, 66. [Crossref]
» Crossref -
48 Mendonça, J. C.; Cantanhede, L. B.; Rojas, M. O. A. I.; Rangel, H. G.; Bezerra, C. W. B.; Water Supply 2022, 1, 481. [Crossref]
» Crossref -
49 Kurniasari, I. T.; Riyanto, C. A.; Martono, Y.; Stannum 2020, 2, 57. [Crossref]
» Crossref -
50 Yanti, W.; Sosidi, H.; Indriani; Prismawiryanti; Puspitasari, D. J.; Mirzan, M.; Rahim, E. A.; Inda, N. I.; Kovalen 2023, 9, 157. [Crossref]
» Crossref -
51 Zhou, L.; Zhong, M. Q.; Wang, T.; Liu, J. X.; Mei, M.; Chen, S.; Li, J. P.; Materials 2022, 15, 7112. [Crossref]
» Crossref -
52 Chouchane, T.; Boukari, A.; Khireddine, O.; Chibani, S.; Chouchane, S.; J. Eng. Appl. Sci. 2023, 70, 58. [Crossref]
» Crossref -
53 Yoshida, Y.; Shimada, T.; Ishida, T.; Takagi, S.; RSC Adv. 2020, 10, 21360. [Crossref]
» Crossref -
54 Venegas-García, D. J.; Wilson, L. D.; Materials 2023, 16, 655. [Crossref]
» Crossref -
55 Wang, B.; Lan, J.; Bo, C.; Gong, B.; Ou, J.; RSC Adv. 2023, 13, 4275. [Crossref]
» Crossref -
56 Eissa, M. E.; Abdel-Megid, M.; Atia, M.; Gado, M. A.; Cheira, M. F.; Hassanein, T. F.; Abdelmonem, H. A.; RSC Adv. 2026, 16, 2504. [Crossref]
» Crossref -
57 Li, W. Q.; Wu, J. Y.; Xiang, D. X.; Lou, S. L.; Hu, X. B.; Tang, T. T.; Sun, T. L.; Liu, X. Y.; Int. J. Nanomed. 2019, 14, 8345. [Crossref]
» Crossref -
58 Li, W.; Wu, J.; Zhang, J.; Wang, J.; Xiang, D.; Luo, S.; Li, J.; Liu, X.; Drug Delivery 2018, 25, 827. [Crossref]
» Crossref -
59 Gaur, D.; Singh, K.; Upadhyaya, S.; Asian J. Water, Environ. Pollut. 2024, 21, 77. [Crossref]
» Crossref -
60 Jiang, F.; Zhang, Y.; Xu, X.; Mao, Y.; Wang, M.; Yang, B.; Zhang, C.; Feng, X.; Meng, H.; Guo, F.; Han, Q.; Zhang, S.; J. Environ. Chem. Eng. 2025, 13, 117556. [Crossref]
» Crossref -
61 Das, S.; Thote, K. K.; Halder, G.; Baskar, G.; Rano, R.; Rokhum, S. L.; Biomass Bioenergy 2026, 212, 109315. [Crossref]
» Crossref -
62 Stamer, K.; Baltaeva, M.; Manakhov, A.; Orlov, M.; Ayirala, S.; Cha, D. K.; Mater. Chem. Phys. 2025, 339, 130548. [Crossref]
» Crossref
Edited by
-
Editor handled this article:
Adriana Nunes Correia (Associate)