Vibrational Modes and Intermolecular Weak Interactions in Salicylic Acid and Acetylsalicylic Acid: A Combined Terahertz Spectroscopy and DFT Study
Abstract
Terahertz time-domain spectroscopy (THz-TDS) was used to measure the absorption spectra of salicylic acid (SA) and acetylsalicylic acid (ASA) from 0.4 to 2.0 THz. Theoretical calculations were performed using the B3LYP-D3 and M06-2X methods within the density functional theory (DFT) framework. Comparative analysis showed that B3LYP-D3 results aligned more closely with experimental data. To understand the origins of absorption peaks, the potential energy distribution method (PED) assigned corresponding vibration modes, revealing that peaks of SA stem mainly from bond angle bending, while those from ASA arise from both bond angle bending and dihedral angle torsion. Qualitative and quantitative analyses of weak intermolecular interactions using interaction region indicator (IRI), energy decomposition analysis based on force field (EDA-FF), and electrostatic potential (ESP) methods indicated that electrostatic interactions primarily influence hydrogen bonds, while dispersion effects act on carbon and oxygen atoms, contributing significantly to total binding energy. This study links terahertz spectral differences to weak intermolecular interactions, enhancing understanding of molecular structures and guiding material applications.
Keywords:
THz-TDS; DFT; vibration modes; weak interactions; hydrogen bond
Introduction
Salicylic acid (SA) is a vital organic synthetic raw material, with widespread applications in various fields such as pharmaceuticals, pesticides, rubber, dyes, food, and fragrances.1-4 Within the medical realm, it is primarily employed for pain and fever relief, in addition to exhibiting anti-inflammatory properties.5,6 Moreover, SA serves as a key precursor for synthesizing compounds such as sodium salicylate, oil of wintergreen. Acetylsalicylic acid (ASA), also known as aspirin, it was first acknowledged for its ability to reduce inflammation and relieve pain, holds significant medical research value.7 As research on ASA progresses, numerous novel applications have been uncovered. For instance, it can mitigate the risk of myocardial infarction,8 reduce stroke mortality,9 and lower the incidence of colorectal cancer.10 Recent studies indicate that ASA can prevent platelet aggregation, thereby achieving an antithrombotic effect.11 Furthermore, low-dose ASA can prevent hypertension and myocardial fibrosis.12,13 Notably, ASA has also demonstrated efficacy in the treatment of coronavirus disease (COVID-19).14,15 Given their physicochemical properties and promising application prospects, the study of SA and ASA remains a focal point in relevant fields.
As typical active pharmaceutical ingredients, SA and ASA mainly rely on intermolecular weak interactions to maintain their crystal structures and functional properties. Intermolecular weak interactions, including hydrogen bonds, van der Waals forces, and π-π stacking, serve as the fundamental driving forces that determine the crystal packing, stability, solubility, and bioavailability of pharmaceutical materials.16-18 In particular, the precise identification and regulation of weak interactions have become core scientific issues in modern drug crystal engineering and pharmaceutical cocrystal design. By rationally modulating weak interactions between active pharmaceutical ingredients and suitable cocrystal formers, it is possible to significantly improve the physicochemical and pharmacological properties of drugs without altering their molecular structures.19-21 Therefore, in depth research on weak interactions is not only theoretically important for revealing structure and activity relationships but also practically valuable for guiding the rational design, preparation, and performance optimization of drug cocrystals.22,23
Benefiting from their high sensitivity to low-frequency vibrational modes, terahertz time-domain spectroscopy (THz-TDS) combined with density functional theory (DFT) has developed rapidly in the field of weak interaction analysis. In recent years, this combination has become a mainstream technical approach for investigating intermolecular weak interactions of pharmaceutical molecules, with a series of high-value research achievements emerging. Zhang et al.24 characterized ternary cocrystals using THz-TDS and simulated the possible forms of hydrogen bonds in cocrystals using DFT. They analyzed the vibration modes of cocrystals and explored the effects of hydrogen bonds on molecules. The study provides rich data and unique methods for analyzing the structure and intermolecular interactions of ternary cocrystals. Qin et al.25 synthesized theophylline-nicotinamide drug cocrystals using the solid-phase grinding method, optimized its crystal structure and clarified its vibration mode using DFT, and explored intermolecular interactions by combining an independent gradient model based on Hirshfeld partition analysis and Hirshfeld surface analysis. This provides key support for the analysis and design optimization of weak interactions in pharmaceutical cocrystals. Yang et al.26 synthesized nitrofurantoin-nicotinamide-fumarate cocrystals by dry grinding, and characterized them by powder X-ray diffraction (PXRD), terahertz, Raman, and infrared spectroscopy, confirming that they form a new crystal phase bound by intermolecular hydrogen bonds. The study also utilized DFT to optimize the cocrystal structure, analyzed weak interaction characteristics such as Hirshfeld surfaces and hydrogen bonding, and determined the vibration modes. The related results provide important structural insights for customizing drug properties at the molecular level, with both scientific value and application potential. These latest studies have continuously improved the methodological system for exploring weak interactions between drug molecules using THz combined with DFT, and have demonstrated that in-depth analysis of the types and strengths of weak interactions is the key to revealing the structure activity relationship of pharmaceutical materials.
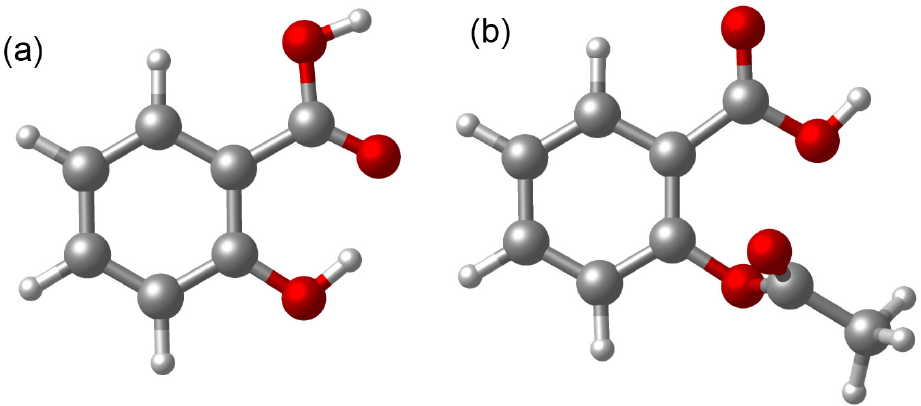
Against this background, this study measured the THz absorption spectra of SA and its derivative ASA using THz-TDS technology. The DFT method was employed to calculate the theoretical spectra of the two substances, and their spectral vibration characteristics were elucidated through potential energy distribution (PED) analysis. The weak intermolecular interactions were analyzed qualitatively and quantitatively using interaction region indicator (IRI), energy decomposition analysis based on force-field (EDA FF), and in conjunction with the electrostatic potential (ESP) methods. This research focuses on SA and its derivative ASA, whose monomolecular structures are depicted in Figure 1. SA molecules primarily comprise functional groups such as benzene rings, hydroxyl groups, and carboxyl groups, while ASA is formed through the acetylation of SA.
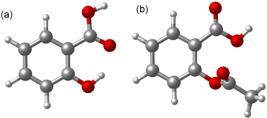
Monomolecular structures of (a) SA and (b) ASA. Oxygen, hydrogen, and carbon atoms are distinguished by red, white, and gray, respectively.
Experimental
Experimental platform
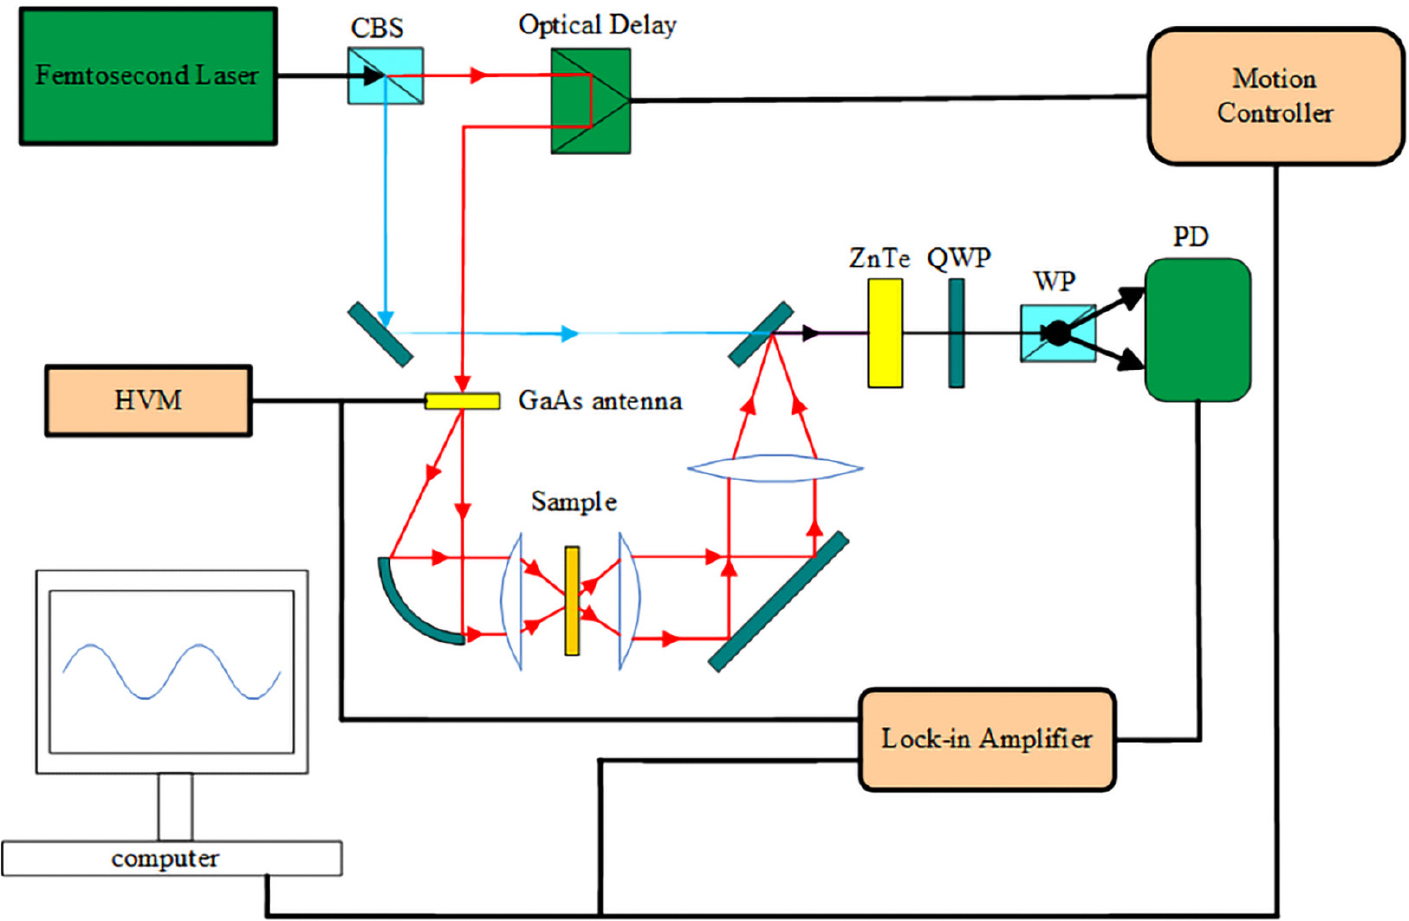
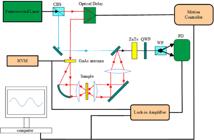
The terahertz measurements were conducted using a THz-TDS system (model Z-3, Zomega Corporation, USA), whose schematic is presented in Figure 2.27,28 The system operates at a repetition rate of 82 MHz, generating 100 fs pulses with a central wavelength of 780 nm. Its core components include an ultrafast femtosecond fiber laser, a terahertz radiation source, a terahertz detector, and a time-delay control system.
Experimental sample
SA and ASA were purchased from Shanghai Macklin Biochemical Technology Co., Ltd. with a purity of 99%, which met the experimental requirements and required no further purification. The samples were vacuum-dried at 50 °C for 2 h to eliminate trace moisture. Subsequently, each dried sample was mixed with polyethylene powder at a mass ratio of 3:1 and homogenized by mortar grinding. An aliquot of 200 mg of the ground mixture was accurately weighed and transferred into a 13 mm diameter cylindrical mold, then pressed into uniform pellets using a JZ-P-60 powder tablet press under a uniaxial pressure of 10 MPa following a specific pressure-time profile: the pressure was linearly increased to 10 MPa within 10 s, held constant for 60 s to ensure uniform compaction, and finally released gradually within 5 s. This compression process yielded smooth, crack-free circular pellets with a consistent diameter of 13 mm and thickness of 1.2 mm,29 all meeting the experimental criteria. Notably, the sample quality remained stable throughout the experiment without temporal changes, and the entire preparation process exhibited good repeatability.
All THz spectral measurements were performed under a controlled environmental condition: temperature of 25 °C, and the relative humidity in the sample chamber is strictly controlled below 2%. The constant low humidity was maintained using a nitrogen purge system to avoid terahertz wave absorption by water vapor, and the constant temperature ensured the stability of sample crystal structure and spectral signals.
Theoretical methods
Theoretical model
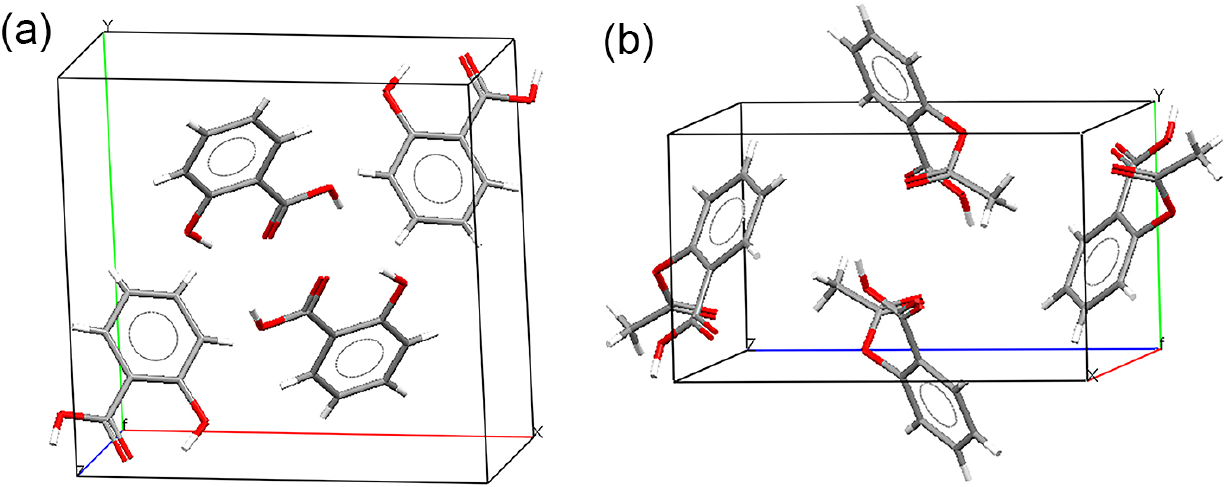
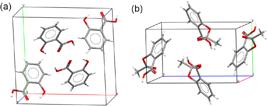
The initial structures of SA and ASA are sourced from the Cambridge Crystal Database (CCDC), as shown in Figure 3 for their crystal cell structures. The SA unit cell parameters are as follows: space group number P21/a, a = 11.520 Å, b = 11.210 Å, c = 4.920 Å, α = γ = 90.00°, β = 90.83°, V = 635.298 Å3, the single crystal cell contains four single molecules. The ASA unit cell parameters are as follows: space group number P21/c, a = 11.430 Å, b = 6.591 Å, c = 11.395 Å, α = γ = 90.00°, β = 95.68°, V = 854.229 Å3, the single crystal cell contains four single molecules.
Based on these solid-state crystal structures, two density functionals, B3LYP-D3 and M06-2X, with the 6-311G** basis set were chosen for comparative simulations. B3LYP-D3 is a generalized gradient approximation functional with empirical D3 dispersion correction and has been widely validated for accurately describing intermolecular weak interactions including hydrogen bonds and van der Waals forces in solid-state systems. M06 2X is a meta-GGA functional optimized for main-group thermochemistry, kinetics and noncovalent interactions in gas-phase or small molecular clusters and its inclusion enables a comparative analysis of different functional performance in crystal lattice simulations. The selection also considers compatibility with the requirements of THz spectral simulation since THz spectra of molecular crystals are dominated by low-frequency intermolecular vibrations that depend on accurate descriptions of long-range dispersion forces and lattice packing effects. B3LYP-D3 is chosen for its built-in dispersion correction that can effectively account for van der Waals interactions and M06-2X is included to evaluate how functional types and dispersion treatment strategies impact simulation accuracy.
PED method
PED analysis decomposes normal vibrational modes, quantifying the relative contribution of molecular groups to specific vibrations via percentage evaluation. This enables effective identification of dominant vibrational types and their fundamental characteristics.30 The PED for the i-th valence force coordinate in the k-th normal mode is calculated as:
where FS is the force constant matrix under internal coordinates, and LS is the eigenvector matrix.
Interaction region indicator
The IRI method, proposed by Lu et al.31 in 2021, is an optimized variant of the reduced density gradient (RDG) approach.32 It visually presents the type, strength, and spatial distribution of intermolecular interactions via iso-surfaces, with a straightforward functional definition:
In the formula, ∇ is the gradient operator, ρ(r) is the electron density, and a is a variable parameter. Generally speaking, the value of a is taken as 1.1.
Energy decomposition analysis based on forcefield
EDA-FF decomposes total inter-fragment interaction energy into physically interpretable components, facilitating systematic investigation of molecular interaction mechanisms.33 Non-covalent interactions primarily include electrostatic and van der Waals contributions. The electrostatic interaction between two atoms is expressed as:
In this formula, r is the distance between the atoms, q denotes the atomic charge, and A and B represent the atomic labels. The van der Waals interaction can be divided into repulsive and dispersive components, which are calculated by the following formulas:
Here, R0 is the non-bonding distance between the atoms, and ε represents the depth of the van der Waals potential well.
Electrostatic potential
Hydrogen bonds, halogen bonds, and dihydrogen bonds are predominantly governed by electrostatic interactions between permanent dipoles. Molecular surface electrostatic potential intuitively reflects intermolecular electrostatic interactions, enabling prediction and explanation of hydrogen bond binding modes, strength, reactivity, and charge distribution.34,35 The ESP at a point in space around a molecule is defined as the work required to move a unit positive charge from the zero-potential surface to that point:
In the equation, Zi is the charge on the nucleus i located at the ri position, and the parameter ρ(r’) represents the total electron density. The positive or negative value of VS(r) indicates that the current position is dominated by nuclear or electronic charges.
Results and Discussion
Terahertz spectral analysis
This study used Gaussian 16 software (version: Gaussian 16 Rev. A.03, Gaussian Inc., Wallingford, Connecticut, United States, 2016) to conduct DFT theoretical calculations. The overall process is as follows: first, obtain the crystal structures of SA and ASA from the CCDC and convert them into calculation input files to complete the initial structural model construction. On this basis, molecular geometry optimization is carried out with strict convergence criteria (maximum force ≤ 0.000450 Hartree / Å, root mean square (RMS) force ≤ 0.000300 Hartree / Å, maximum displacement ≤ 0.001800 Å, RMS displacement ≤ 0.001200 Å) to determine convergence through displacement and force, find the minimum point of potential energy surface of the system, and obtain a stable equilibrium structure with lower energy, laying the foundation for subsequent calculations. Finally, based on the optimized balanced structure, frequency calculation is carried out using theoretical methods and basis sets consistent with geometric optimization, ensuring that the calculation results are free of imaginary frequencies and guaranteeing the effectiveness and accuracy of spectral calculation results.
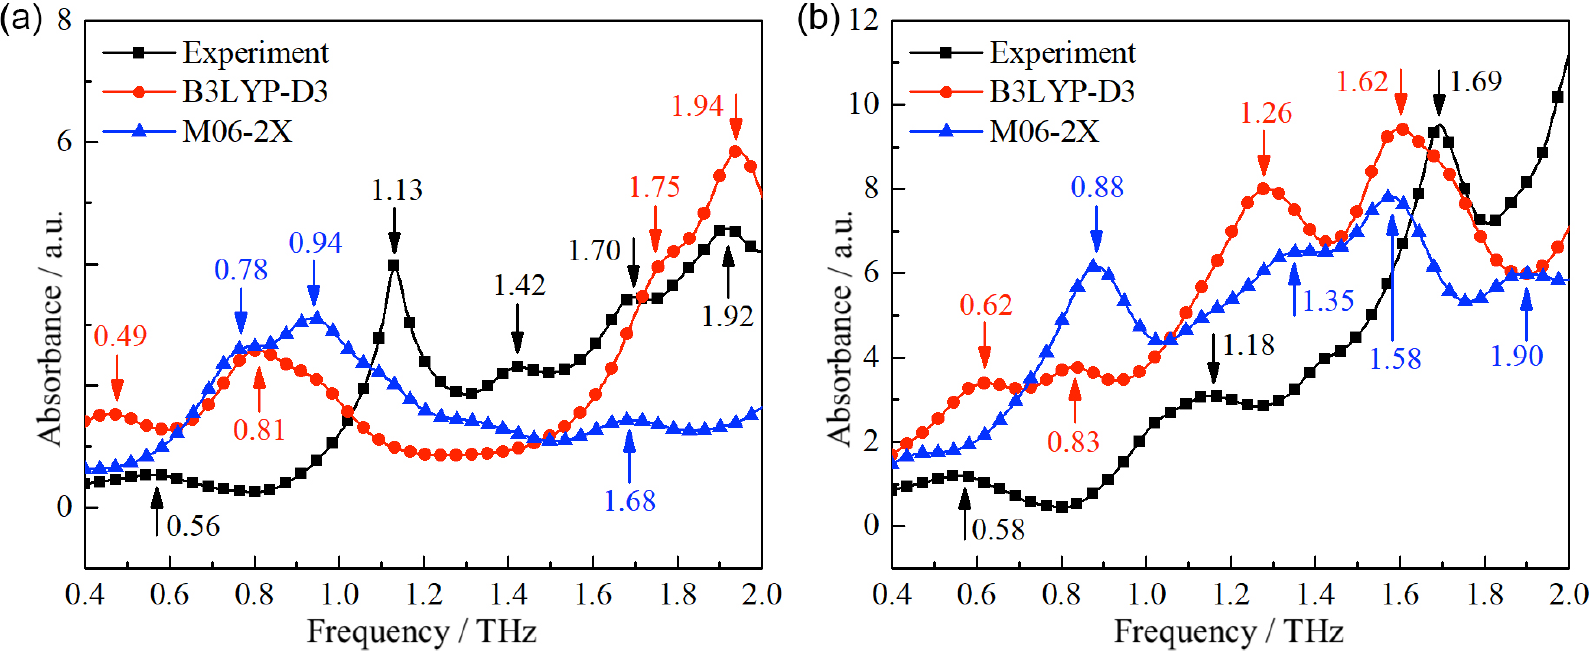
Based on the DFT calculation process described earlier, we simulated the terahertz spectra of SA and ASA using M06-2X and B3LYP-D3 functionals, respectively. During this process, both methods uniformly use the 6-311G** basis set. The final experimental and theoretical simulation results of terahertz spectra are shown in Figure 4. For SA, the experimental absorption peaks are located at 0.56, 1.13, 1.42, 1.70, and 1.92 THz. The spectrum simulated by the M06 2X functional shows peaks at 0.78, 0.94, and 1.68 THz, among which only the peak at 1.68 THz matches the experimental peak at 1.70 THz. In contrast, the B3LYP D3 method yields four distinct absorption peaks, among which 0.49, 1.75, and 1.94 THz correspond well to the experimental peaks at 0.56, 1.70, and 1.92 THz, respectively. The maximum deviation between simulated and experimental peak positions is only 0.07 THz, indicating significantly better consistency. For ASA, the peaks predicted by M06 2X at 0.88, 1.35, 1.58, and 1.90 THz deviate substantially from the experimental values. In addition, complementary analysis confirms that B3LYP D3 provides a more balanced description of both intramolecular and intermolecular interactions than M06 2X. Therefore, the B3LYP D3 functional is employed for all subsequent analyses of intermolecular interactions.
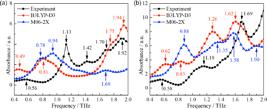
The poor performance of M06 2X arises from several inherent drawbacks. First, it lacks default empirical dispersion correction, leading to insufficient description of van der Waals forces in the crystal lattice, to which THz spectra are highly sensitive. Second, M06 2X is parameterized for gas phase molecules rather than periodic solid state systems, making it unable to properly reproduce the collective lattice vibrations that dominate the terahertz region. Third, its high Hartree-Fock (HF) exchange ratio (54%) overestimates repulsive interactions and distorts both molecular packing and hydrogen bonding characteristics, resulting in large frequency shifts in the low frequency THz region. In comparison, B3LYP D3 incorporates the Grimme D3 dispersion scheme, is compatible with periodic boundary conditions, and uses a moderate 20% HF exchange component, enabling a balanced and accurate description of both covalent and noncovalent interactions. Consequently, the THz spectra simulated by B3LYP D3 agree excellently with experimental measurements, with a maximum peak error below 0.07 THz.
Although the B3LYP-D3 method exhibits good consistency with the experimental results, a small residual deviation (up to 0.07 THz) still exists, which is attributed to multiple factors. The 6-311G** basis set cannot fully depict the electronic interactions within the crystals of SA and ASA. Larger basis sets can make the deviation smaller, but they will make the calculations much harder. Theoretical calculations are done at 0 K and do not consider heat movement, but experiments at 25 °C make the absorption peaks shift a bit to the red. Also, the SA and ASA pellets have some small crystal flaws, which make the terahertz absorption peaks wider and move a bit. Plus, the model simplifies crystal vibration and does not take into account the weak connection between nearby molecular vibrations, and that also makes the peak positions a bit off.
Vibration analysis
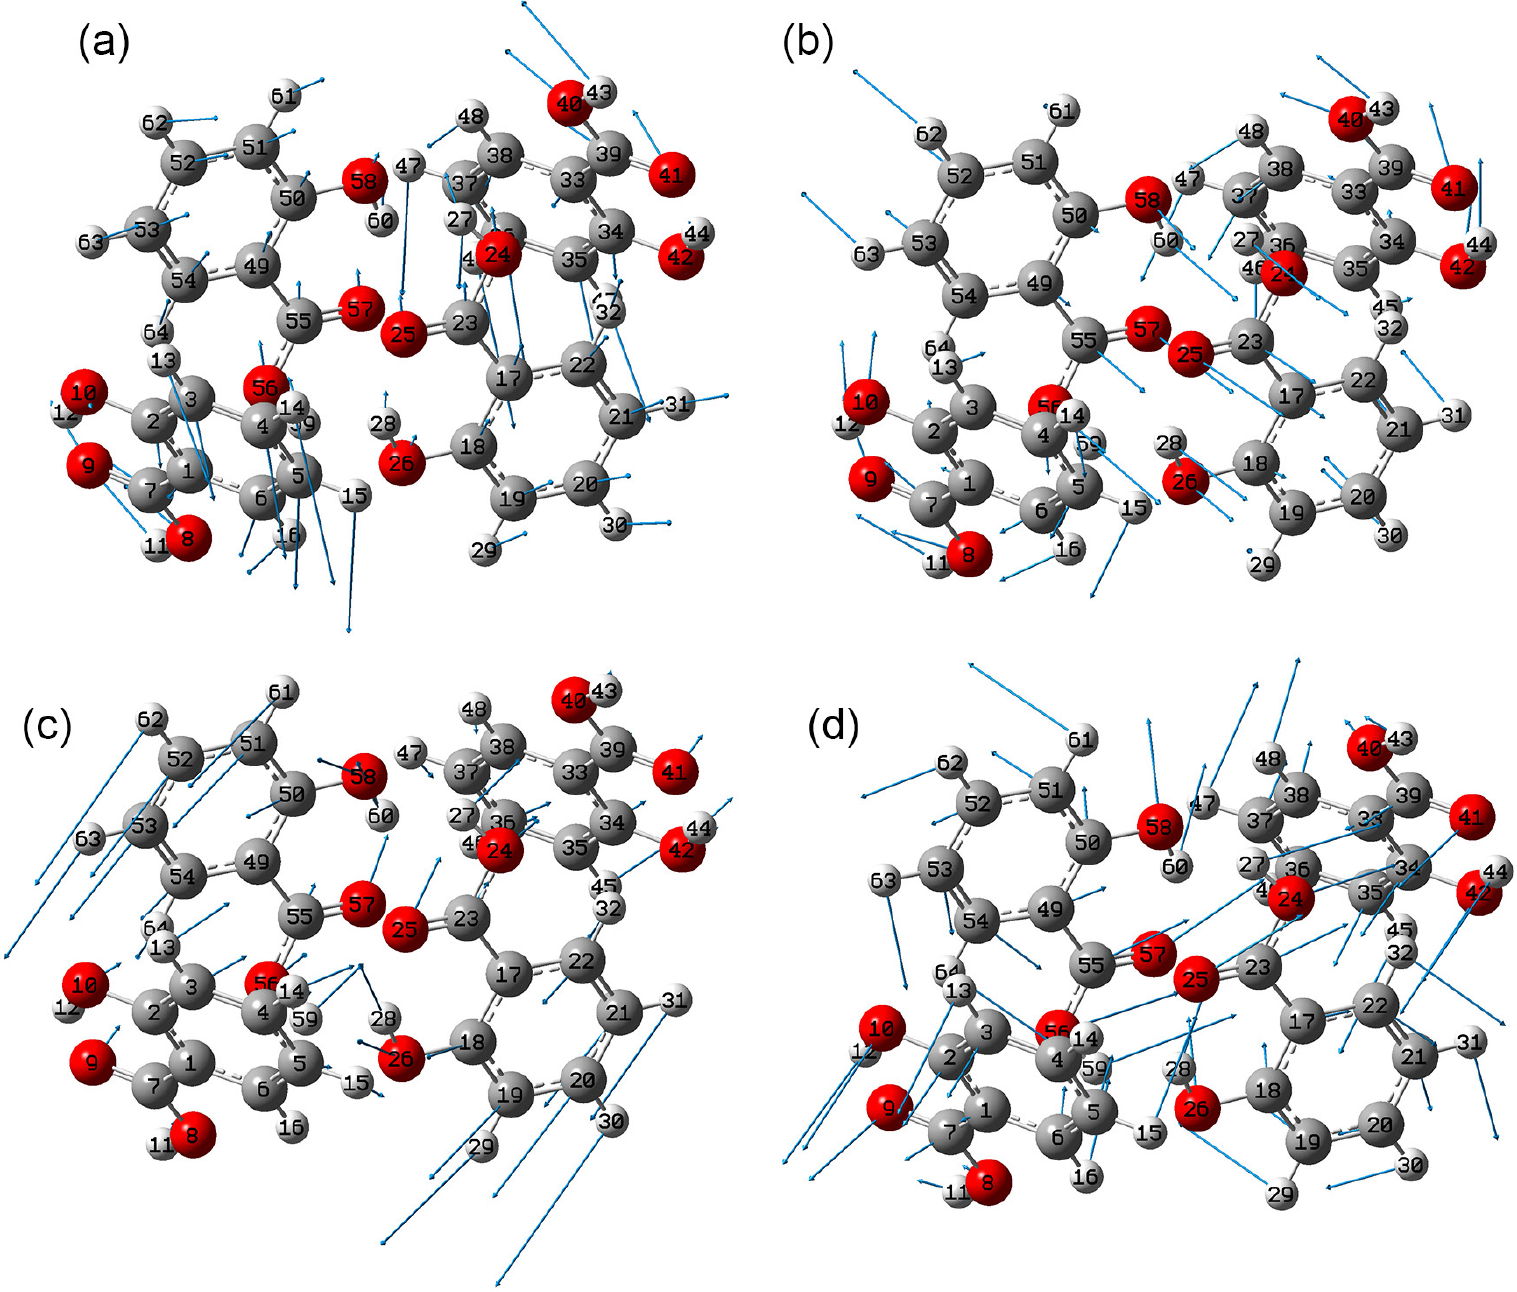
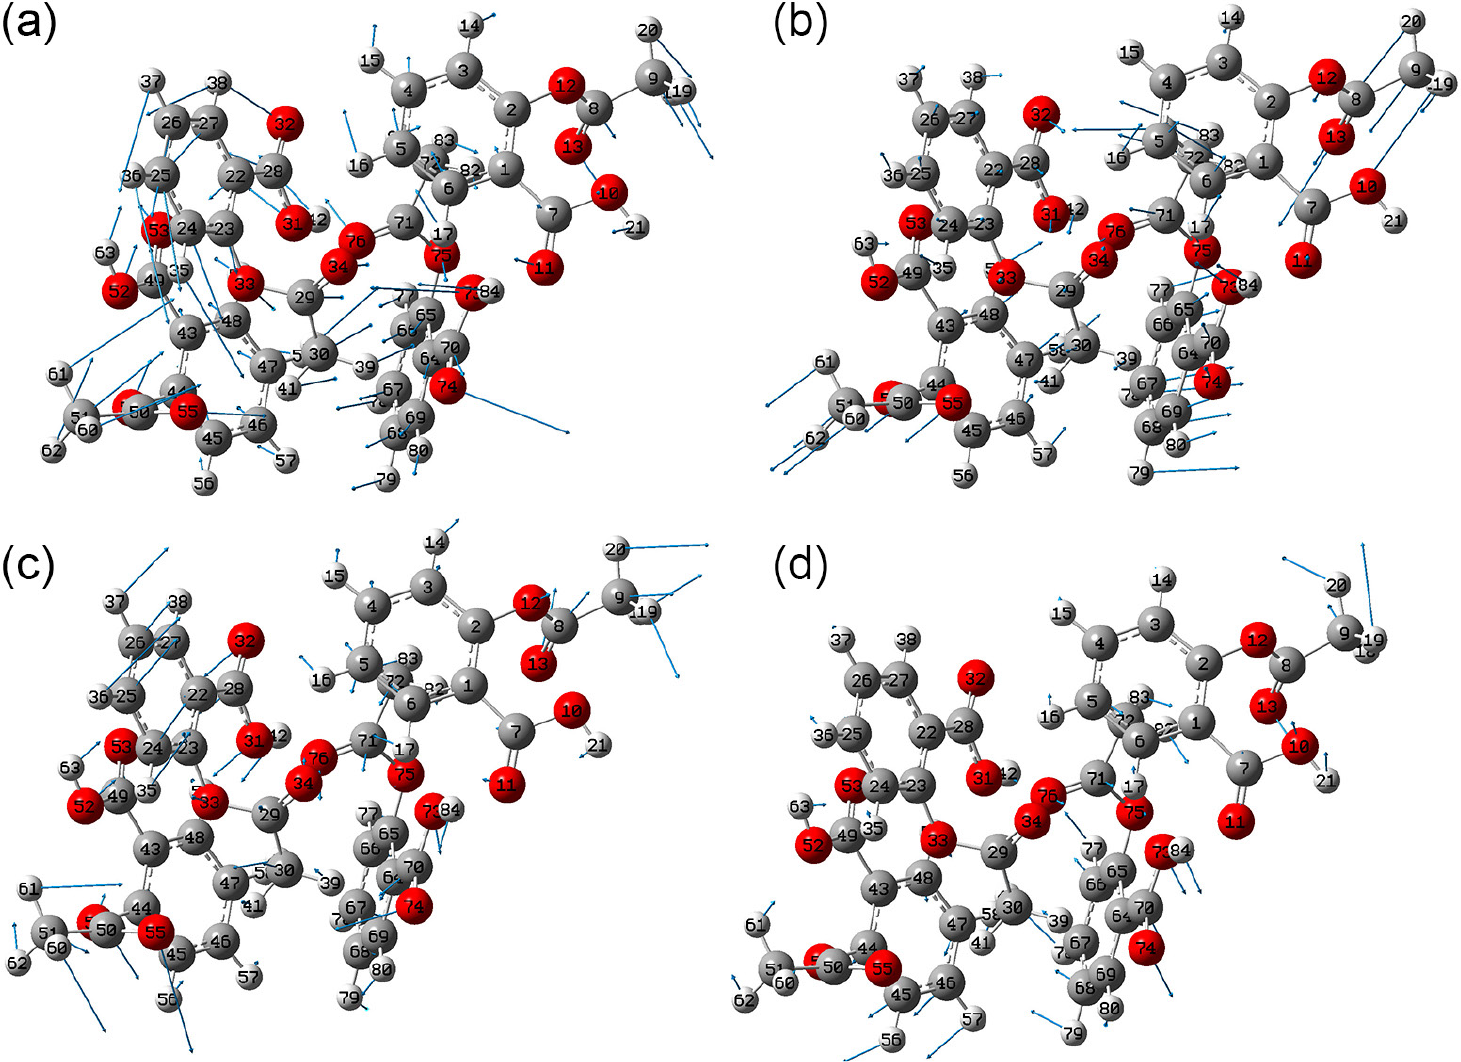
To explore the origin of each absorption peak in the terahertz spectra of SA and ASA, PED analysis was conducted. This analysis can be performed using VEDA software (version: 4.0, Jamróz, M. H.; University of Warsaw, Warsaw, Poland, 2010). By utilizing it, we identified the canonical characteristics of each vibrational mode. The corresponding data are presented in Table 1, which offers a clear view of the contribution of each atomic motion to the peaks. Additionally, the visualization software Gauss View (version: 6.0.16, Gaussian Inc., Wallingford, Connecticut, United States, 2016) was employed to construct three-dimensional models of the vibrational modes corresponding to each peak. The behavior of atomic motion is illustrated in Figures 5 and 6.
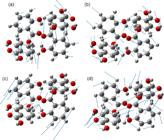
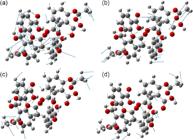
Figure 5 illustrates the vibration modes of SA, where carbon, hydrogen, and oxygen atoms are represented in gray, white, and red, respectively. The directional arrows in the figure indicate the direction of atomic displacement, and the length of the arrows corresponds to the relative intensity of atomic vibration amplitude, with longer arrows representing a larger vibration range of atoms. According to Table 1, the vibration mode at 0.49 THz for SA primarily involves the bond angle bending of H16O26H59 atoms and the dihedral angle torsion of H16O26H59O56 atoms, in which the H atoms exhibit the most significant displacement amplitude and are the main participants in the vibration. At 0.81 THz, the mode mainly encompasses bond angle bending involving O56H59O26, H16O26H59, and H48O58C50 atoms, along with the swinging of C38H48O58C50 atoms. The arrows in the figure show the direction of atomic movement, clearly demonstrating that this mode involves atomic displacements both in-plane and out-of-plane, and the O atoms in the hydroxyl and carboxyl groups show obvious directional vibration characteristics with moderate arrow lengths. The vibration modes at 1.75 THz mainly consist of the bond length stretching of O26H16, bond angle bending involving C6H16O26 atoms, and the dihedral angle torsion of O56H59O26C18 atoms within the plane, where the stretching vibration of the O-H bond is the dominant motion, with the H atom having the largest displacement amplitude. Finally, the vibration mode at 1.94 THz is primarily attributed to the bond angle bending of C6H16O26 atoms, and the C and O atoms in the carboxyl group coordinate with the H atom to produce a small-range angular bending motion.
Similarly, Figure 6 shows the vibration mode diagram of ASA under each absorption peak, with the same visual annotation rules as Figure 5 for atomic displacement direction and vibration amplitude (arrow length). Combined with Table 1, the vibration mode at 0.62 THz involves bond angle bending of the C71O76H42 atoms and the dihedral angle torsion of O73C70C64C65 atoms, in which the H atom in the hydroxyl group and the C atom in the acetyl group show relatively obvious displacement, and the dihedral torsion presents a unidirectional rotation trend of the molecular segment. The modes at 0.83 THz are mainly the bond angle bending involved O11H84O73 and C7O11H84 atoms, and the two hydroxyl groups on the benzene ring produce coordinated angular bending vibration, with the H atoms as the main vibration units. The modes at 1.27 THz of ASA are mainly dominated by the bending vibration of the C-C bond in the benzene ring, in which the carbon atoms on the benzene ring skeleton produce a small-range in-plane bending motion, and the peripheral substituent atoms show weak follow-up vibration. While the 1.62 THz mode is a combination of the bending vibration of the acetyl group and the twisting vibration of the carboxyl group, the two functional groups produce asynchronous torsional and bending motions, and the O atoms in the carbonyl group have a relatively significant displacement amplitude.
Through comprehensive analysis, it can be concluded that the terahertz absorption peaks of SA and ASA in the 0.4-2.0 THz range are mainly derived from bond-angle bending and dihedral torsion, and the difference in functional groups (hydroxyl group in SA vs. acetyl group in ASA) leads to the distinction in their vibrational modes.
Qualitative analysis of weak intermolecular interactions
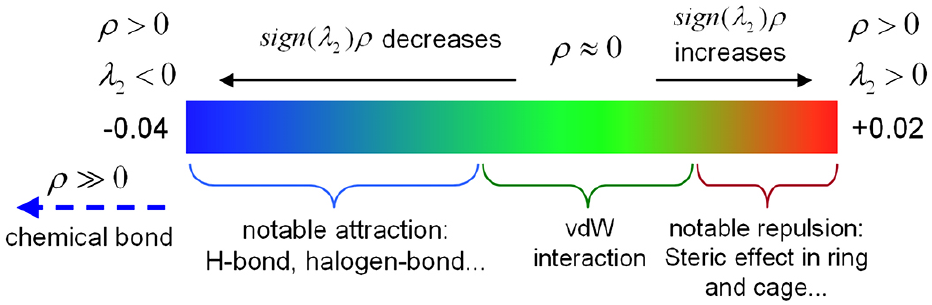
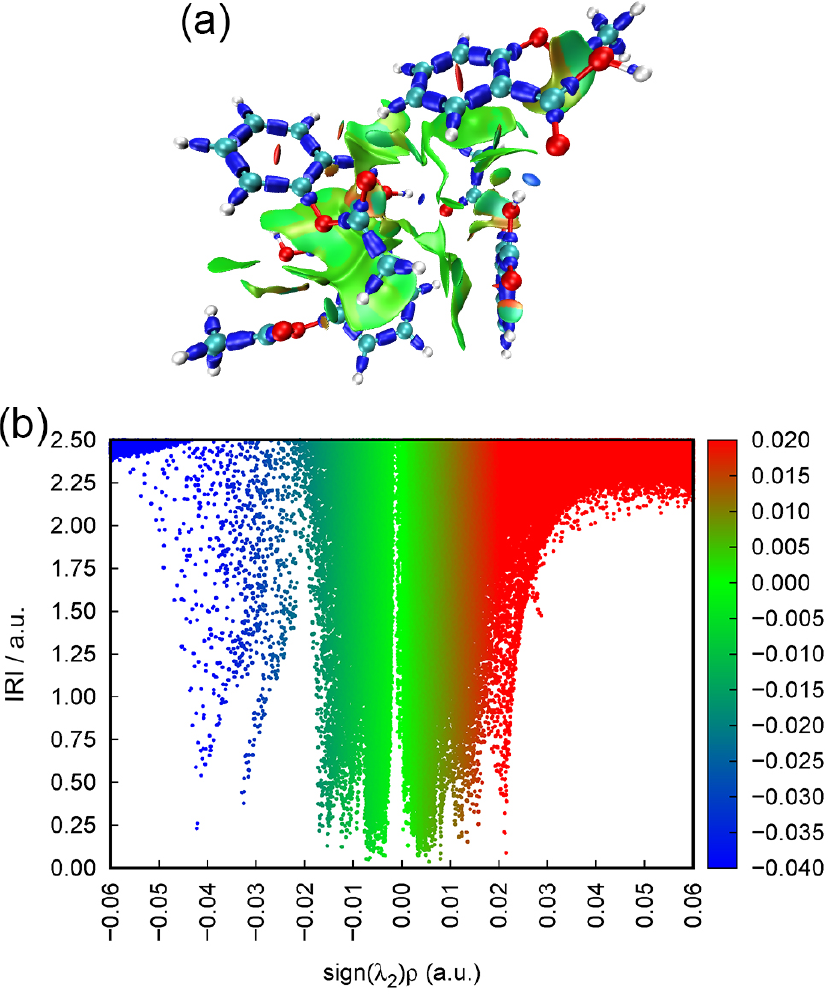
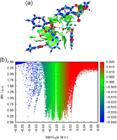
The crystal cell structure systems of SA and ASA underwent qualitative analysis visualized through the IRI method. This approach reveals the distribution of weak interactions by computing electron density and its gradient. The IRI method utilizes the sign(λ2)ρ function, in which sign(λ2) denotes the sign of the second largest eigenvalue of the electron density Hessian matrix, indicating the nature of the interaction. Meanwhile, the ρ(r) function represents the electron density at various spatial locations. The IRI iso surface was generated by projecting the sign(λ2)ρ function using visualization software to distinguish different interaction regions, as shown in Figure 7. The color gradient of the iso surface is set as follows: when ρ > 0 and λ2 < 0, the sign(λ2)ρ value decreases with increasing distance, indicating attractive interactions such as hydrogen bonds and halogen bonds; When ρ > 0 and λ2 > 0, the sign(λ2)ρ value increases, indicating the repulsive stereo effect.
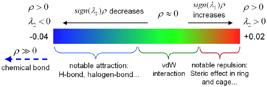
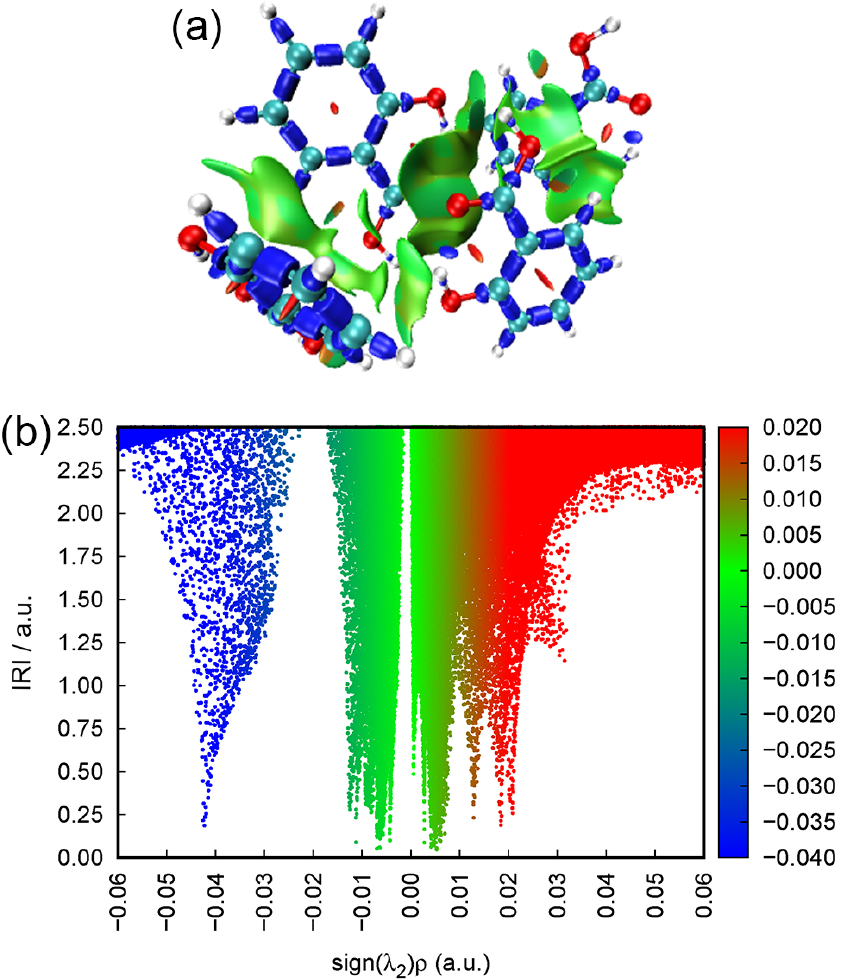
The outcomes of the IRI analysis for SA are depicted in Figure 8. The IRI method was executed utilizing Multiwfn software (version 3.8 dev, Lu, T.; Beijing Kein Research Center for Natural Sciences, Beijing, China, 2025),36 and the resulting data were visualized with the aid of VMD software (version: 1.9.3, Humphrey, W.; Theoretical and Computational Biophysics Group, Urbana, United States, 2016). Notably, prominent green iso-surfaces are observable within the structural framework of the SA system. Referring to the color scale in Figure 7, these sizable green iso-surfaces between molecules signify the van der Waals effect, suggesting that, in terms of quantity, the predominant weak intermolecular interactions in SA are governed by the van der Waals forces.
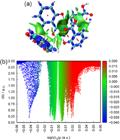
The statistical results indicate that intramolecular interactions in SA predominantly occur in proximity to its hydroxyl and carboxyl groups, with fewer interaction sites within the molecule compared to those between molecules. Furthermore, a notable peak emerges in the area where the sign(λ2)ρ value nears -0.04 (as illustrated in Figure 8b), signifying the presence of intramolecular O-H...O hydrogen bonds. Several green and brown peaks are also observed, with sign(λ2)ρ values close to -0.012 and +0.012, respectively, indicating intramolecular C-H...O hydrogen bonds. The green regions denote attractive interactions, while the brown regions indicate repulsive ones. Additionally, the peak where sign(λ2)ρ is roughly 0.02 reflects spatial effects.
Figure 9 shows the IRI analysis results of ASA. Similarly, we can observe the presence of large green iso surfaces between ASA molecules, representing van der Waals interactions, corresponding to the peaks in the scatter plot, with sign(λ2)ρ of approximately -0.01 and 0.01. The number of iso-surfaces of intermolecular interactions between ASA molecules is significantly higher than that of SA, and the color of the iso-surfaces is darker (close to blue), indicating a stronger interaction strength. In the scatter plot, the data points concentrated around -0.04 represent intermolecular hydrogen bonds. The IRI results indicate that the weak interactions in the SA and ASA systems are mainly intermolecular hydrogen bonds. In terms of quantity and strength, the intermolecular hydrogen bonds in ASA are significantly stronger compared to SA.
Quantitative analysis of weak intermolecular interactions
To quantitatively characterize the weak intermolecular interactions between SA and ASA systems, this paper conducted a systematic study by combining EDA-FF with ESP methods. EDA-FF can decompose the total interaction energy between fragments into physically meaningful energy terms to facilitate the investigation of the nature of interactions. The unit cell structure of both SA and ASA contains four molecules, each of which is configured as a fragment, and all atoms in the system are renumbered according to the molecular fragment. Two substances each have four fragments (Frag 1-4), corresponding to the atomic number range shown in Table 2.
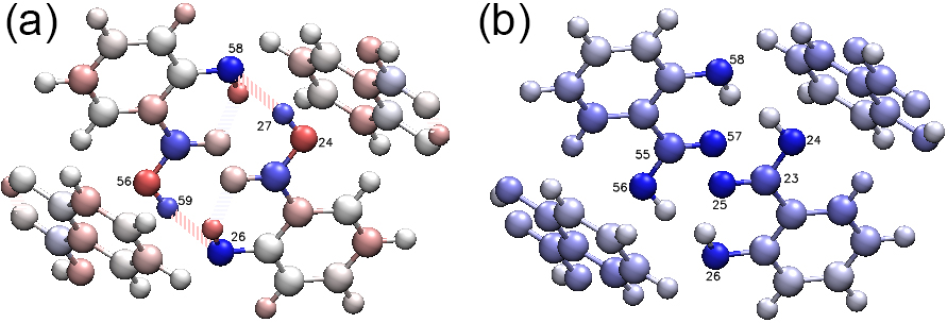
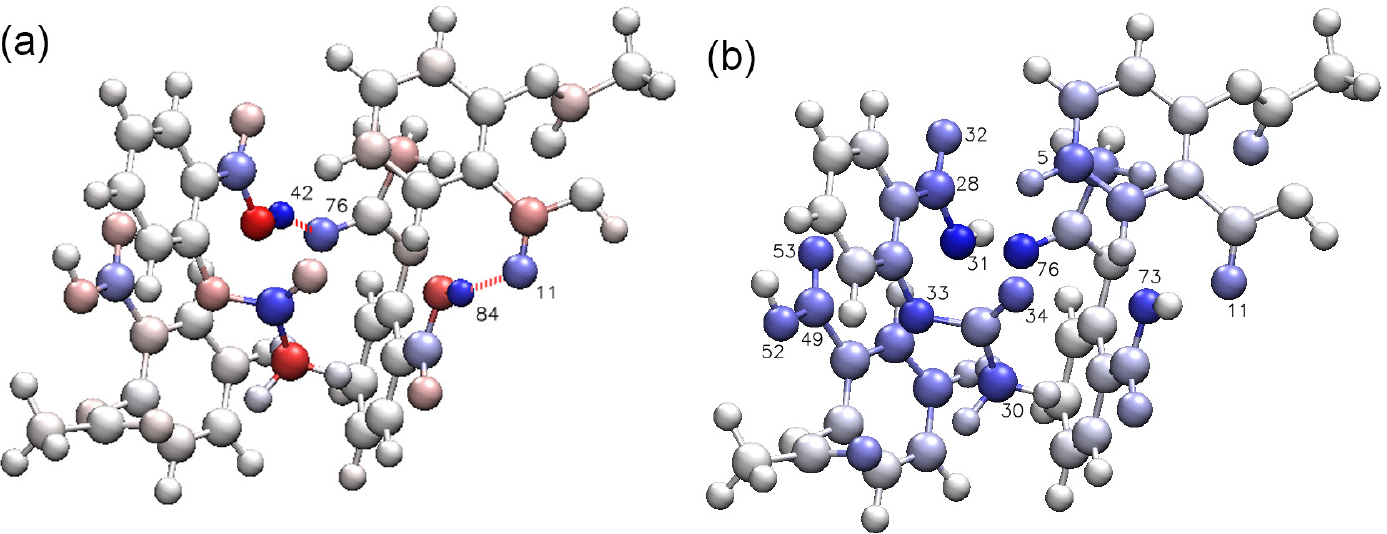
The EDA-FF method enables the decomposition of weak interaction types in the systems of SA and ASA into electrostatic, repulsive, and dispersive interactions. The interaction energies between the four fragments of these two substances are shown in Table 3 and 4, respectively. Meanwhile, the results are imported into the VMD software, which colors the atoms according to their charge properties, as depicted in Figures 10 and 11. The current color scale employs a blue-white-red tricolor scheme; a bluer atomic color indicates greater attractiveness, while a redder atomic color signifies more pronounced repulsive interactions. On the other hand, white atoms contribute less to the interactions.
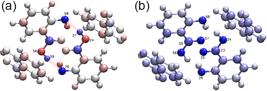
Atomic coloring diagrams of SA (a) hydrogen bonds interaction and (b) dispersion interaction.
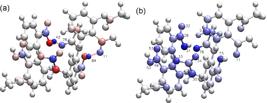
Atomic coloring diagrams of ASA (a) hydrogen bonds interaction and (b) dispersion interaction.
As shown in Table 3, the electrostatic interaction energy is -17.58 kJ mol-1 between Frag 2-4, which is mainly due to the existence of hydrogen bonds between these two fragments. The positions of hydrogen bonds are shown in Figure 10a for O24-H27…O58 and O56-H59…O26. While among other fragments, the electrostatic interaction energy has almost no contribution. In addition, dispersion contributes to a considerable extent among the various fragments of the SA system. Such as the dispersion interaction energy is -42.76 kJ mol-1, -42.68 kJ mol-1 and -50.23 kJ mol-1 between Frag 1-4, Frag 2-3 and Frag 2-4, respectively. Figure 10b shows the dispersive atomic coloring diagram of SA. The bluer the atoms represent the greater effect on dispersion. According to the color of the atoms, we can know that almost all atoms in the four fragments except hydrogen atoms have a certain degree of dispersion contribution. And some of the bluer atoms contribute more such as C23, O24, O25 and O26 atoms of Frag 2, C55, O56, O57 and O58 atoms of Frag 4.
In Table 4, the electrostatic interaction energy is -26.93 kJ mol-1 between Frag 1-4, while that is -36.25 kJ mol-1 between Frag 2-4, the energy of these two places is almost equal to the total. This is mainly due to the presence of hydrogen bonds. The positions of the two pairs of hydrogen bonds are shown in Figure 11a, at O11 of Frag 1 and H84 of Frag 4, H42 of Frag 3 and O76 of Frag 4, respectively. In addition, dispersion is manifested to a considerable extent among the various fragments in the ASA system. Especially the dispersive interaction energy reach -80.74 kJ mol-1 between Frag 2-3. Figure 11b shows the dispersive atomic coloring diagram of ASA. The dispersion interactions are mainly contributed by the blue atoms, such as C5 and O11 atoms of Frag 1, C28, C30, O31, O32, O33 and O34 atoms of Frag 2, C49, O52 and O53 atoms of Frag 3, O73 and O76 atoms of Frag 4.
Comprehensive analysis, the dispersion interaction provided the most important contribution to the total binding energy of the SA and ASA system, which was mainly reflected in the atoms except hydrogen atoms. The electrostatic interaction contributed a small part to the total binding energy of the two systems, which was mainly influenced by intermolecular hydrogen bonds.
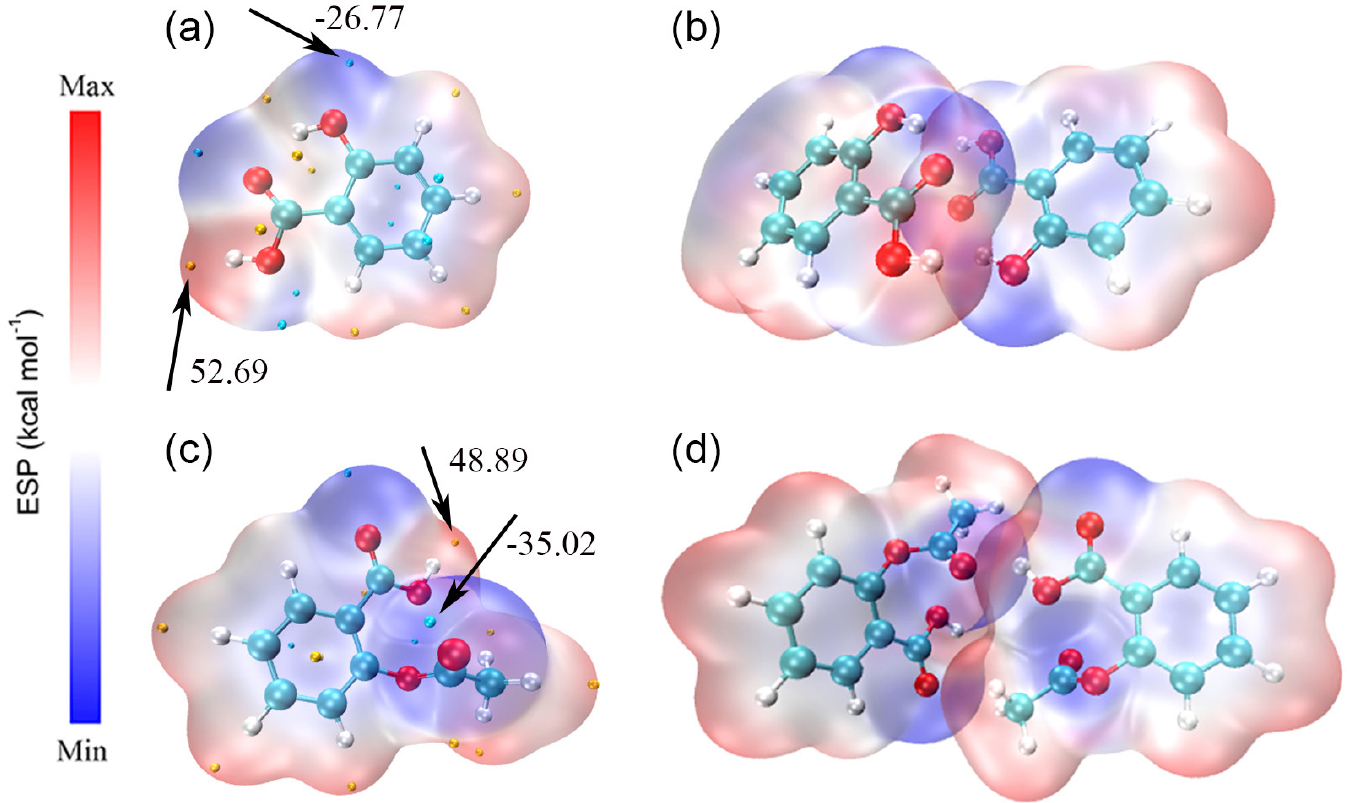
As demonstrated in Tables 3 and 4, the most intense electrostatic potential is observed between Frag 2 and Frag 4 within both material structures. Consequently, these two fragments were chosen as reference fragments for an in-depth analysis of electrostatic potential patterns. To visualize this, the molecular surface electrostatic potential distributions of single molecules of SA and ASA, along with the two fragments exhibiting the strongest electrostatic interactions, were depicted by coloring the electron density iso-surface. The results are showcased in Figure 12. The color gradient of the iso-surface transitions from blue to white to red, corresponding to the range of electrostatic values. Areas tinted red signify more positive electrostatic potential values and are more prone to combining with negatively charged electrons. Conversely, the blue-colored regions correspond to more negative electrostatic potential values. The blue sphere marks the minimum electrostatic potential point on the molecular surface, whereas the orange sphere indicates the maximum point.
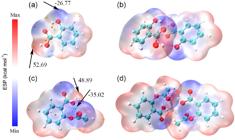
Distribution diagram of electrostatic potential (a) SA monomer, (b) SA dimer, (c) ASA monomer, and (d) ASA dimer.
It should be noted that in this study, we conducted calculations of ESP values and EDA-FF values for relevant molecules. Among them, ESP value can characterize the distribution of surface electrostatic potential of molecules, with the unit of kcal mol-1; The EDA-FF value is mainly used to evaluate the intermolecular interaction energy, measured in kJ mol-1. Considering that different unit systems may cause inconvenience for readers; we would like to supplement the conversion relationship between the two: 1 kcal mol-1 is equivalent to 4.184 kJ mol-1.
Figure 12a illustrates the electrostatic potential distribution characteristics of a solitary SA molecule. The positive region of the electrostatic potential is primarily concentrated around the C-H bond, reaching a maximum value of 52.69 kcal mol-1. The negative region of electrostatic potential is located on the surface of oxygen atoms in carboxyl and hydroxyl groups, with a minimum value of -26.77 kcal mol-1. As depicted in Figure 12c, the electrostatic potential distribution characteristics of a single ASA molecule are presented. The negative segment of electrostatic potential of ASA surrounds the oxygen atoms of carboxyl and acetoxy groups, with a minimum value of -35.02 kcal mol-1. The positive region of the electrostatic potential manifests around the C-H bond, with a maximum value of 48.89 kcal mol-1. The locations where the maximum and minimum values of the electrostatic potential occur for these two substances are essentially identical.
Figure 12b reveals the electrostatic potential distribution characteristics of the SA dimer. It is evident from the figure that, following dimer formation, there is a notable penetration of the van der Waals surfaces of the two SA molecules. The area with positive electrostatic potential infiltrates the area with negative electrostatic potential. In other words, the electrostatic potential minimum position of one SA molecule attracts another molecule to bind with its electrostatic potential maximum position, thereby forming a hydrogen bond. Hence, the maximum and minimum points in the electrostatic potential distribution diagram of a single molecule serve as the donor and hydrogen bond acceptor sites during the formation of the spatial configuration of the cluster model. This suggests that the fundamental nature of the hydrogen bond interaction between SA molecules primarily stems from electrostatic attraction. Figure 12d portrays the electrostatic potential distribution of two ASA molecules. The blue and red regions intermingle, reflecting the complementarity of electrostatic potential and the inherent nature of hydrogen bonding interactions based on electrostatic attraction.
Conclusions
This study systematically investigated the terahertz spectral characteristics of SA and ASA through a combination of experimental measurements and theoretical calculations. The results demonstrated that the B3LYP-D3 method showed good agreement with the experimental spectral data, which laid a foundation for the subsequent analysis of vibrational mechanisms. The study utilized PED analysis to further investigate the origin of spectral peaks, revealing that the terahertz absorption peaks of SA primarily originated from vibrational modes associated with bond-angle bending, while those in ASA mainly stemmed from a combination of bond-angle bending and dihedral torsion. IRI, EDA-FF, and ESP methods were used for in-depth analysis of weak interactions within molecular systems. The results revealed that weak interactions in both SA and ASA were predominantly intermolecular hydrogen bonds in terms of quantity and intensity. Compared to SA, the intermolecular hydrogen bonds in ASA were significantly stronger, which is an important reason for the difference in their terahertz spectra. Admittedly, this study has certain limitations: it is confined to the terahertz frequency range of 0.4-2.0 THz, and the high-frequency (2.0-10.0 THz) vibrational modes and weak interactions of SA and ASA have not been explored. Theoretical calculations ignore the influence of temperature on lattice structure, vibration modes, and weak intermolecular interactions. Only pure SA and ASA crystal systems were studied without involving their more complex drug cocrystal systems with pharmaceutical excipients. Regarding future research, integrate findings with formulation design and validate the practical significance of weak-interaction regulation in boosting SA and ASA preparation solubility and bioavailability via in vitro dissolution tests.
Acknowledgments
The authors gratefully acknowledge the financial support provided by Guangxi Key Laboratory of Automatic Detecting Technology and Instruments (Grant No. YQ24103), the National Natural Science Foundation of China (Grant No. 62161005), the Middle-aged and Young Teachers’ Basic Ability Promotion Project of Guangxi (Grant No. 2024KY1735), and the Guilin Institute of Information Technology Campus Level Research Project (Grant Nos. XJ2024098 and XJ2024015). The authors also thank Guilin University of Electronic Technology for providing research infrastructure.
Data Availability Statement
The data substantiating the findings of this study can be obtained from the corresponding authors following a reasonable request.
References
-
1 Lavigne, E. G.; Cavagnino, A.; Steinschneider, R.; Breton, L.; Baraibar, M. A.; Jäger, S.; Free Radical Biol. Med. 2022, 181, 98. [Crossref]
» Crossref -
2 Khalil, R.; Haroun, S.; Bassyoini, F.; Nagah, A.; Yusuf, M.; J. Agric. Food Res. 2021, 5, 100182. [Crossref]
» Crossref -
3 Hasan, M.; Alfredo, K.; Murthy, S.; Riffat, R.; J. Environ. Manage. 2021, 295, 113071. [Crossref]
» Crossref -
4 Paterson, J. R.; Srivastava, R.; Baxter, G. J.; Graham, A. B.; Lawrence, J. R.; J. Agric. Food Chem 2006, 54, 2891. [Crossref]
» Crossref -
5 Li, Z.; Wei, C.; Zhang, Y.; Wang, D.; Liu, Y.; J. Chromatogr. B 2011, 879, 1934. [Crossref]
» Crossref -
6 Sinha, P.; Srivastava, N.; Rai, V. K.; Mishra, R.; Ajayakumar, P. V.; Yadav, N. P.; J. Drug Delivery Sci. Technol. 2019, 52, 870. [Crossref]
» Crossref -
7 Wang, Y.; Zhuang, M.; J. Clin. Rational Drug Use 2019, 12, 176. [Crossref]
» Crossref -
8 Ma, T.; Zhou, X.; Chin. J. Mod. Drugs Appl. 2022, 16, 104. [Crossref]
» Crossref -
9 Huang, L.; Clin. J. Res. Pract. 2021, 6, 153. [Crossref]
» Crossref -
10 Zhang, N.; Sundquist, J.; Sundquist, K.; Zhang, Z.; Ji, J.; Am. J. Gastroenterol. 2021, 116, 1313. [Crossref]
» Crossref -
11 Molina, F.; Ghaleb, S.; Gonzalez de Alba, C.; Bartakian, S.; Brownlee, J.; Circulation 2015, 132, A15863. [Crossref]
» Crossref -
12 D’Agostino, I.; Tacconelli, S.; Bruno, A.; Contursi, A.; Mucci, L.; Hu, X.; Patrignani, P.; Pharmacol. Res. 2021, 170, 105744. [Crossref]
» Crossref -
13 Tian, X.; Ji, B.; Niu, X.; Duan, W.; Wu, X.; Cao, G.; Yan, T.; Chin. Med. J. 2023, 136, 541. [Crossref]
» Crossref -
14 Mura, C.; Preissner, S.; Nahles, S.; Heiland, M.; Bourne, P. E.; Preissner, R.; Signal Transduct. Target. Ther. 2021, 6, 267. [Crossref]
» Crossref -
15 Mansoor, T.; Alsarah, A. A.; Mousavi, H.; Eliyas, J. K.; Girotra, T.; Hussein, O.; J. Stroke Cerebrovasc. Dis. 2021, 30, 105822. [Crossref]
» Crossref -
16 Borbone, N.; Piccialli, G.; Roviello, G. N.; Oliviero, G.; Molecules 2021, 26, 986. [Crossref]
» Crossref -
17 Abbas, A.; Kumar, N.; Singh, S.; Kumar, R.; Ahmad, A.; Nath, R.; Dixit, R. K.; Int. J. Basic Clin. Pharmacol. 2020, 9, 605. [Crossref]
» Crossref -
18 Bolla, M.; Momi, S.; Gresele, P.; Del Soldato, P.; Eur. J. Clin. Pharmacol. 2006, 62, 145. [Crossref]
» Crossref -
19 Bo, Y.; Fang, J.; Zhang, Z.; Xue, J.; Liu, J.; Hong, Z.; Du, Y.; Pharmaceutics 2021, 13, 1303. [Crossref]
» Crossref -
20 Jing, Y.; Zhang, J.; Wan, M.; Xue, J.; Liu, J.; Qin, J.; Du, Y.; IEEE Trans. Terahertz Sci. Technol 2024, 14, 152. [Crossref]
» Crossref -
21 Zhang, Z.; Fang, J.; Bo, Y.; Xue, J.; Liu, J.; Hong, Z.; Du, Y.; J. Mol. Struct 2021, 1227, 129547. [Crossref]
» Crossref -
22 Tang, Y.; Wang, X.; Chen, T.; Yang, D.; Huang, Y.; Huang, X.; CrystEngComm 2026, 28, 276. [Crossref]
» Crossref -
23 Zhang, Z.; Wang, Q.; Xue, J.; Du, Y.; Liu, J.; Hong, Z.; ACS Omega 2020, 5, 17266. [Crossref]
» Crossref -
24 Zhang, J.; Wan, M.; Fang, J.; Hong, Z.; Liu, J.; Qin, J.; Du, Y.; Spectrochim. Acta, Part A 2023, 295, 122623. [Crossref]
» Crossref -
25 Qin, B.; Qiu, J.; Yang, R.; Gan, Y.; Zhong, H.; Liao, Q.; Li, Y.; IEEE Trans. Terahertz Sci. Technol 2024, 14, 476. [Crossref]
» Crossref -
26 Yang, R.; Chen, X.; Wu, H.; Pang, W.; Zeng, X.; Huang, X.; Qin, B.; Spectrochim. Acta, Part A 2025, 338, 126215. [Crossref]
» Crossref -
27 Tang, Y.; Li, Z.; Tu, S.; She, Y.; Gan, Y.; Int. J. Quantum Chem 2022, 122, e26971. [Crossref]
» Crossref -
28 Tang, Y.; Li, Z.; Zhang, H.; Tu, S.; She, Y.; AIP Adv 2022, 12, 055015. [Crossref]
» Crossref -
29 Tu, S.; Xiao, H.; Zhang, C.; Zhang, W.; Chen, T.; Li, Y.; Tang, X.; Spectrochim. Acta, Part A 2025, 342, 126480. [Crossref]
» Crossref -
30 Jamroz, M. H.; Spectrochim. Acta, Part A 2013, 114, 220. [Crossref]
» Crossref -
31 Lu, T.; Chen, Q.; Chem. Methods 2021, 1, 231. [Crossref]
» Crossref -
32 Johnson, E. R.; Keinan, S.; Mori-Sanchez, P.; Contreras-Garcia, J.; Cohen, A. J.; Yang, W.; J. Am. Chem. Soc 2010, 132, 6498. [Crossref]
» Crossref -
33 Emamian, S.; Lu, T.; Kruse, H.; Emamian, H.; J. Comput. Chem 2019, 40, 2868. [Crossref]
» Crossref -
34 Tang, Y.; Zhang, L.; Huang, Y.; Yang, D.; CrystEngComm 2026, 28, 1091. [Crossref]
» Crossref -
35 Chen, T.; Yu, L.; Li, Z.; Hu, F.; Xu, C.; Spectrochim. Acta, Part A 2021, 263, 120159. [Crossref]
» Crossref -
36 Lu, T.; Chen, F.; J. Comput. Chem. 2012, 33, 580. [Crossref]
» Crossref
Edited by
-
Editor handled this article:
Paulo Augusto Netz (Associate)