Composition and Colors of Propolis from Vale do Jequitinhonha (Brazil): A Pilot Study Based on Untargeted Metabolomics
Abstract
Propolis exhibits marked chemical diversity driven by botanical sources and environmental conditions, which challenges its classification based solely on geographic origin or color. In this study, 54 propolis samples collected from different microregions of Vale do Jequitinhonha (Minas Gerais, Brazil) were analyzed using an untargeted metabolomics approach by liquid chromatography-mass spectrometry, combined with visible spectroscopy measurements and correlation-based statistical analyses. Multivariate analysis revealed pronounced chemical variability across the dataset, with partial differentiation observed for samples from the Diamantina microregion, while other microregions showed substantial overlap. Visible spectroscopy allowed objective classification of the extracts into green (19 samples), red (5 samples), and other (30 samples), with green samples showing absorption bands mainly around 670 nm and red samples around 495 nm. A total of 77 molecular features were tentatively annotated, predominantly corresponding to phenolic acids, flavonoids, dihydrochalcones, and related phenolic subclasses. Compounds commonly reported as markers of Brazilian green and red propolis, such as artepillin C, caffeoylquinic acid derivatives, liquiritigenin, vestitol, and formononetin, were detected, including samples outside their classical regions of occurrence. Correlation-based integration of metabolomics and spectroscopic data indicated that propolis color arises from the combined contributions of multiple phenolic compounds rather than from a single pigment molecule.
Keywords:
chemical profile; phenolic compounds; Minas Gerais; PCA; statistical total correlation spectroscopy; mass spectrometry
Introduction
Propolis is a complex natural resinous mixture produced by bees from plant exudates and resins, mixed with bee wax and salivary enzymes, forming a chemically rich material used to seal and protect the hive.1,2 Propolis composition varies widely according to botanical sources, geographical origin, bee species, and local climate conditions, resulting in diverse colors, aromas, and biological properties.3,4 Despite such chemical variability, therapeutic functions of propolis have been consistently reported in several studies, including properties such as antioxidant, anti-inflammatory, antimicrobial, as well as healing and antitumoral activities, among others.5-8 Brazil is one of the top global producers of propolis, with strong chemical diversity across regions.9 Originally, Park et al.10 classified Brazilian propolis into 12 groups, according to their physicochemical characteristics, which were distinct for samples originated from different regions (South, Southeast, and Northeast). In 2007, the 13th group was included in the list, when Daugsch et al.11 reported the chemical composition and botanical origin of red propolis produced from Dalbergia ecastaphyllum (L.) Taub. along the sea and river shores in the Northeast region.12 Overall, traditional propolis classification into three major color groups (green, red, and brown) is widely adopted by beekeepers due to the commercial value and specific biological activities commonly associated with these color types.3,13,14
The Vale do Jequitinhonha mesoregion, located in the northern portion of Minas Gerais state, in Brazil, is characterized by a diverse ecosystem, including a combination of Cerrado, Atlantic Forest, and Caatinga, as well as rocky fields, which provide unique botanical sources of resins for propolis production.9-11 Beekeeping is an important economic activity in Vale do Jequitinhonha, which is practiced mainly by small family producers, with an outstanding positive social impact.15,16 The local beekeeping chain, which is primarily focused on the honey market, is already investing in bee product diversification, with a growing interest in propolis production. Few studies have addressed the chemical characterization of apicultural products from this region to date. However, a recent article17 has reported the chemical profile of aroeira honey from the same area, comparing it with aroeira honey produced in northern Minas Gerais. Understanding the chemical variability of propolis from Vale do Jequitinhonha is important to support the local apicultural activity, by providing information about the products, helping to understand potential geographical differences, as well as by possibly uncovering new bioactive compounds with potential therapeutic relevance.
Metabolomics, particularly the untargeted approach, has proven to be a powerful tool for comprehensive characterization of complex natural products, including propolis.18,19 This approach enables simultaneous detection of hundreds or even thousands of metabolites, providing chemical fingerprints that can be associated with sample origin, classification, and/or biological function. Metabolomics studies of propolis have been performed, for instance, to evaluate the volatile metabolome of propolis from different locations in South Africa,20 to identify potential chemical markers of Chinese poplar type propolis and Greek Mediterranean propolis,18 to investigate compositional differences in propolis from different regions in Croatia,21 as well as to study the chemical composition of stingless bee propolis,22,23 among others. The main analytical platforms currently used in propolis metabolomics studies are gas chromatography-mass spectrometry (GC-MS), liquid chromatography-mass spectrometry (LC-MS), and nuclear magnetic resonance spectroscopy (NMR).19 In addition, some studies have used other techniques to complement the metabolomics data, including Fourier transform infrared (FTIR) spectroscopy, ultraviolet-visible (UV-Vis) molecular absorption spectrophotometry, or direct analysis in real-time mass spectrometry (DART-MS).22-24
In this context, this study aimed to evaluate the chemical composition and characteristics of propolis samples originating from different locations in Vale do Jequitinhonha (Minas Gerais, Brazil), using an untargeted metabolomics approach. Metabolomics data acquired using LC-MS were complemented by molecular spectrophotometric analysis in the visible region, given the very diverse colors observed in the propolis samples and ethanolic extracts. This approach provided a simple and objective tool for assessing the chromatic properties of propolis extracts, which could be further analyzed using principal component analysis (PCA) and statistical total correlation spectroscopy (STOCSY).25-27 Therefore, propolis samples were assessed considering both the geographical origin and the color, which may be associated with distinct chemical profiles.
Experimental
Reagents and solutions
Reagents and solvents used to prepare mobile phases and sample extracts included: high-performance liquid chromatography (HPLC)-grade methanol (Merck, Darmstadt, Germany), 85% formic acid (CRQ Química, São Paulo, Brazil), 95% ethanol (P.A., Neon, Itaquaquecetuba, Brazil), and type I ultrapure water, obtained from Gehaka MS3000 Master System (São Paulo, Brazil). The internal standard p-fluoro-DL-phenylalanine (F-Phe) was purchased from Sigma-Aldrich (St. Louis, Missouri, USA).
Propolis samples
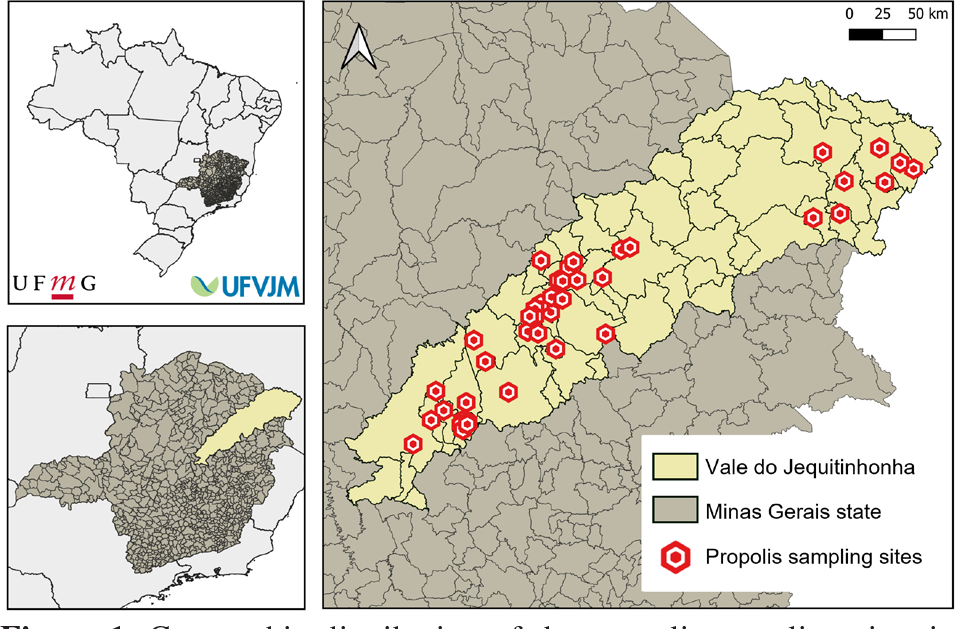
A total of 54 raw propolis samples produced by Apis mellifera L. were analyzed. These samples were selected from an initial set of 60 samples gently donated by beekeepers from different locations in the Vale do Jequitinhonha, a mesoregion within the state of Minas Gerais, Brazil, as indicated in Figure 1. Sample collection occurred in March and April, 2024. Upon collection, geographical origin information was recorded for each sample, including the municipality, neighborhood/community, and, when available, geographical coordinates (Table S1, Supplementary Information (SI) section). Sample IDs (i.e., AP01, AP02, …, AP60) reflect the original field collection numbering; however, six samples collected in nearby areas outside the Vale do Jequitinhonha with lacking complete geographic information were excluded from the dataset. To preserve traceability with field records, the original sample IDs were retained. The samples of this study are registered in the Brazilian National System for Management of Genetic Heritage and Associated Traditional Knowledge (SisGen) under registration number A6228C8.
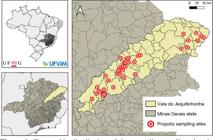
Geographic distribution of the propolis sampling sites in the Vale do Jequitinhonha mesoregion, Minas Gerais, Brazil. The map highlights the locations of the sampling sites (red hexagons) within the Vale do Jequitinhonha area (yellow) and the municipal boundaries of Minas Gerais state (gray).
Samples were collected into 50-mL centrifuge tubes and transported at room temperature from Centro Multiusuário de Pesquisa em Ciência Florestal (CAFESIN/MULTIFLOR, Diamantina, Brazil) to the Laboratory of Analytical Chemistry and Mass Spectrometry (LACMass, Belo Horizonte, Brazil), where they were stored at -20 ºC until sample preparation and analysis.
Sample preparation
Propolis extracts were prepared by combining 1.2 g of raw propolis with 2.8 mL of 70% (v/v) ethanol in water into 13-mL glass tubes with screw stoppers. The mixture was homogenized by vortexing for 10 s, sonicated in an ultrasonic bath (Unique, model 1400 A, Indaiatuba, Brazil) for 30 min, and centrifuged at 4000 rpm for 5 min (Centribio model 80-2B, BioVera, Rio de Janeiro). The supernatant was transferred to another glass tube and stored at -20 ºC overnight to solidify waxy residues. Subsequently, the liquid phase was filtered through a 0.22 µm polyethersulfone (PES) syringe filter to remove any particulate matter. The extracts were then stored in 10-mL glass flasks with screw stoppers at -20 ºC.
Prior to LC-MS analysis, the extracts were 100-fold diluted by combining 20 µL of extract with 1980 µL of a 30:70 (v/v) methanol:water mixture containing 0.1 mg L-1 F-Phe (used as an internal standard). Blank samples were prepared in the same way, except that 20 µL of 70% (v/v) ethanol was used instead of the propolis extracts. In addition, quality control (QC) samples were prepared by mixing together 20 µL of each individual extract (n = 54), in order to produce a representative pooled sample, which was also 100-fold diluted before LC-MS analysis, as described for the individual propolis samples (i.e., 20 µL of pooled sample combined with 1980 µL 30:70, v/v, methanol:water containing 0.1 mg L-1 F-Phe).
LC-MS data acquisition
LC-MS data acquisition was performed using an ultra-high-performance chromatograph (UHPLC, Vanquish Horizon system, Thermo Scientific, Waltham, USA) coupled to a Q Exactive Plus high-resolution mass spectrometer, equipped with an electrospray ion source, and operated by the software TraceFinder (Thermo Scientific, Waltham, USA). A Kinetex F5 column (150 × 4.6 mm, 5 µm, 100 Å, Phenomenex, Torrance, USA) was used in the chromatographic separation at 30 ºC. The mobile phase was composed of: (A) water with 0.1% (v/v) formic acid and (B) methanol with 0.1% (v/v) formic acid. The separation was performed at the flow rate of 0.6 mL min-1 using the following gradient: 1-95% mobile phase B from 0 to 12 min, keeping 95% B from 12 to 16 min, returning to 1% B in 0.1 min and maintaining this composition for 4 min to re-equilibrate the system (total of 20 min). The injection volume was 5 µL. The mass spectrometer was operated under negative and positive ionization modes separately, with acquisition in the mass-to-charge ratio (m/z) range of 100 to 1500. The ion source was operated at the following conditions: capillary voltage of 4.0 kV, nebulizing gas flow of 30 arbitrary units (a.u.), auxiliary gas flow of 5 a.u., and capillary temperature of 300 ºC. Data dependent acquisition combined with full MS (DDA FS) was used as the acquisition mode, with mass spectra obtained in the centroid format. Full MS data were acquired at a resolution of 70,000 and a Max IT of 100 ms. DDA data was acquired with a resolution of 17,500, a Max IT of 50 ms, a TOP N = 5, an isolation window of 1.0 m/z, a normalized collision energy (NCE) of 20, 40 and 60 eV, a dynamic exclusion of 10 s, an apex trigger of 0.2 to 0.5 s, and isotopic exclusion activated.
The injection sequence started with a blank sample, followed by ten consecutive injections of QCs (pooled samples). Subsequently, the individual samples were injected in random order, with a QC injection after each block of 10 samples to evaluate system stability throughout the analytical sequence. The injection series ended with a final QC injection and a second blank sample to assess the potential for carryover or system-generated signals.
Processing of LC-MS metabolomics data
Raw data were processed on Compound Discoverer 3.3 (Thermo Scientific, Waltham, USA, 2021), using the workflow “Untargeted Metabolomics with Statistic Detect Unknowns with ID using Online Databases and mzLogic”, which performs retention time alignment, peak detection, signal grouping, background signal removal, molecular formula prediction, and compound search on mzCloud, ChemSpider, and Metabolika, including prioritized annotation based on the mzLogic algorithm. The resulting data matrix was exported and formatted in Excel 2019 (Microsoft Office, 2019) as a preparation step for subsequent statistical analysis.
In addition, the software XCalibur 4.2.44 (Thermo Scientific, Waltham, USA, 2021) was used to inspect some individual samples and signals, allowing visualization and verification of certain chromatographic peaks and MS/MS spectra. Skyline 25.1.0.237 (Proteowizard, Palo Alto, USA) was used to pre-evaluate overall data quality by integrating the peaks of the internal standard F-Phe and several common propolis metabolites in the representative QC samples.28,29 Skyline was also used to obtain the extracted ion chromatograms (EIC) and integrated peak areas of some known metabolites already reported in green and red propolis.
Visible molecular spectroscopy analysis for color evaluation
Raw propolis samples and their extracts exhibited quite diverse colors upon visual inspection. Considering that color has been a characteristic commonly used to classify propolis types, which is related to chemical composition and biological activity, the present study employed visible molecular spectroscopy to objectively evaluate propolis color. Measurements were performed on a SpectraMax ID3 microplate reader operated using the software SoftMax Pro (Molecular Devices, San Jose, California, USA, 2023). Readings were performed in the visible range (400 to 800 nm, with 1 nm intervals), using a 96-well plate with a transparent flat-bottom (Greiner), in which 200 µL of each propolis extract was placed. Extracts were used without further dilution, except for two samples (AP21 and AP53), which were 100-fold diluted in 70% (v/v) ethanol, because their absorbance reading exceeded the instrument operation range of 0 to 4 absorbance units when analyzed without dilution in preliminary tests. The diluted samples had their absorbance values corrected by the dilution factor during subsequent data analysis on Excel (Microsoft Office, 2019). The solvent (70% v/v ethanol) was used as a blank during the reading.
Statistical analysis
Statistical analysis for the metabolomics data was performed on MetaboAnalyst 6.0 under the module “Statistical Analysis (one factor)”.30 No missing values were present in the dataset. Initially, less informative variables (molecular features) were removed from the data matrix, by filtering out: (i) variables with relative standard deviation (RSD) larger than 20% in the QC samples; and (ii) variables nearly constant across the sample groups (40% based on the interquartile range). In addition, the dataset was autoscaled (mean-centered and divided by each variable’s standard deviation) to avoid molecular features with widely varying intensity scales, which could negatively impact multivariate analysis. Principal component analysis (PCA) was first used to assess the overall instrumental variability reflected in the QCs samples, and second to evaluate the natural distribution of the propolis samples by geographical origin (microregions) and color groups (defined by the presence of characteristic bands in the visible light absorbance spectra).
To further investigate covariation patterns between optical properties and molecular features, a correlation-based analysis inspired by Statistical Total Correlation Spectroscopy (STOCSY) was performed, following the conceptual framework proposed by Cloarec et al.27 In this work, STOCSY was implemented in Python 3.10 (Python Software Foundation, Wilmington, USA, 2021), through Google Colab (Google LLC, Mountain View, USA, 2024), by applying the STOCSY equation:
where X1 and X2 correspond to the autoscaled visible-range absorbance matrix and the autoscaled LC-MS feature matrix, respectively; n is the number of samples, and C is the correlation matrix. Highly correlated pairs (|r| ≥ 0.80) were retained to highlight wavelength regions whose spectral variation co-occurred with specific metabolomics signals.
Compound identification
Tentative compound identification was performed using annotations generated in Compound Discoverer 3.3 (Thermo Scientific, Waltham, USA, 2021), with further manual verification of mass spectral data. The tentative identities suggested in the software, based on the accurate mass, predicted elemental composition, isotopic pattern matching, and database/spectral library searches (mzCloud, ChemSpider, and Metabolika pathways), were inspected individually. MS/MS spectra were evaluated using mirror plots from mzCloud to confirm fragmentation consistency, characteristic neutral losses, and overall spectral similarity. The isotopic distribution predicted for each proposed formula was checked against the experimental pattern using enviPat Web.31 Experimental MS/MS spectra were submitted to MetFrag and CEU Mass Mediator to support structural interpretation through in silico fragmentation and complementary database annotation.32,33 Final assignments considered the agreement among accurate mass, fragmentation behavior, isotopic fit, and biological plausibility by searching previously reported compounds in propolis. Metabolites supported by multiple, concordant criteria were classified as putative identifications (annotation level 2), whereas features with only elemental composition or class-level information were reported according to the information available (annotation levels 3 or 4).34,35
Results and Discussion
Data quality assessment
The overall instrumental stability was evaluated using the QC pooled samples, which were intermittently analyzed throughout the analytical sequence to track potential signal drifts over time. Control charts showing the peak areas of the internal standard F-Phe in the QC samples (Figures S1a and S2a, SI section) showed no “out-of-control” measurements, according to control rules proposed by Westgard and recommended for evaluating metabolomics datasets.36,37 No trends or clear outliers were observed, indicating an adequate repeatability of the LC-MS system in both negative and positive ionization modes. In addition, PCA scores plots, including the QC replicates (Figures S1b and S2b, SI section), revealed a tight clustering of the QC samples near the centers of both principal components (PC1 and PC2), providing additional evidence of analytical consistency during data acquisition. Collectively, these quality control results validate the consistency of the dataset and support its suitability for downstream multivariate and correlation-based metabolomic analyses.38
Propolis chemical profile according to the microregion of origin
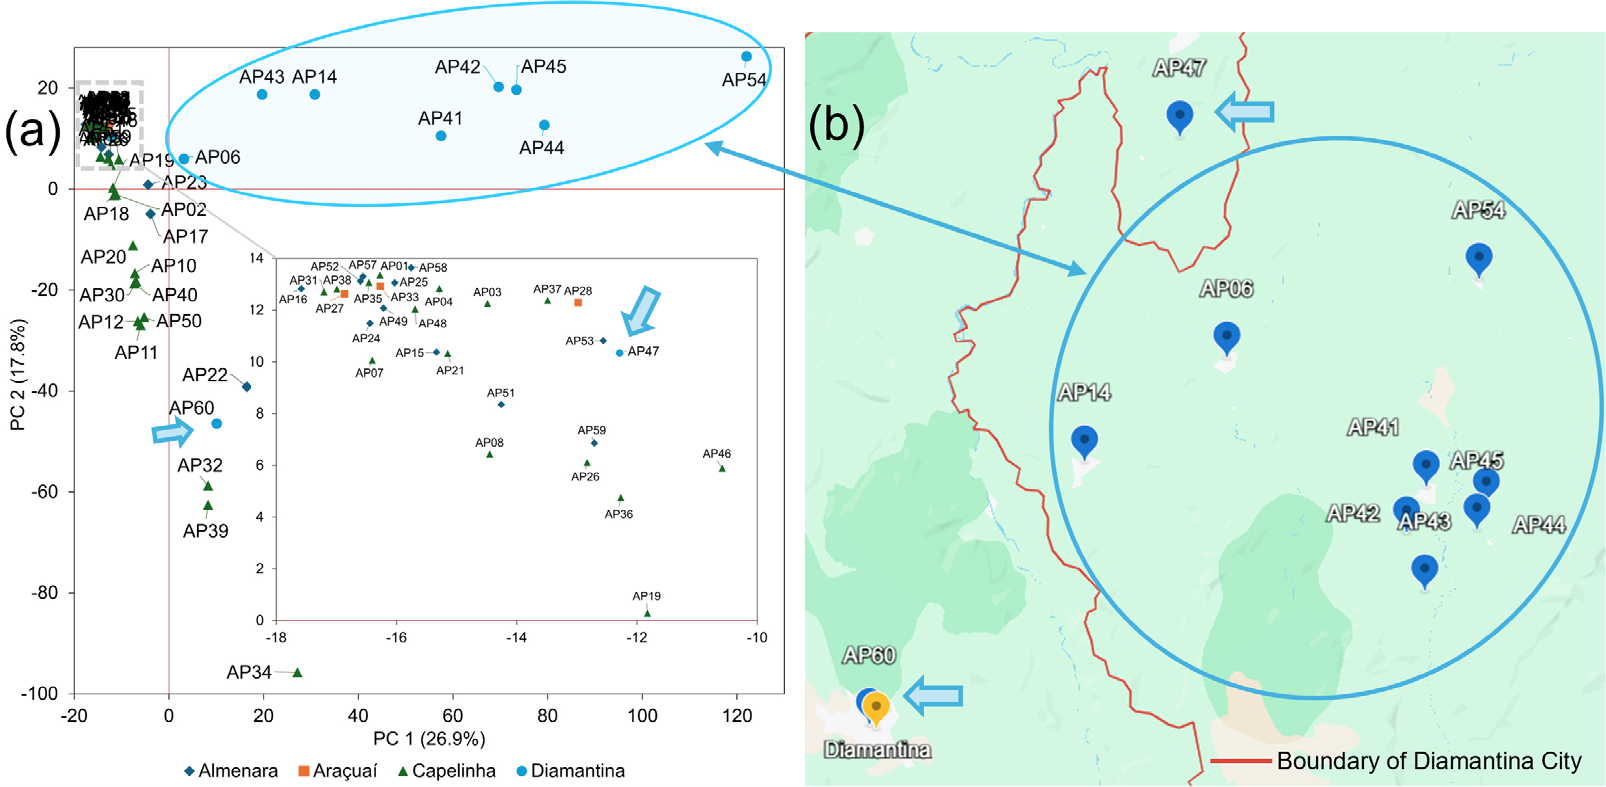
Considering the differences in altitude, climate, and vegetation along the studied territory, an initial evaluation was performed to identify potential differences in the chemical profile of propolis originated from different microregions within Vale do Jequitinhonha, including Almenara, Araçuaí, Capelinha, and Diamantina (although Pedra Azul and Grão-Mogol are the other two microregions in Vale do Jequitinhonha,39 the present study had no propolis samples from these areas). The PCA scores plots for samples categorized according to their microregion revealed clustering trends, especially for propolis samples from Diamantina (samples AP06, AP14, AP41, AP42, AP43, AP44, AP45, AP47, AP54, and AP60), most of which formed a compact cluster separated from samples originated from the other microregions (Figure 2a for negative ion mode and Figure S3b for positive ion mode, SI section). These first two PCs accounted for 44.7% of the total data variance. Samples AP41-AP45, collected from the Felício dos Santos municipality, and AP06, AP14, and AP54, collected from nearby rural areas within the Diamantina microregion, were tightly clustered in the positive quadrant of both PC1 and PC2, which indicates a shared characteristic chemical profile for propolis collected in this location. This site is dominated by Campo Rupestre vegetation, an ecosystem between the Cerrado and the Atlantic Forest, characterized by rocky outcrops and the prevalence of Asteraceae species, particularly Baccharis, which comprises several species, including the well-established botanical source of Brazilian green-type propolis.40-42
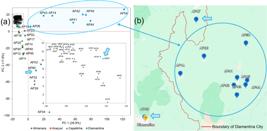
PCA scores plot for chemical profile data acquired in negative ionization mode for propolis samples categorized by their microregion of origin (a), highlighting in light blue the samples from the Diamantina microregion, with their locations shown on a geographical map (b).
Two samples originating from Diamantina’s urban area diverged from this cluster, positioning themselves far from the remaining samples. Sample AP47 was positioned on the negative side of PC1 and the positive side of PC2, whereas AP60 was positioned on the positive side of PC1 and the negative side of PC2, revealing distinct chemical signatures compared with the remaining Diamantina microregion samples. This dispersion suggests pronounced local variability, likely due to environmental and botanical contrasts between the urban sampling sites and the surrounding rural landscape. The combined PCA scores and geographical visualization (Figure 2b) emphasizes that the propolis from the Diamantina microregion, except for the two mentioned urban samples, displays a highly consistent metabolomic pattern. The arrows in Figure 2a highlight AP47 and AP60, underlining their divergent positions in both PCA scores space and map, whereas the light blue ellipse encloses the compact cluster of non-urban samples from the same microregion. In contrast, propolis samples from the remaining microregions (Almenara, Araçuaí, and Capelinha) did not exhibit clear clustering in the PCA scores plot, reflecting greater similarity in chemical composition and vegetation patterns across these areas.
Propolis chemical profile according to the extract color
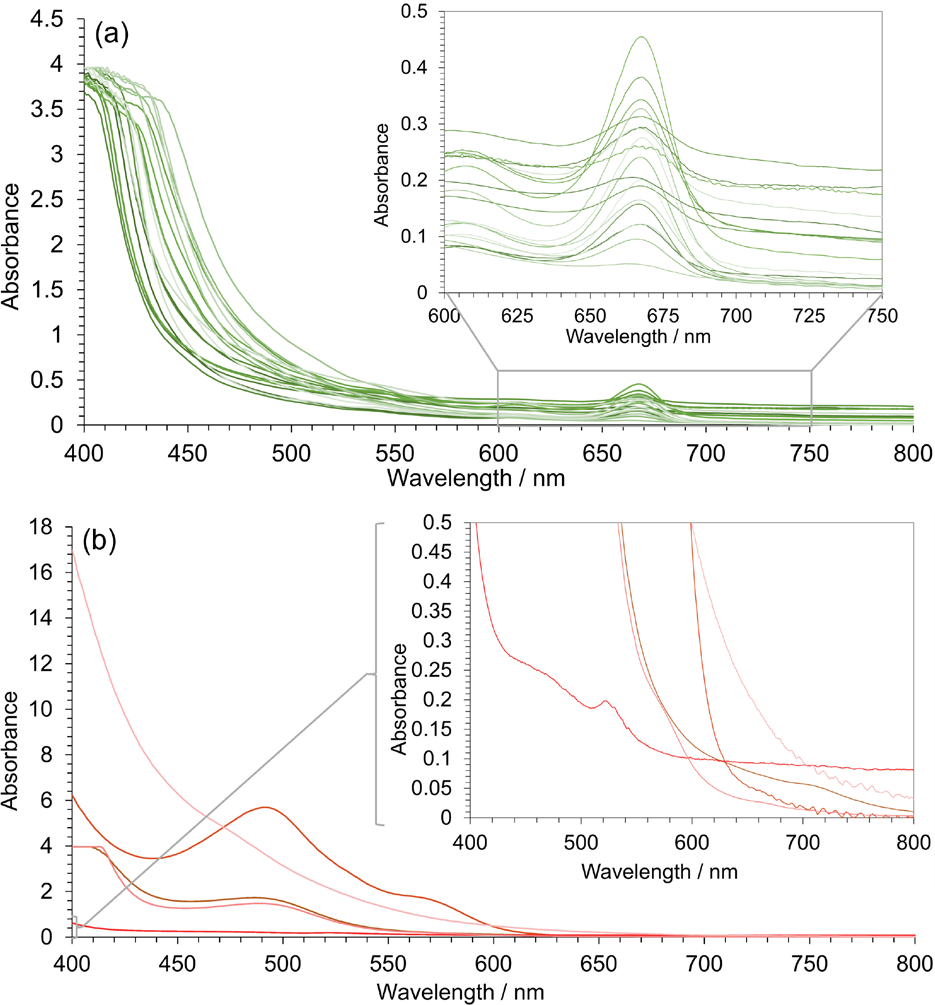
Traditionally, color has been used as one of the main attributes for classifying propolis in Brazil.3 Although color alone is not enough to determine the propolis type, it may provide a simple and rapid indication about its possible classification and characteristics, especially when combined with a chemical profile analysis. In accordance with Brazilian legislation, propolis extracts should typically exhibit absorption bands between 200 and 400 nm (ultraviolet region), mainly due to the presence of flavonoids.43 In the present study, molecular spectroscopy in the visible region (between 400 and 800 nm) was used to objectively assess the color of propolis extracts, emphasizing two key wavelength ranges: 630 750 nm, associated with green solutions, and 450-600 nm, associated with red solutions.44 Overall overlaid spectra revealed that all propolis extracts exhibited the highest absorption around 400 nm, despite quite distinct profiles in other regions of the visible spectrum (Figure S4, SI section). Spectra of samples showing bands consistent with green and red colors are presented in Figure 3. Herein, samples displaying a high absorption band around 630-700 nm were designated as “green”, while those showing higher absorption bands between 450-600 nm were classified as “red”. A third group, called “others”, included analyzed samples that lacked distinctive absorption bands within the mentioned wavelength ranges. This classification resulted in 19 samples included in the green class (AP02, AP06, AP10, AP11, AP14, AP17, AP22, AP23, AP32, AP34, AP39, AP41-AP45, AP50, AP54, AP60) and 5 in the red class (AP16, AP21, AP35, AP48, AP53). The remaining samples (n = 30) were provisionally categorized as others.
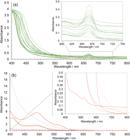
Overlay of molecular absorption spectra in the visible wavelength range (400-800 nm) for propolis extracts with bands at (a) 630 750 nm (green solutions), and (b) 450-600 nm (red solutions). The inserts are zoomed-in views of the overlaid spectra (for better visualization of propolis samples with lower absorption).
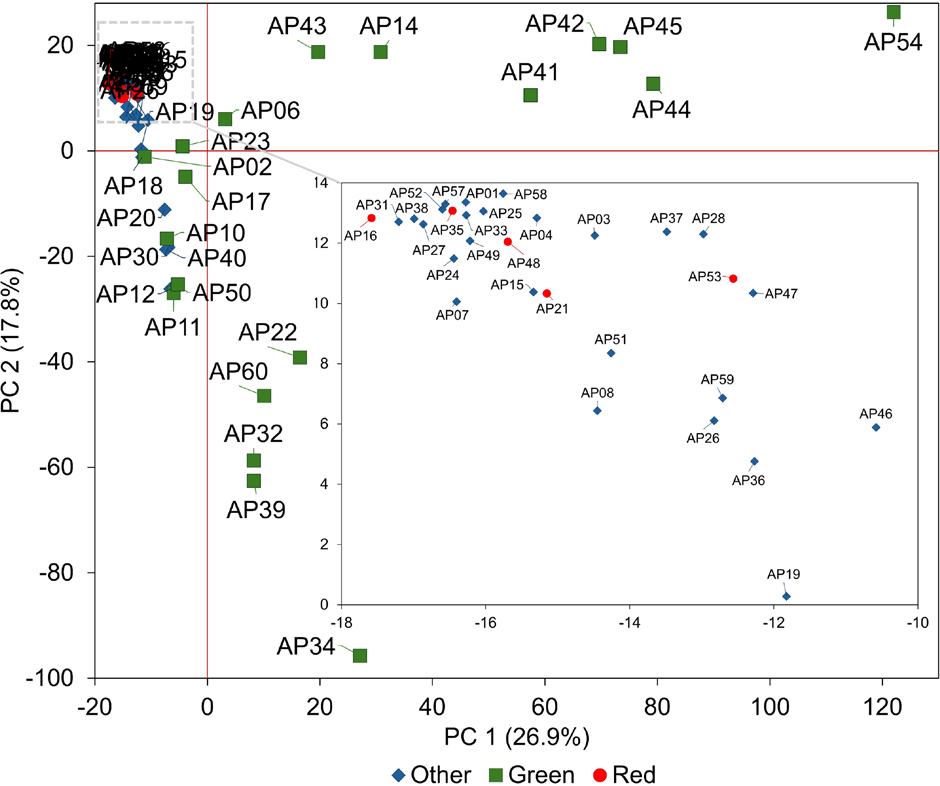
To evaluate whether these color-based groups (green, red, and others) corresponded to distinct metabolic signatures, the chemical profile data obtained by LC-MS were projected onto the PCA scores plot (Figure 4 for negative ionization mode and Figure S5, SI section, for positive ionization mode). While green and red propolis clustered distinctly, green samples showed much higher internal chemical variability compared to the other classes. Samples from the others class were projected mainly on the negative part of PC1 and the positive part of PC2, jointly with samples from the red class, although a few samples from others overlapped with the green samples on the quadrant of negative PC1 and negative PC2. Regarding the geographical origin within Vale do Jequitinhonha, no clear distinction was observed based on propolis color attributes (Figure S6, SI section). Although a greater presence of “green” samples was also observed in the Alto Jequitinhonha microregion, samples from all color classes (green, red, and others) were found across different locations within the Vale do Jequitinhonha mesoregion.
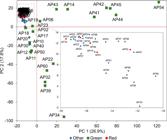
PCA scores plot for chemical profile data acquired in negative ionization mode for propolis samples color-coded based on the presence of absorption bands in the regions of 630-750 nm (green class), 450 600 nm (red class), and the samples that had no absorption bands in these regions (others class).
It is important to emphasize that the designations green and red in this study are used solely as descriptive labels derived from spectrophotometrically measured color characteristics, which do not imply any geographical certification nor botanical source definition for now. According to the official Brazilian indication of origin (Portaria IMA No. 1603/2016),45 “Própolis Verde” refers exclusively to propolis collected in specific municipalities of Minas Gerais that meet certification criteria. None of the samples in the present dataset originated from those areas.45 Similarly, red propolis refers to propolis originating from coastal areas in Northeast Brazil, produced with red resin from Dalbergia ecastaphyllum (L.) Taub. or Symphonia globulifera L. f.12,46
Chemical markers of green and red propolis from Vale do Jequitinhonha
Considering the observations on the green and red colors of some propolis extracts from Vale do Jequitinhonha, some already reported compounds characteristic of green and red propolis were actively searched for in the chemical profile data. This compound screening, performed using the software Skyline and based on calculated monoisotopic m/z values, in combination with compound identity qualification using MS2 spectra, included compounds such as caffeoylquinic acids, artepillin C, formononetin, vestitol, and others. Full compound details, including retention time, m/z value, and major fragment ions, are provided in Table S2 (SI section), as well as in the fragmentation spectra shown in Figures S12-S16 (SI section). Peak areas were integrated and compared among the analyzed samples, as shown in Figures S7-S11 (SI section), allowing visual inspection of compound distribution across color classes (green, red, and others). The results indicate the presence of several typical green propolis constituents, such as artepillin C, drupanin, baccharin, and caffeoylquinic acid derivatives, which are known products from Baccharis dracunculifolia DC. Higher intensities of these compounds were found in the propolis samples belonging to the green class (Figures S7, S8 and S9), defined by molecular spectrophotometry, which is consistent with the chemical characteristics of green propolis.
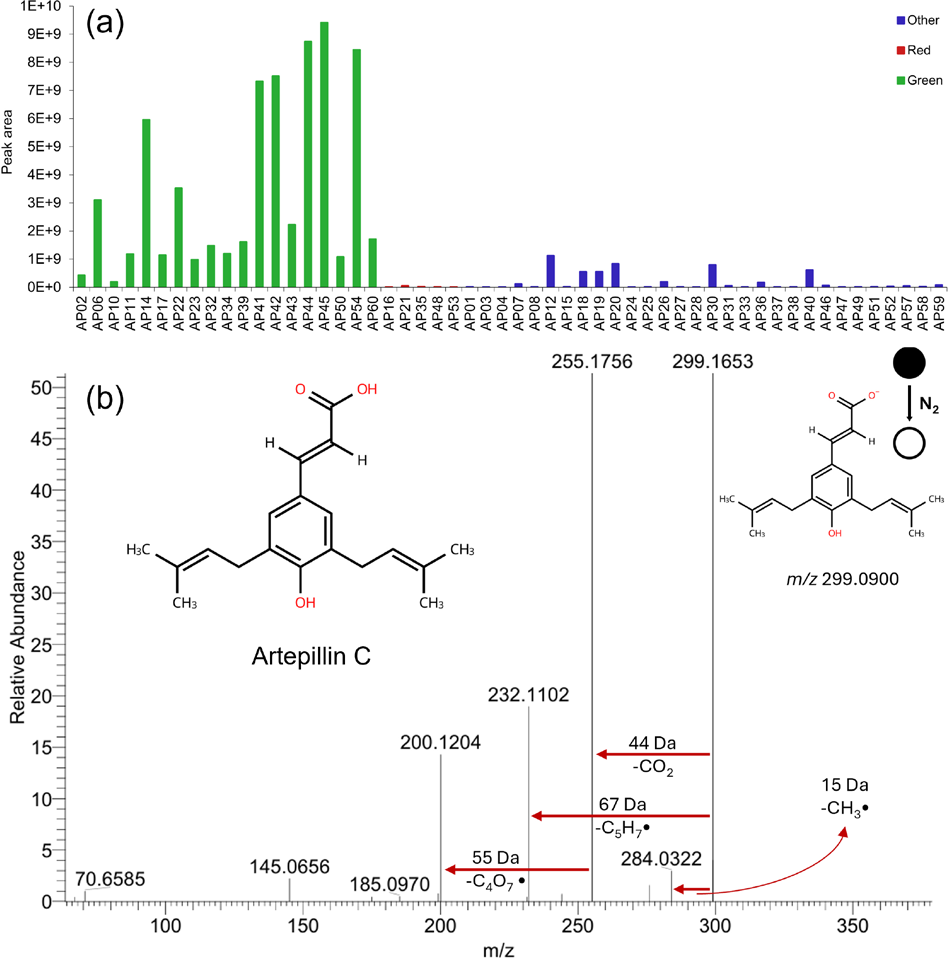
Notably, artepillin C (3,5-diprenyl-4-hydroxycinnamic acid), which is considered a major chemical marker of green propolis,47 showed markedly higher peak areas for green samples, especially those from the Diamantina microregion (Figure 5a). Interestingly, artepillin C was also detected at lower concentrations in some propolis samples belonging to others class, suggesting a possible overlap of resin sources or transitional plants used by bees in this territory. The MS/MS spectrum of artepillin C exhibited fragment ions consistent with the literature, including losses of prenyl and carboxyl groups (Figure 5b), which supports the compound annotation.48,49
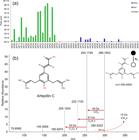
(a) Bar graph showing the peak areas for the extracted ion chromatograms of artepillin C (m/z 299.165) in negative ion mode for all analyzed samples. (b) MS/MS spectrum with fragment annotations.
In contrast, propolis samples from the red class exhibited higher levels of formononetin, vestitol, neovestitol, and liquiritigenin derivatives, compounds that have been associated with Dalbergia ecastaphyllum (L.) Taub. botanical origin (Figures S10 and S11).50 Some metabolites commonly reported in Northeastern red propolis, including isoflavonoids and flavanones,51 were also detected in certain samples from Vale do Jequitinhonha, suggesting either overlapping plant sources or some kind of uncharacterized bee foraging behavior in this region. When considering the sum of the characteristic metabolites from red propolis that were present in samples of the red class (Figure S17), a clear association can be observed with the visual intensity of the red color in the extracts.
Pigments have also been previously proposed as contributors to the characteristic red color of propolis originated from Dalbergia. Retusapurpurin A and B were identified in Dalbergia ecastaphyllum (L.) Taub. exudates and reported in Brazilian red propolis by Piccinelli et al.,52 being detected in chromatograms monitored around 490 nm. However, those compounds were not detected in the present dataset.
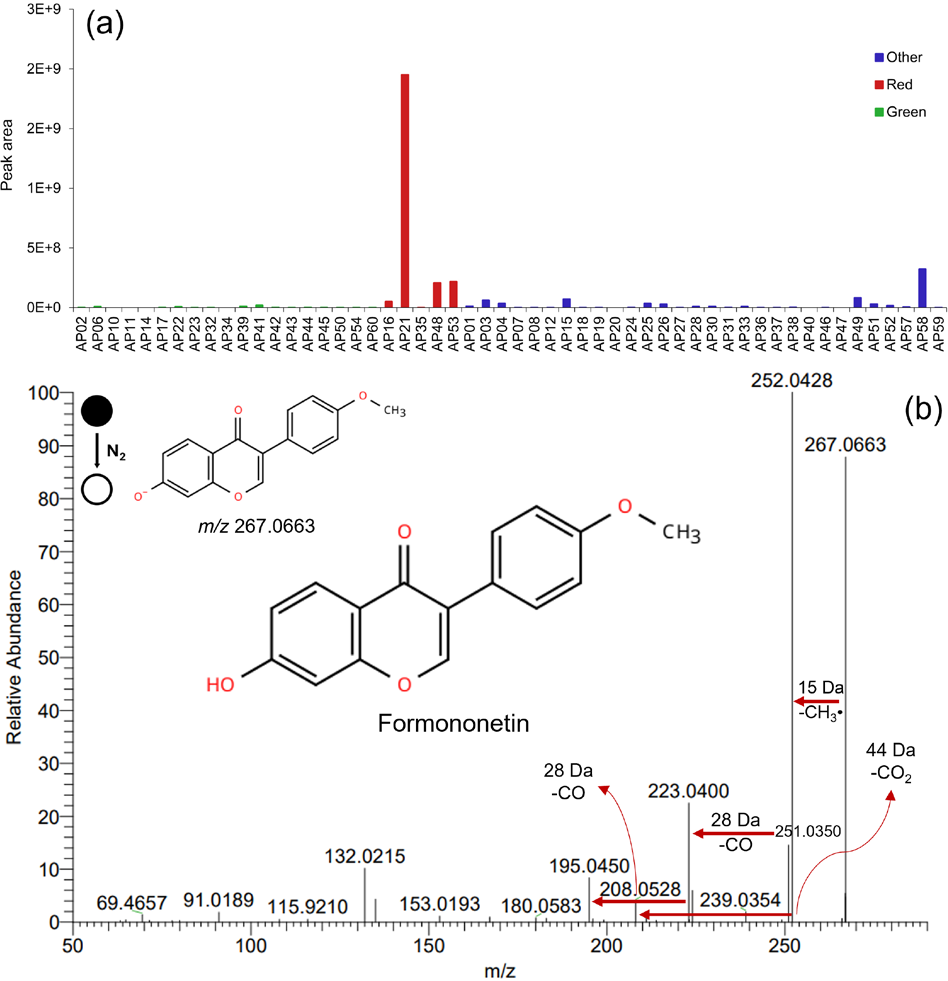
Formononetin (7-hydroxy-4’-methoxyisoflavone), a well-known isoflavonoid marker commonly associated with red propolis, showed higher peak areas in the samples classified as red, particularly AP21 (Figure 6a). This distribution is consistent with its frequent occurrence in red propolis chemical profiles and supports its use as a discriminatory metabolite for this class. Interestingly, this compound was also detected at lower levels in a few samples classified as green and “others”. The MS/MS spectrum of formononetin (Figure 6b) displayed a demethylation product at m/z 252 ([M - H - CH3]-) and subsequent characteristic fragments commonly reported for this compound.53,54
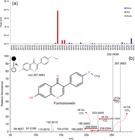
(a) Bar graph showing the peak areas for the extracted ion chromatograms of formononetin (m/z 267.0663) in negative ion mode for all analyzed samples. (b) MS/MS spectrum with fragment annotations.
Correlation analysis between chemical profile and visible spectrophotometric data
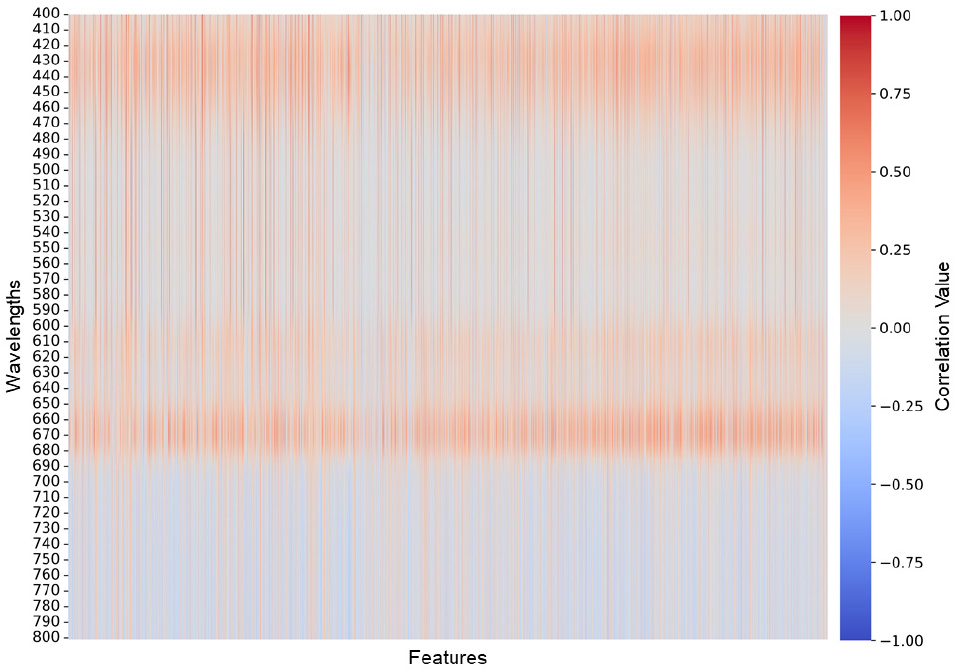
To further expand the integrative analysis of propolis chemical profile and color characteristics, an exploratory correlation analysis inspired by the principles of statistical total correlation spectroscopy (STOCSY) was performed, correlating absorbance values (measured from 400 to 800 nm, at 1 nm interval) with the untargeted metabolomics data acquired under both positive and negative ionization modes. A heatmap of the correlation matrix (Figure 7) allows the observation of strong correlations (i.e., darker colors) for several propolis compounds in the wavelength range of 650 to 690 nm, a region associated with the green class. A slightly darker color pattern was also observed between 590 and 620 nm, a region where less intense spectral bands were present for some propolis samples, which were mainly classified in the green class. In addition, only a relatively small number of molecular features had strong correlations for most wavelengths, especially between 470 and 580 nm.
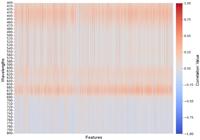
Correlation heatmap between UV-Vis absorbance (400-800 nm) and LC-MS features across all samples, highlighting strong associations between visible color traits and specific metabolites.
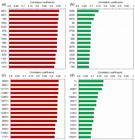
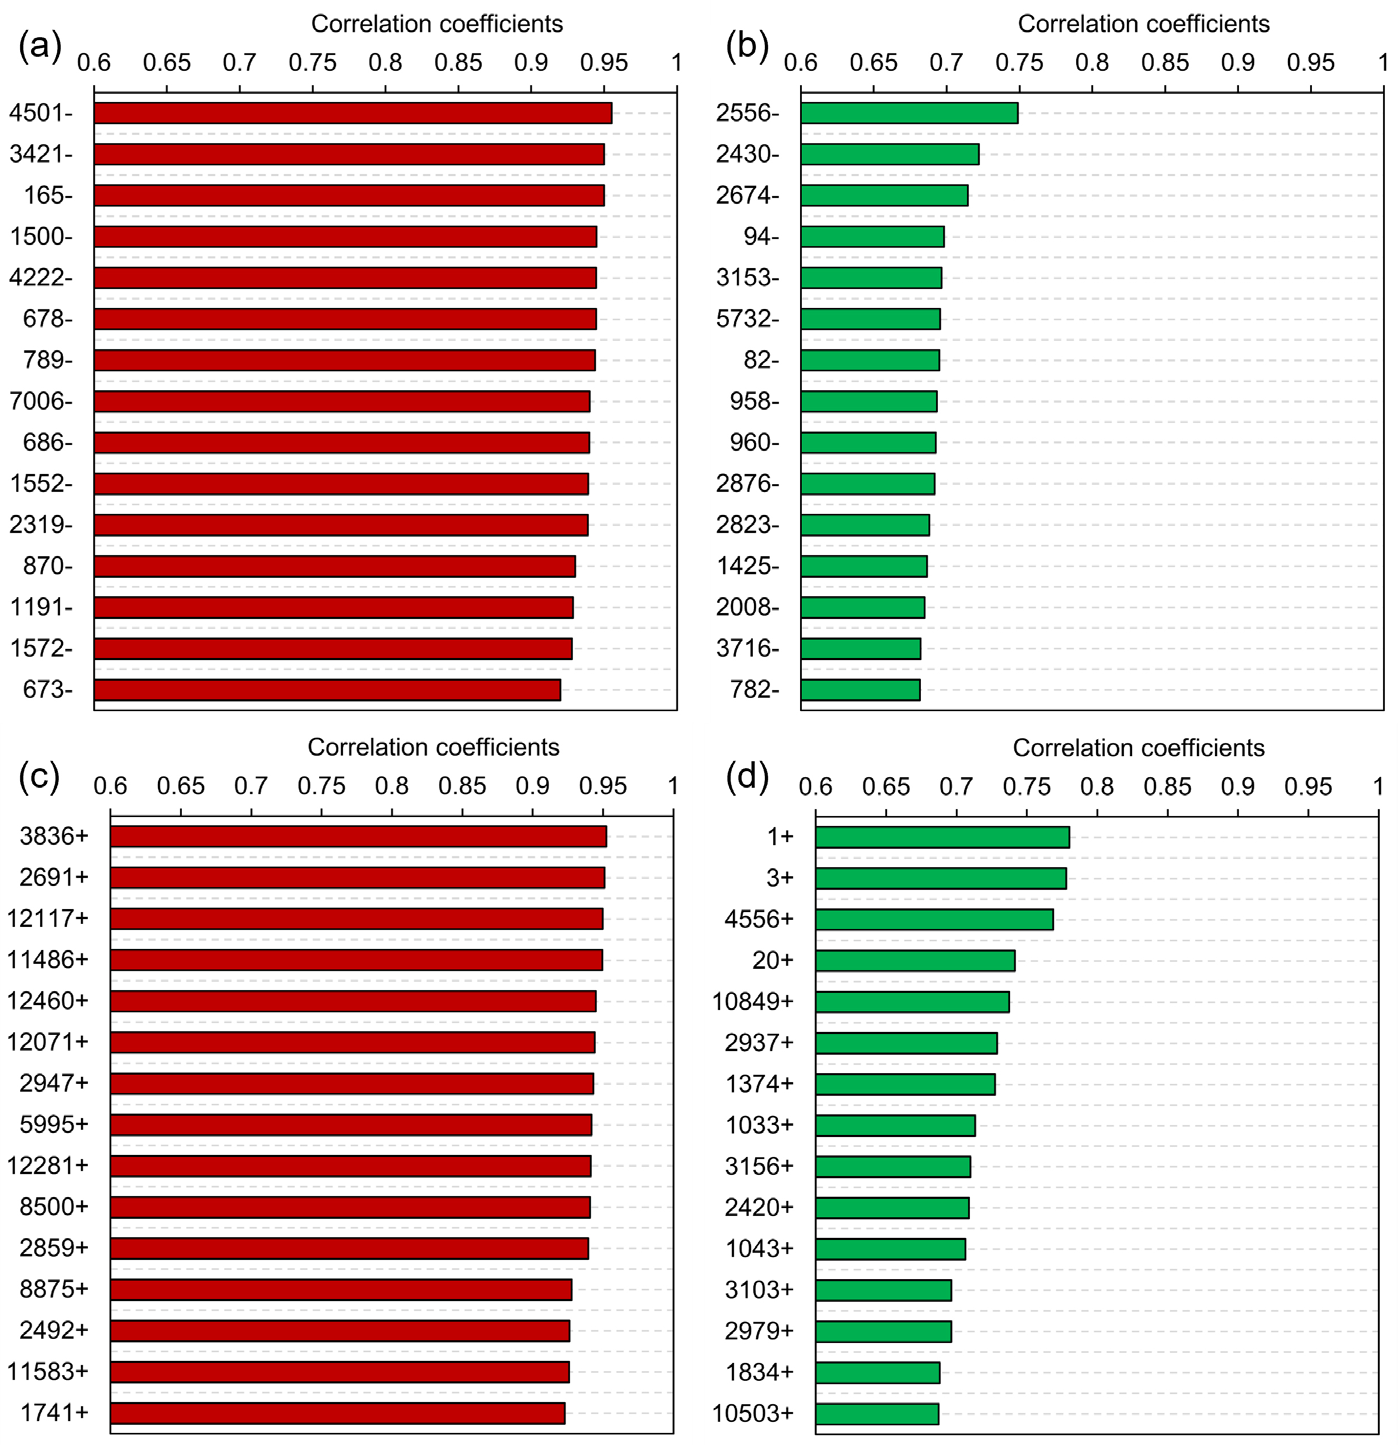
Top 15 compounds showing the strongest correlations between LC-MS features intensities and UV-Vis absorbances. (a) Correlations obtained at 495 nm in the negative ionization mode, (b) correlations at 670 nm in the negative ionization mode; (c) correlations at 495 nm in the positive ionization mode; (d) correlations at 670 nm in the positive ionization mode.
From the full correlation matrix, the top 15 compounds showing the highest correlations at 495 and 670 nm were extracted (corresponding to the apex of the absorption bands red and green classes, respectively), for untargeted metabolomics data acquired under negative and positive ion modes, as shown in Figure 8. Notably, correlations within the red class were substantially stronger, reaching values near 1. This is most likely due to the exceptionally high absorbance values of samples AP21 and AP53 at 495 nm, surpassing the absorbance of propolis samples classified as green at wavelengths associated with the green color.
More details on the top 15 correlated compounds are summarized in Table 1, including tentative annotations. Despite the use of high-resolution MS and MS/MS data (Figures S18-S31, SI section), a substantial fraction of the selected features cannot be assigned to confident molecular identities through manual searches in public databases/spectral libraries or through an automated workflow in Compound Discoverer. All proposed annotations were individually curated, based on spectral and chemical plausibility, an important part of the metabolite annotation process, even when using automated platforms like Compound Discoverer as exploratory tools in identification frameworks applied to chemically diverse matrices.
List of compounds with higher correlation coefficients (r) found in the correlation analysis for metabolomics data at the selected wavelengths (λ) of 495 nm (red color) or 670 nm (green color), as plotted in Figure 8
Among the features showing the highest absolute correlations, some compounds could be annotated with higher confidence, based on a combination of exact mass measurements, consistent isotopic distribution patterns, and fragmentation spectra, supported by comparisons with mzCloud and additional public databases/spectral libraries (HMDB, KEGG, and PubChem) using computer-assisted annotation software (CEU Mass Mediator and MetFrag).59-63 No compound annotation was confirmed using authentic reference standards. These compounds predominantly belonged to the classes of flavonoids, dihydrochalcones, and related phenolic subclasses, whose fragmentation spectra displayed characteristic product ions commonly associated with aromatic ring cleavages and neutral losses typical of these structures.64,65
Propolis is known to be chemically enriched in phenolic acids, flavonoids, and related aromatic compounds, which contain multiple hydroxyl and carboxyl functional groups that readily undergo deprotonation under electrospray ionization conditions. As a result, the negative ionization mode is generally considered more chemically selective for propolis extracts, thereby favoring the detection of structurally relevant constituents via formation of stable [M - H]- ions. This behavior has been widely reported in LC-MS studies of propolis and other phenolic-rich natural matrices.66 In contrast, in the present study, the positive ionization mode yielded a larger number of detected molecular features and tentative annotations. This reflects the broader ionization coverage of positive electrospray ionization, which efficiently protonates a wide range of molecular classes and is strongly represented in spectral libraries.67 While this aspect enables the detection of additional metabolites, it may also include compounds with limited chemical relevance to the core propolis matrix.
Among the unknown features, particularly those detected in negative ionization mode, recurring neutral losses, such as CO2 (-43.9898 Da), H2O (-18.0106 Da) and CO (-27.9949 Da), were frequently observed, consistent with carboxylated and carbonyl-containing aromatic metabolites, fragmentation pathways commonly reported for phenolic constituents of propolis and other plant-derived matrices.66,68,69 Several unknown compounds yielded diagnostic low-mass ions (m/z 121.029 and 107.050), consistent with benzoate or phenoxide type fragments, supporting the prevalence of substituted phenolic compounds. In addition, one highly oxygenated unknown compound (ID 2823-, 670 nm) exhibited a carbohydrate-like product ion (m/z 161.046), suggesting a glycosidic derivative. On the other hand, some unknown compounds produced fragments with atypical mass defects (m/z 84.960 in IDs 12117+, 11486+, 12071+, 8875+ at 495 nm, and IDs 4556+, 2420+ at 670 nm), raising the possibility of adduct-driven fragmentation, background ions, or contaminant contribution.
As summarized in Table 1, the correlated features detected in this study were dominated by phenolic-related compounds, including flavonoids, dihydrochalcones, methoxylated phenolics, and phenolic glycosides. These classes were predominantly observed in negative ionization mode and were mainly associated with correlation in the beginning of the visible spectral region, consistent with the presence of conjugated aromatic systems.70-73
Methoxylated phenolic compounds constituted a recurrent subclass among the annotated features, as evidenced by multiple features showing characteristic neutral losses associated with methylated aromatic fragments in their MS2 spectra (e.g., -15 Da, CH3 loss, and exhibiting intermediate chromatographic retention (tR ca. 10.9-11.5 min, IDs 678-, 673-, 686-, 1741+, 495 nm), which is expected for these types of compounds.74,75
Phenolic glycosides were also tentatively annotated among the correlated features (ID 5732-, 958-, 960-, 670 nm), particularly those exhibiting high oxygen content and early elution behavior. Their MS2 spectra showed fragmentation patterns compatible with sugar cleavage, including losses consistent with glycosidic fragmentation.
Flavonoids were among the most prominent phenolic subclasses observed in the dataset, with several features tentatively annotated as flavone (oroxylin A, IDs 673-, 1741+, 495 nm), dihydroxyflavanone (ID 2319-, 495 nm), or dihydrochalcone (ID 1572-, 495 nm) compounds. These features showed consistent fragmentation patterns dominated by aromatic ring cleavages and neutral losses characteristic of flavonoid structures and were among those exhibiting the strongest correlations with visible absorbance.
Among the tentatively annotated flavonoids, oroxylin A was detected in both ionization modes (ID 673- and 1741+, 495 nm) and showed strong correlations with visible absorbance around 495 nm. Its MS2 spectra exhibited characteristic fragmentation of methoxylated flavones and aromatic ring cleavages, supporting its tentative annotation based on accurate mass, isotopic distribution, and database matching. Oroxylin A is a plant metabolite and has been previously reported in propolis.1,76 This compound has been described as a secondary metabolite of Scutellaria racemosa Pers., a species documented in Minas Gerais according to Flora e Funga do Brasil.76,77
Asebogenin was tentatively annotated as a dihydrochalcone flavonoid (ID 1572-, 495 nm). Its MS2 spectrum showed fragmentation behavior consistent with dihydrochalcones, dominated by aromatic ring cleavages and neutral losses associated with phenolic fragments. It has been previously reported as a plant secondary metabolite in species such as Pityrogramma calomelanos (L.) Link and Piper aduncum L., both of which are documented in the Cerrado biome, including regions of Minas Gerais.78-81 Asebogenin has been reported to exhibit potent antithrombotic effects.82
Hydroxycinnamic acid derivatives constituted a well-defined group among the highly correlated features, including chlorogenic acid / neochlorogenic acid (IDs 782-, 1834+, 670 nm), caffeoyl-feruloylquinic acid derivatives (ID 3153-, 670 nm) and 3,4-dihydroxyphenylpropionic acid (dihydrocaffeic acid) (ID 1043+, 670 nm). Chlorogenic acid is a well-established constituent of propolis, having been previously reported by Kurek-Górecka et al.56 Caffeoyl-feruloylquinic acid was also observed, in agreement with previous reports in propolis samples, as described by Righi et al.83 These compounds are widely recognized for their potent antioxidant and anti-inflammatory properties, which are frequently associated with the biological activity attributed to propolis extracts.84
Liquiritigenin was tentatively annotated among the selected molecular features, being a well-established constituent of Brazilian red propolis, and the main characteristic flavanone.51 The occurrence of liquiritigenin is further supported by its documented presence in propolis matrices by recent studies.85 In addition, its therapeutic potential in cancer treatment has been described, as reviewed by Sajeev et al.86 The presence of liquiritigenin across individual propolis samples is illustrated in Figure S10.
In addition to phenolic metabolites, several nitrogenated and highly polar compounds, including betaine, valine/norvaline, and nucleobases such as cytosine, uracil, and isocytosine, were tentatively annotated, predominantly in positive ionization mode. These compounds are commonly associated with primary metabolism and are not expected to act as chromophoric contributors in the visible region.87
A relationship between compound classes and the correlated wavelengths was observed among the correlated features. Compounds showing strong correlations around 495 nm were predominantly associated with phenolic compounds bearing conjugated aromatic systems, including flavonoids, dihydrochalcones, and hydroxycinnamic acid derivatives. These classes are characterized by intense π → π* electronic transitions in the UV region,73 with absorption tails extending into the beginning of the visible range, which is consistent with their recurrent detection among the most strongly correlated features. In contrast, correlation observed at 670 nm involved fewer features and greater structural heterogeneity, with no evidence of classical long-wavelength pigments, such as porphyrins or carotenoids. This suggests that absorbance at longer wavelengths does not arise from specific pigment molecules. The predominance of absorbance at the beginning of the visible region is consistent with the molecular features of the compounds detected in this study. Aromatic rings and conjugated π-electron systems, which are abundant among phenolic compounds and flavonoids, exhibit intense electronic transitions primarily in the ultraviolet region, with absorption tails extending into the near-visible range.88 As the degree of conjugation increases, due to additional aromatic rings or extended π-systems, the absorption maximum can be progressively shifted toward longer wavelengths, contributing to detectable absorbance in the visible region.
Regarding the group of samples classified as “others”, it is plausible that at least part of this group could be discussed within the broad category commonly referred to as Brazilian brown propolis. In contrast to green and red propolis, which are more frequently associated with specific chemical markers, geographical and botanical factors, brown propolis is treated far less consistently in the literature and is reported across multiple Brazilian regions with diverse resin sources, leading to pronounced chemical heterogeneity and overlap with other propolis types.89
Consistent with this, brown propolis has been reported in some studies to share phenolic constituents typically associated with green propolis, including drupanin, artepillin C, p-coumaric acid, caffeic acid and several flavonoids that expands its overall phenolic fingerprint.90 In our dataset, several of these compounds were also detected in the samples classified as “others”, as shown in Figures S7-S11, which could indicate that at least part of these samples may fall within the chemical space often attributed to brown propolis.
At the same time, alternative Brazilian propolis designations are less consistent with the chemistry observed here. Yellow propolis from the Pantanal is described as having little or no phenolic compounds and being characterized by the presence of triterpenoids/steroids and other low-polarity constituents, which does not match the profiles observed in the “others” group in the present study.13 Likewise, Amazonian black propolis is characterized by polyisoprenylated benzophenones, as well as red propolis from Symphonia globulifera, comprising compounds that were not observed in our samples.46,91
Overall, the chemical profile obtained in this study reflects the intrinsic complexity of propolis as a natural matrix derived from multiple, often unknown, botanical sources. A substantial fraction of the detected molecular features was tentatively annotated by chemical class, whereas many features remained classified as unknown, which is not unexpected given the high structural diversity of plant secondary metabolites and the limited coverage of existing spectral databases. In particular, phenolic compounds and flavonoids comprise numerous positional and structural isomers that share identical molecular formulas and highly similar MS2 fragmentation patterns, making unequivocal isomeric differentiation impossible without authentic reference standards or complementary analytical techniques.
The precise botanical origin of propolis resins cannot be fully established based solely on the chemical profile analysis, as performed in the present study. Bees forage across a wide range of plant species whose metabolic profiles remain incompletely characterized, especially in biodiverse regions such as Vale do Jequitinhonha. It is noteworthy that none of the detected compounds can be considered as classical pigments when evaluated in isolation. Instead, several flavonoids and hydroxycinnamic acid derivatives act as chromophoric phenolic compounds that collectively contribute to visible absorbance and color modulation in propolis. The integration of LC MS metabolomics data with visible-range spectroscopy absorbance data supports an integrative strategy for the objective interpretation of propolis color variability related to its chemical composition.
Conclusions
Untargeted metabolomics analysis revealed substantial variability in the chemical composition of propolis samples from Vale do Jequitinhonha. No clear differentiation was observed among most microregions, with the notable exception of Diamantina, whose samples exhibited a distinct and more consistent chemical profile. The integration of metabolomics data with visible-range molecular absorption spectroscopy via correlation-based analysis indicated that propolis color is associated with the collective contribution of multiple phenolic compounds, rather than with a single pigment molecule. Compounds commonly reported as markers of green and red propolis, such as artepillin C and liquiritigenin, were detected in samples from outside their classical regions of occurrence, and extracts exhibiting visible absorption bands characteristic of red coloration were also observed. Future studies will be important for further understanding the botanical origin of red propolis in this mesoregion, as well as for providing more quality indicators for consumers and beekeepers in Vale do Jequitinhonha.
-
This publication is part of the special issue “Omics Sciences”
Supplementary Information
Supplementary information (Figures S1-S31 and Tables S1-S2, including additional information about the study samples, quality control plots, PCA results, UV-Vis spectra, and compound peak area data) is available free of charge at http://jbcs.sbq.org.br as a PDF file.
Supplementary material 1
Acknowledgments
The authors thank the Brazilian agencies CAPES, CNPq, and FAPEMIG for financial support, as well as the Núcleo de Extensão e Prestação de Serviços (NEPS) and the Centro de Ensino e Inovação (CEI) of the Department of Chemistry at Universidade Federal de Minas Gerais for instrumental analysis, and all the beekeepers who kindly provided the propolis samples used in this study. In particular, ARR thanks to FAPEMIG RED-00039-23 and CNPq Productivity scholarship 311665/2022-5 and INCT Pollination (CNPq/CAPES/FAPERJ Call 58/2022) for the support received.
Data Availability Statement
Data are available from the corresponding author upon request.
References
-
1 Ożarowski, M.; Karpiński, T. M.; Alam, R.; Łochyńska, M.; Microorganisms 2022, 10, 364. [Crossref]
» Crossref -
2 Nayak, G.; Sahu, A.; Bhuyan, S. K.; Bhuyan, R.; Kar, D.; Kuanar, A.; Int. Res. J. Multidiscip. Scope 2024, 5, 317. [Crossref]
» Crossref -
3 Berretta, A. A.; Arruda, C.; Miguel, F. G.; Baptista, N.; Nascimento, A. P.; Marquele-Oliveira, F.; Hori, J. I.; Barud, H. S.; Damaso, B.; Ramos, C.; Ferreira, R.; Bastos, J. K. In Superfood and Functional Food - An Overview of Their Processing and Utilization; InTech: London, UK, 2017. [Crossref]
» Crossref -
4 Anjum, S. I.; Ullah, A.; Khan, K. A.; Attaullah, M.; Khan, H.; Ali, H.; Bashir, M. A.; Tahir, M.; Ansari, M. J.; Ghramh, H. A.; Adgaba, N.; Dash, C. K.; Saudi J. Biol. Sci. 2019, 26, 1695. [Crossref]
» Crossref -
5 Hossain, R.; Quispe, C.; Khan, R. A.; Saikat, A. S. M.; Ray, P.; Ongalbek, D.; Yeskaliyeva, B.; Jain, D.; Smeriglio, A.; Trombetta, D.; Kiani, R.; Kobarfard, F.; Mojgani, N.; Saffarian, P.; Ayatollahi, S. A.; Sarkar, C.; Islam, M. T.; Keriman, D.; Uçar, A.; Martorell, M.; Sureda, A.; Pintus, G.; Butnariu, M.; Sharifi Rad, J.; Cho, W. C.; Chin. Med. 2022, 17, 100. [Crossref]
» Crossref -
6 Kasote, D.; Bankova, V.; Viljoen, A. M.; Phytochem. Rev. 2022, 21, 1887. [Crossref]
» Crossref -
7 Kuo, C.-C.; Wang, R.-H.; Wang, H.-H.; Li, C.-H.; Support. Care Cancer 2018, 26, 4001. [Crossref]
» Crossref -
8 Liu, M.; Li, X.; Chen, H.; Pan, F.; Zheng, X.; Battino, M.; Tian, W.; Peng, W.; Food Sci. Hum. Wellness 2025, 14, 9250236. [Crossref]
» Crossref -
9 Felício, I. M.; Cavalcanti, A. M. T.; Baranger, K.; de Oliveira Jr., R. G.; Poirot, B.; Picot, L.; Cavalcante, F. A.; Fitoterapia 2025, 185, 106687. [Crossref]
» Crossref -
10 Park, Y. K.; Alencar, S. M.; Aguiar, C. L.; J. Agric. Food Chem. 2002, 50, 2502. [Crossref]
» Crossref -
11 Daugsch, A.; Moraes, C. S.; Fort, P.; Park, Y. K.; Evid. Based Complement. Alternat. Med. 2008, 5, 435. [Crossref]
» Crossref -
12 Ccana-Ccapatinta, G. V.; Mejía, J. A. A.; Tanimoto, M. H.; Groppo, M.; de Carvalho, J. C. A. S.; Bastos, J. K.; Molecules 2020, 25, 2060. [Crossref]
» Crossref -
13 Machado, C. S.; Mokochinski, J. B.; de Lira, T. O.; de Oliveira, F. D. C. E.; Cardoso, M. V.; Ferreira, R. G.; Sawaya, A. C. H. F.; Ferreira, A. G.; Pessoa, C.; Cuesta-Rubio, O.; Monteiro, M. C.; de Campos, M. S.; Torres, Y. R.; Evid. Based Complement. Alternat. Med. 2016, 2016, 6057650. [Crossref]
» Crossref -
14 Salatino, A.; Teixeira, É. W.; Negri, G.; Message, D.; Evid. Based Complement. Alternat. Med. 2005, 2, 33. [Crossref]
» Crossref -
15 Dias, M. M.; Santos, W. S. D.; Primo, S. R.; Ferreira, R. G. C.; Santos, H. O.; Araújo, A. A. D.; Calaça, P.; Santos, E. M. S.; Rev. Gest. Soc. Ambient. 2025, 19, e011922. [Crossref]
» Crossref -
16 Dias, M. M.; Ferreira, R. G. C.; Santos, W. S. D.; Rodrigues, J. F.; Dourado, D. S.; Alves, D. D. S.; Araújo, A. A. D.; Calaça, P.; Santos, H. O.; Santos, E. M. S.; Rev. Gest. Soc. Ambient. 2025, 19, e011844. [Crossref]
» Crossref -
17 Silva, M. C. M.; Macedo, A. N.; Moreira, O. B. O.; Oliveira, M. A. L.; Ren, Z.-X.; Rech, A. R.; J. Apic. Res. 2025, 64, 1352. [Crossref]
» Crossref -
18 Stavropoulou, M. -I.; Termentzi, A.; Kasiotis, K. M.; Cheilari, A.; Stathopoulou, K.; Machera, K.; Aligiannis, N.; Molecules 2021, 26, 456. [Crossref]
» Crossref -
19 Pratami, D. K.; Mun’im, A.; Sahlan, M.; Kumazawa, S.; Jantan, I.; Rahmawati, S. I.; Putra, M. Y.; Bayu, A.; J. Funct. Foods 2024, 123, 106602. [Crossref]
» Crossref -
20 Kamatou, G.; Sandasi, M.; Tankeu, S.; Vuuren, S. V.; Viljoen, A.; Rev. Bras. Farmacogn. 2019, 29, 351. [Crossref]
» Crossref -
21 Saftić, L.; Peršurić, Ž.; Fornal, E.; Pavlešić, T.; Kraljević Pavelić, S.; J. Pharm. Biomed. Anal. 2019, 165, 162. [Crossref]
» Crossref -
22 Turco, J. F.; Mokochinski, J. B.; Torres, Y. R.; J. Pharm. Biomed. Anal. 2025, 252, 116497. [Crossref]
» Crossref -
23 Pratami, D. K.; Sahlan, M.; Bayu, A.; Putra, M. Y.; Ibrahim, B.; Siswadi; Qodriah, R.; Mun’im, A.; Molecules 2024, 29, 4037. [Crossref]
» Crossref -
24 Anđelković, B.; Vujisić, L.; Vučković, I.; Tešević, V.; Vajs, V.; Gođevac, D.; J. Pharm. Biomed. Anal. 2017, 135, 217. [Crossref]
» Crossref -
25 Wilson, M. B.; Spivak, M.; Hegeman, A. D.; Rendahl, A.; Cohen, J. D.; PLoS One 2013, 8, e77512. [Crossref]
» Crossref -
26 Chen, L.; Lu, W.; Wang, L.; Xing, X.; Chen, Z.; Teng, X.; Zeng, X.; Muscarella, A. D.; Shen, Y.; Cowan, A.; McReynolds, M. R.; Kennedy, B. J.; Lato, A. M.; Campagna, S. R.; Singh, M.; Rabinowitz, J. D.; Nat. Methods 2021, 18, 1377. [Crossref]
» Crossref -
27 Cloarec, O.; Dumas, M.-E.; Craig, A.; Barton, R. H.; Trygg, J.; Hudson, J.; Blancher, C.; Gauguier, D.; Lindon, J. C.; Holmes, E.; Nicholson, J.; Anal. Chem. 2005, 77, 1282. [Crossref]
» Crossref -
28 Chambers, M. C.; Maclean, B.; Burke, R.; Amodei, D.; Ruderman, D. L.; Neumann, S.; Gatto, L.; Fischer, B.; Pratt, B.; Egertson, J.; Hoff, K.; Kessner, D.; Tasman, N.; Shulman, N.; Frewen, B.; Baker, T. A.; Brusniak, M.-Y.; Paulse, C.; Creasy, D.; Flashner, L.; Kani, K.; Moulding, C.; Seymour, S. L.; Nuwaysir, L. M.; Lefebvre, B.; Kuhlmann, F.; Roark, J.; Rainer, P.; Detlev, S.; Hemenway, T.; Huhmer, A.; Langridge, J.; Connolly, B.; Chadick, T.; Holly, K.; Eckels, J.; Deutsch, E. W.; Moritz, R. L.; Katz, J. E.; Agus, D. B.; MacCoss, M.; Tabb, D. L.; Mallick, P.; Nat. Biotechnol. 2012, 30, 918. [Crossref]
» Crossref -
29 MacLean, B.; Tomazela, D. M.; Shulman, N.; Chambers, M.; Finney, G. L.; Frewen, B.; Kern, R.; Tabb, D. L.; Liebler, D. C.; MacCoss, M. J.; Bioinformatics 2010, 26, 966. [Crossref]
» Crossref -
30 Pang, Z.; Lu, Y.; Zhou, G.; Hui, F.; Xu, L.; Viau, C.; Spigelman, A. F.; MacDonald, P. E.; Wishart, D. S.; Li, S.; Xia, J.; Nucleic Acids Res. 2024, 52, W398. [Crossref]
» Crossref -
31 Loos, M.; Gerber, C.; Corona, F.; Hollender, J.; Singer, H.; Anal. Chem. 2015, 87, 5738. [Crossref]
» Crossref -
32 Wolf, S.; Schmidt, S.; Müller-Hannemann, M.; Neumann, S.; BMC Bioinf. 2010, 11, 148. [Crossref]
» Crossref -
33 de la Fuente, A. G.; Godzien, J.; Fernández López, M.; Rupérez, F. J.; Barbas, C.; Otero, A.; J. Pharm. Biomed. Anal. 2018, 154, 138. [Crossref]
» Crossref -
34 Dunn, W. B.; Erban, A.; Weber, R. J. M.; Creek, D. J.; Brown, M.; Breitling, R.; Hankemeier, T.; Goodacre, R.; Neumann, S.; Kopka, J.; Viant, M. R.; Metabolomics 2013, 9, 44. [Crossref]
» Crossref -
35 Blaženović, I.; Kind, T.; Ji, J.; Fiehn, O.; Metabolites 2018, 8, 31. [Crossref]
» Crossref -
36 Westgard, J. O.; Barry, P. L.; Hunt, M. R.; Groth, T.; Clin. Chem. 1981, 27, 493. [Crossref]
» Crossref -
37 González-Domínguez, Á.; Estanyol-Torres, N.; Brunius, C.; Landberg, R.; González-Domínguez, R.; Anal. Chem. 2024, 96, 1064. [Crossref]
» Crossref -
38 Gika, H. G.; Zisi, C.; Theodoridis, G.; Wilson, I. D.; J. Chromatogr. B 2016, 1008, 15. [Crossref]
» Crossref -
39 Neves, M. R. C.; de Deus, J. A. S.; Rev. Cerrados 2022, 20, 164. [Crossref]
» Crossref -
40 Pereira, C. C.; Fernandes, G. W.; Nat. Conserv. 2022, 49, 131. [Crossref]
» Crossref -
41 Gianotti, A. R. D. C.; Souza, M. J. H. D.; Machado, E. L. M.; Pereira, I. M.; Vieira, A. D.; Magalhães, M. R.; Rev. Bras. Meteorol. 2013, 28, 246. [Crossref]
» Crossref -
42 Flora e Funga do Brasil; Baccharis [Link] accessed in January 2026
» Link -
43 Ministério da Agricultura, Pecuária e Abastecimento (MAPA); Instrução Normativa No. 3, de 19 de janeiro de 2001 [Link] accessed in January 2026
» Link - 44 Skoog, D. A.; Holler, F. J.; Crouch, S. R.; Principles of Instrumental Analysis, 7th ed.; Cengage Learning: Boston, USA, 2017.
-
45 Instituto Mineiro de Agropecuária (IMA); Portaria No. 1603, de 18 de abril de 2016, Institui a Delimitação de Área Geográfica Região da Própolis Verde de Minas Gerais [Link] accessed in March 2026
» Link -
46 Pires, L. M.; Santos, M. F. C.; Figueiredo, L. R.; Faleiros, R.; Badoco, F. R.; Silva, K. B.; Ambrósio, S. R.; Bastos, J. K.; Santos, R. A.; Veneziani, R. C. S.; Chem. Biodiversity 2024, 21, e202401288. [Crossref]
» Crossref -
47 dos Santos, C. C.; da Silva, A. F.; Castro, R. N.; Leitão, G. G.; J. Chromatogr. A 2025, 1752, 465977. [Crossref]
» Crossref -
48 Zhang, C.; Shen, X.; Chen, J.; Jiang, X.; Wang, K.; Hu, F.; Nat. Prod. Res. 2017, 31, 2441. [Crossref]
» Crossref -
49 Xu, X.; Yang, B.; Wang, D.; Zhu, Y.; Miao, X.; Yang, W.; Molecules 2020, 25, 4612. [Crossref]
» Crossref -
50 de Freitas, M. C.; Miranda, M. B.; Oliveira, D. T.; Vieira-Filho, S. A.; Caligiorne, R. B.; de Figueiredo, S. M.; Recent Pat. Endocr., Metab. Immune Drug Discovery 2017, 11, 3. [Crossref]
» Crossref -
51 Boeing, T.; Moresco, R.; Souza, P. D.; Plants 2025, 14, 2961. [Crossref]
» Crossref -
52 Piccinelli, A. L.; Lotti, C.; Campone, L.; Cuesta-Rubio, O.; Campo Fernandez, M.; Rastrelli, L.; J. Agric. Food Chem 2011, 59, 6484. [Crossref]
» Crossref -
53 Zhang, L.; Song, S.; Chen, B.; Li, R.; Wang, L.; Wang, C.; Han, L.; Fu, Z.; Zhang, Z.; Wang, Q.; Yu, H.; Heliyon 2023, 9, e16117. [Crossref]
» Crossref -
54 Zhao, X.; Zhang, S.; Liu, D.; Yang, M.; Wei, J.; Molecules 2020, 25, 389. [Crossref]
» Crossref -
55 Papakosta, F.; Graikou, K.; Panou, E.; Hatjina, F.; Charistos, L.; Brusbardis, V.; Van Der Steen, J. J. M.; Chinou, I.; Molecules 2025, 30, 4533. [Crossref]
» Crossref -
56 Kurek-Górecka, A.; Rzepecka-Stojko, A.; Górecki, M.; Stojko, J.; Sosada, M.; Świerczek-Zięba, G.; Molecules 2013, 19, 78. [Crossref]
» Crossref -
57 Melliou, E.; Stratis, E.; Chinou, I.; Food Chem. 2007, 103, 375. [Crossref]
» Crossref -
58 Zhang, C.; Tian, Y.; Yang, A.; Tan, W.; Liu, X.; Yang, W.; Int. J. Mol. Sci. 2023, 24, 16753. [Crossref]
» Crossref -
59 Wishart, D. S.; Guo, A.; Oler, E.; Wang, F.; Anjum, A.; Peters, H.; Dizon, R.; Sayeeda, Z.; Tian, S.; Lee, B. L.; Berjanskii, M.; Mah, R.; Yamamoto, M.; Jovel, J.; Torres-Calzada, C.; Hiebert Giesbrecht, M.; Lui, V. W.; Varshavi, D.; Allen, D.; Arndt, D.; Khetarpal, N.; Sivakumaran, A.; Harford, K.; Sanford, S.; Yee, K.; Cao, X.; Budinski, Z.; Liigand, J.; Zhang, L.; Zheng, J.; Mandal, R.; Karu, N.; Dambrova, M.; Schiöth, H. B.; Greiner, R.; Gautam, V.; Nucleic Acids Res. 2022, 50, D622. [Crossref]
» Crossref -
60 Kanehisa, M.; Goto, S.; Nucleic Acids Res. 2000, 28, 27. [Crossref]
» Crossref -
61 Kim, S.; Chen, J.; Cheng, T.; Gindulyte, A.; He, J.; He, S.; Li, Q.; Shoemaker, B. A.; Thiessen, P. A.; Yu, B.; Zaslavsky, L.; Zhang, J.; Bolton, E. E.; Nucleic Acids Res. 2025, 53, D1516. [Crossref]
» Crossref -
62 Gil-de-la-Fuente, A.; Godzien, J.; Saugar, S.; Garcia-Carmona, R.; Badran, H.; Wishart, D. S.; Barbas, C.; Otero, A.; J. Proteome Res. 2019, 18, 797. [Crossref]
» Crossref -
63 Ruttkies, C.; Schymanski, E. L.; Wolf, S.; Hollender, J.; Neumann, S.; J. Cheminf. 2016, 8, 3. [Crossref]
» Crossref -
64 Jiang, C.; Gates, P. J.; Molecules 2024, 29, 5246. [Crossref]
» Crossref -
65 Kachlicki, P.; Piasecka, A.; Stobiecki, M.; Marczak, Ł.; Molecules 2016, 21, 1494. [Crossref]
» Crossref -
66 Saftić Martinović, L.; Barbarić, A.; Gobin, I.; Appl. Sci. 2025, 15, 12529. [Crossref]
» Crossref -
67 Liigand, P.; Kaupmees, K.; Haav, K.; Liigand, J.; Leito, I.; Girod, M.; Antoine, R.; Kruve, A.; Anal. Chem. 2017, 89, 5665. [Crossref]
» Crossref -
68 Avula, B.; Sagi, S.; Masoodi, M. H.; Bae, J.-Y.; Wali, A. F.; Khan, I. A.; J. AOAC Int. 2020, 103, 1378. [Crossref]
» Crossref -
69 Medana, C.; Carbone, F.; Aigotti, R.; Appendino, G.; Baiocchi, C.; Phytochem. Anal. 2008, 19, 32. [Crossref]
» Crossref -
70 Gumisiriza, H.; Olet, E. A.; Mwikali, L.; Akatuhebwa, R.; Omara, T.; Lejju, J. B.; Sesaazi, D. C.; Microbiol. Res. 2024, 15, 2085. [Crossref]
» Crossref -
71 Mabasa, X. E.; Mathomu, L. M.; Madala, N. E.; Musie, E. M.; Sigidi, M. T.; Biochem. Res. Int. 2021, 2021, 2854217. [Crossref]
» Crossref -
72 Karpagasundari, C.; Kulothungan, S. R.; J. Pharmacogn. Phytochem 2014, 3, 196. [Link] accessed in March 2026
» Link -
73 Sisa, M.; Bonnet, S. L.; Ferreira, D.; van der Westhuizen, J. H.; Molecules 2010, 15, 5196. [Crossref]
» Crossref -
74 Cuyckens, F.; Claeys, M.; J. Mass Spectrom. 2004, 39, 1. [Crossref]
» Crossref -
75 Wolfender, J.-L.; Nuzillard, J.-M.; van der Hooft, J. J. J.; Renault, J.-H.; Bertrand, S.; Anal. Chem. 2019, 91, 704. [Crossref]
» Crossref -
76 Ji, S.; Li, R.; Wang, Q.; Miao, W.; Li, Z.; Si, L.; Qiao, X.; Yu, S.; Zhou, D.; Ye, M.; J. Ethnopharmacol. 2015, 176, 475. [Crossref]
» Crossref -
77 Alves, D. S.; Antar, G. M.; Scutellaria in Flora e Funga do Brasil [Link] accessed in January 2026
» Link -
78 Guimarães, E. F.; Medeiros, E. V. S. S.; Queiroz, G. A.; Piper in Flora e Funga do Brasil [Link] accessed in January 2026
» Link -
79 Prado, J.; Hirai, R. Y.; Pityrogramma in Flora e Funga do Brasil [Link] accessed in January 2026
» Link -
80 Orjala, J.; Wright, A. D.; Behrends, H.; Folkers, G.; Sticher, O.; Rüegger, H.; Rali, T.; J. Nat. Prod. 1994, 57, 18. [Crossref]
» Crossref -
81 Hitz, C.; Mann, K.; Wollenweber, E.; Z. Naturforsch., C 1982, 37, 337. [Crossref]
» Crossref -
82 Li, L.; Xu, X.; Lv, K.; Zheng, G.; Wang, H.; Chen, S.; Huang, L.; Liu, Y.; Zhang, Y.; Tang, Z.; Zhang, L.; Wang, J.; Qiao, J.; Li, H.; Wang, X.; Yao, G.; Fang, C.; Br. J. Pharmacol. 2023, 180, 287. [Crossref]
» Crossref -
83 Righi, A. A.; Negri, G.; Salatino, A.; Evid. Based Complement. Alternat. Med. 2013, 2013, 267878. [Crossref]
» Crossref -
84 Alam, M. A.; Subhan, N.; Hossain, H.; Hossain, M.; Reza, H. M.; Rahman, M. M.; Ullah, M. O.; Nutr. Metab. 2016, 13, 27. [Crossref]
» Crossref -
85 Martins, S. B.; Teixeira, S. C.; de Souza, G.; Alhatlani, B. Y.; Abdallah, E. M.; Ambrosio, S. R.; Silva, T. S.; Bastos, J. K.; Tanimoto, M. H.; Barbosa, B. F.; Ferro, E. A. V.; Martins, C. H. G.; Front. Pharmacol. 2025, 16, 1630134. [Crossref]
» Crossref -
86 Sajeev, A.; Aswani, B. S.; Alqahtani, M. S.; Abbas, M.; Sethi, G.; Kunnumakkara, A. B.; Cancers 2025, 17, 2328. [Crossref]
» Crossref -
87 Maeda, H. A.; Front. Plant Sci. 2019, 10, 881. [Crossref]
» Crossref -
88 Erol, Ö.; Irmisch, S. In Natural Product Isolation and Identification, vol. 2895; Choi, Y. H.; Erol, Ö.; Irmisch, S., eds.; Humana: New York, USA, 2025, 111. [Crossref]
» Crossref -
89 Ribeiro, V. P.; Mejia, J. A. A.; Rodrigues, D. M.; Alves, G. R.; Pinheiro, A. M. F.; Tanimoto, M. H.; Bastos, J. K.; Ambrósio, S. R.; Rev. Bras. Farmacogn 2023, 33, 288. [Crossref]
» Crossref -
90 Salatino, A.; Salatino, M. L. F.; Negri, G.; Apidologie 2021, 52, 1075. [Crossref]
» Crossref -
91 Ishida, V. F. C.; Negri, G.; Salatino, A.; Bandeira, M. F. C. L.; Food Chem. 2011, 125, 966. [Crossref]
» Crossref
Edited by
-
Editor handled this article:
Hector Henrique F. Koolen (Associate)