Abstract
In this study, one particular application of in situ pulse anodic stripping voltammetry and polytetrafluoroethylene membrane-based liquid three-phase micro extraction is presented for the micro extraction and quantification of cadmium(II) ions in trace levels. The main factors influencing on preconcentration and micro extraction of cadmium ions such as organic solvent, aqueous feed solution pH and acceptor phases, complexing agent concentration, time of extraction and stirring were examined and discussed in details. The design voltammetric cell was made of three microelectrodes inserted into an extraction cell, containing acceptor solution and then the voltammetric analysis was performed in situ during the extraction time. The enrichment factor and the relative standard deviation, under the optimized conditions, were 15 and 1.7% (n = 5), respectively. The obtained calibration curve was in the range of 1.0-250 nmol L-1 CdIIwith a regression coefficient of 0.9980. The limit of detection was found 0.1 nmol L–1. Due to the high total effective area of the gold nanoparticles and the low analyte concentration, the anodic stripping voltammetric method relies exclusively on the underpotential deposition and stripping process of CdIIon gold, with little hydrogen evolution during deposition at -0.40 V and no gassing at the stripping peak near 0.0 V vs. Ag/AgCl. The good selectivity for the underpotential deposition/ stripping method is one of advantages of the proposed method. The efficiency of the method for determination of cadmium(II) for real samples was checked using fish and rice samples.
Keywords:
polytetrafluoroethylene membrane; liquid three-phase micro extraction; differential pulse anodic stripping voltammetry; cadmium(II) ions
Introduction
Cadmium(II) is known as a toxic metal ion, due to the site and type of exposure. It causes different damages and defects in lungs, kidneys and bones.11 Jarrett, J. M.; Xiao, G.; Caldwell, K. L.; Henahan, D.; Shakirova, G.; Jones, R. L.; J. Anal. At. Spectrom. 2008, 23, 962. Cadmium, with its high half-life time from 10 to 33 years, can accumulate in liver and kidneys. The impermanent permissible intake of cadmium, based on the recommendation of world health organization, should not exceed 0.4 to 0.5 mg per week or 0.057 to 0.071 mg per day.22 Nordberg, G. F.; Fowler, B. A.; Nordberg, M.; Friberg, L.; Handbook on the Toxicology of Metals, 3th ed.; Academic Press: New York, 2007. The mechanisms toxicity of CdII can be explained as tissue injury by producing oxidative stress, epigenetically changes in DNA expression and inhalation or up regulation transport pathways, especially in the proximal of the kidney tubule.33 Verougstraete, V.; Lison, D.; Hotz, P.; J. Toxicol. Environ. Health, Part B 2003, 6, 227. Therefore, determination of cadmium ions at trace levels is very important. Different methods of chemical analysis such as potentiometric method,44 Munoz, E.; Palmero, S.; Garcya-Garcya, M. A.; Talanta 2002, 57, 985.atomic absorption spectrometry,55 Ajtony, Z.; Bencs, L.; Haraszi, R.; Szigeti, J.; Szoboszlai, N.; Talanta 2007, 71, 683.
6 Tewari, P. K.; Singh, A. K.; Talanta 2001, 53, 823.-77 Ensafi, A. A.; Ghaderi, A. R.; J. Hazard. Mater. 2007, 148, 319. inductively coupled plasma,88 Mikula, B.; Puzio, B.; Talanta 2007, 71, 136.,99 Costa, A. C. S.; Lopes, L.; Korn, M. G. A.; Portela, J. G.; J. Braz. Chem. Soc. 2002, 13, 674. ion chromatography,1010 Tanikkul, S.; Jakmunee, J.; Lapanantnoppakhun, S.; Rayanakorn, M.; Sooksamiti, P.; Synovec, R. E.; Christian, G. D.; Grudpan, K.; Talanta 2004, 64, 1241. spectrophotometry,1111 Raimundo, I. M.; Narayanaswamy, R.; Sens. Actuators, B 2003, 90, 189.
12 Castillo, E.; Cortina, J. L.; Beltran, J. L.; Prat, M. D.; Granados, M.; Analyst 2001, 126, 1149.-1313 Sanchez-Pedreno, C.; Garcya, M. S.; Ortuno, J. A.; Albero, M. I.; Exposito, R.; Talanta 2002, 56, 481. voltammetry,1414 Silva, C. L.; Masini, J. C.; Fresenius' J. Anal. Chem. 2000, 367, 284.
15 Van Staden, J. F.; Matoetoe, M. C.; Anal. Chim. Acta 2000, 411, 201.
16 Bonfil, Y.; Brand, M.; Kirowa-Eisner, E.; Anal. Chim. Acta 2002, 464, 99.
17 Hocevar, S. B.; Svancara, I.; Vytras, K.; Ogorevc, B.; Electrochim. Acta 2005, 51, 706.
18 Caoa, L.; Jia, J.; Wang, Z.; Electrochim. Acta 2008, 53, 2177.-1919 Alhemiary, N. A. F.; Al-Duais, M. A. H.; Mutair, A. A.; Wassel, A. A.; Alshrabi, B. M.; Albadany, B. A.; J. Iran. Chem. Res. 2011, 4, 9. liquid-liquid extraction (LLE),2020 Jha, M. K.; Kumar, V.; Jeong, J.; Lee, J.; Hydrometallurgy 2012, 111, 1. electrochemiluminescence2121 Whitchurch, C.; Andrews, A.; Analyst 2000, 125, 2065. and molecular fluorescence spectroscopy2222 Garcya-Reyes, J. F.; Ortega-Barrales, P.; Molina-Dyaz, A.; Microchem. J. 2006, 82, 94. have been reported for quantifying CdII. One of the most sensitive methods in trace level determinations of metal ions is anodic stripping voltammetry.2323 Ensafi, A. A.; Hajian, R.; Food Chem. 2009, 115, 1034.,2424 Rezaei, B.; Damiri, S.; J. Hazard. Mater. 2010, 183, 138.
In voltammetric analysis, it is known that the shape and the type of electrodes play a significant role in the obtained results. Many limitations such as sluggish electron transfer, low selectivity, high overpotential, lack of reproducibility and electrode fouling can be listed during the use of bare electrodes.2525 Ensafi, A. A.; Rezaei, B.; Amini, M.; Heydari-Bafrooei, E.; Talanta 2012, 88, 244.
26 Ensafi, A. A.; Heydari-Bafrooei, E.; Amini, M.; Biosens. Bioelectron. 2012, 1, 376.-2727 Rezaei, B.; Mirahmadi, S. Z.; Ensafi, A. A.; J. Braz. Chem. Soc. 2011, 22, 897. In order to overcome these problems, the use of sample preparation and electrode surface modification by suitable compounds has been considered. Various methods and substances have been used to modify the applications of electrodes.2828 Gooding, J. J.; Electrochim. Acta 2005, 50, 3049.,2929 Dai, X.; Wildgoose, G. G.; Salter, C.; Crossley, A.; Compton, R. G.; Anal. Chem. 2006, 78, 6102. Using sol-gel decorated Au nanoparticles and modifying a bare electrode can be regarded as a noteworthy method in which a high sensitivity is obtainable.3030 Avnir, D.; Acc. Chem. Res. 1995, 28, 328.
31 Tokumoto, M. S.; Pulcinelli, S. H.; Santilli, C. V.; Briois, V.; J. Phys. Chem. B 2003, 107, 568.
32 Kang, J.; Wistuba, D.; Schurig, V.; Electrophoresis 2002, 23, 1116.
33 Zusman, R.; Rottman, C.; Ottolenghi, M.; Avnir, D.; J. Non- Cryst. Solids 1990, 122, 107.
34 Levy, D.; Chem. Mater. 1997, 9, 2666.-3535 Oviatt Jr., H. W.; Shea, K. J.; Kalluri, S.; Shi, Y.; Steier, W. H.; Dalton, L. R.; Chem. Mater. 1995, 7, 493. As a point of view, gold nanoparticles with high surface area and interesting physiochemical properties are one of the good sorbents.3636 Wang, J.; Pumera, M.; Talanta 2006, 69, 984.,3737 OShea, T. J.; Lute, S. M.; Anal. Chem. 1993, 65, 247.
Liquid three-phase micro extraction (LPME) as a technique for preconcentration and clean up has been used during these years.3838 Ensafi, A. A.; Allafchian, A. R.; Saraji, M.; Mirahmadi Zare, S. Z.; Anal. Methods 2011, 3, 463.
39 Saraji, M.; Farajmand, B.; Ensafi, A. A.; Allafchian, A. R.; Mirahmdi Zare, S. Z.; Talanta 2010, 82, 1588.-4040 Saraji, M.; Bidgoli, A. A. H.; Farajmand, B.; J. Sep. Sci. 2011, 34, 1708. As some advantages of the LPME, we can refer to ease of operation, low solvent consumption, low cost and high preconcentration factor.4141 Saraji, M.; Bidgoli, A. A. H.; Anal. Bioanal. Chem. 2010, 397, 3107.,4242 Hyotylainen, T.; Riekkola, M. L.; Anal. Chim. Acta 2008, 614, 27. In this method, analytes are extracted from the donor solution (aqueous solution) through a thin layer of organic solvent, immobilized within the pores of the porous membrane, and then back-extracted into an acceptor solution inside the designed extraction cell. Pores in the walls of the membrane show some selective properties by preventing the extraction of macromolecules such as proteins and some particles from matrix of a sample. To reach the optimum conditions, organic solvent selection and extraction conditions have critical role.4343 Eshaghi, Z.; Khalili, M.; Khazaeifar, A.; Rounaghi, G. H.; Electrochim. Acta 2011, 56, 3139.
Polytetrafluoroethylene (PTFE) membrane has been formed and examined with different fabrics and papers with pore sizes of 0.2-0.4 µm.4444 Feng, C. S.; Wang, R.; Shi, B.; Li, G.; Wu, Y.; J. Membr. Sci. 2006, 277, 55.,4545 Goessi, M.; Tervoort, T.; Smith, P.; J. Mater. Sci. 2007, 42, 7983. In addition to acidic and basic solutions, these polymers are actually inert and hydrophobic. So, the 3D construction of the membrane is not affected by the two phases and the partitioning constant of the organic solvent with the membrane pores should be the same as that for the solvent.4646 Woolfenden, E.; J. Chromatogr. A 2010, 1217, 2685.
The purpose of this study was to combine differential pulse anodic stripping voltammetry (DPASV) combined with LPME and a PTFE membrane, using a modified electrode. The main idea of this combination is to boost the selectivity and sensitivity of cadmium ions determination in different complex media such as food and wastewater samples. In this study, gold nanoparticles-sol-gel modified platinum wire was used as a working electrode. 1-(2-pyridylazo)-2-naphthol (PAN), as a typical ligand, was used as a complexing agent. The method is highly selective and sensitive.
Experimental
Reagents
Milli-Q water (resistance > 18 MΩ cm) was used in the experiments. PTFE membrane with average pore size of 0.22 µm and thickness of 0.1 mm was obtained from Iran Membrane and Trading Group (Golestan, Iran). Sodium hydroxide, sodium chloride, hydrochloric acid (37%, m/m), PAN, octanol, 2-decane, isoamine benzoate, undecane, propyl benzoate and dibenzyl ether were purchased from Merck (Darmstadt, Germany). 3-trimethoxysilyl-1-propanethiol (MPTS, 95%) was purchased from Aldrich (St. Louis, USA). Other reagents were of analytical grade and were purchased from Merck (Darmstadt, Germany).
To prepare a stock solution of CdII (1.0 mmol L–1), a proper amount of cadmium salt (as a nitrate salt) was dissolved in water in the presence of 1 mL 0.1 mol L–1 HNO3. More dilute solutions were prepared daily using the CdII stock solution.
Apparatus
All electrochemical measurements were achieved using a computer-controlled potentiostat (Metrohm, Model 797 VA) and the data were analyzed with 1.2 Metrodata software.
Atomic force microscopy (AFM) (Bruker Nano instrument, Germany) was performed in contact mode using, working in normal conditions.
Attenuated total reflectance-Fourier transform infrared spectroscopy (ATR-FTIR) spectra were recorded using a Tensor 27 (Bruker, the Germany) FTIR spectrometer.
A digital pHmeter (Corning Model 140) was used to measure the pH of the solutions until a reaching steadystate.
Preparation of the microelectrodes
An Ag/AgCl reference microelectrode was constructed based on the previous works.3838 Ensafi, A. A.; Allafchian, A. R.; Saraji, M.; Mirahmadi Zare, S. Z.; Anal. Methods 2011, 3, 463. A small shift in the potential of the reference microelectrode (vs. the conventional reference electrode) was observed. Anyway, during the experiments, the electrode was stable and reproducible.
A piece of platinum wire with diameter of 0.1 mm was used as a counter electrode. As a working electrode, another piece of platinum wire with the same outer diameter, which had been decorated with gold nanoparticles was used. Gold decorating of the sol-gel was done via acidic catalyzed conditions.
As the coating solution the amount of MPTS, hydrochloric acid solution (0.1 mol L–1) and ethanol in a volume ratio of 1:1:1.5, respectively were mixed into a polypropylene flask. The mixture was stirred and heated at 50 ºC. After 15-20 min, the coating process of the platinum-wire electrode was performed by dipping 1.5 cm of a Pt-wire into the solution mixture for 15 s. After coating and washing the electrode with 5 mL of water, it was inserted into an electrochemical cell containing 2.0 mL of HAuCl4 (0.1%). The working electrode potential was adjusted at -200 mV for a period of 60 s.4747 Ensafi, A. A.; Taei, M.; Rahmani, H. R.; Khayamian, T.; Electrochim. Acta 2011, 56, 8176. The gold nanoparticles were chemically bonded to the -SH functional group of the solgel on the surface of the Pt-wire. Then, about 10 mm of the modified platinum electrode was contacted to the acceptor solution. The systematic scheme of the electrochemical analysis is illustrated in Figure 1a.
(a) Schematic of the working electrode; (b) schematic of the equipment used for PTFE membrane-LPME and in situ DPASV; (c) designed assembly for robust microextraction and in situ voltammetric procedure.
PTFE membrane precondition and extraction cell procedure
The PTFE membranes were set in acetone vial and then left so that the acetone was evaporated completely. Then, the membranes (Figure 1b) were sonicated for 30 min in ethanol to remove the contaminations and were washed with acetone again. The solvent was allowed to evaporate completely. In the next step, in order to impregnate the pores, the PTFE membranes were immersed in propyl benzoate containing PAN (as a ligand) for 120 s. Then, the wet part of the membrane was cut as a circle shape with 3 mm diameter size and was placed in the Teflon electrochemical cell (extraction cell, with 3 mm diameter). Finally, the screw was tightened.
For the extraction, 5.0 mL of the sample solution was filled into a 10 mL beaker (adjusted below the electrochemical cell) that was placed on a magnetic stirrer. Then, 200 µL of the acceptor phase (200.0 µL of 0.2 mol L–1HNO3 and 0.01 mol L–1 NaCl) was added to the extraction cell. The three microelectrodes for in situ voltammetric analysis were inserted into the extracted cell (Figure 1c). During the extraction, the sample solution was continuously stirred (700 rpm) at room temperature for 20 min. For each extraction, a piece of the membrane was employed only once.
For the measurement of cadmium, DPASV was selected as a suitable detection technique. Differential pulse voltammogram was employed in the potential range of –0.40 to +0.20 V with a scan rate of 25 mV s–1, pulse time of 0.05 s, pulse amplitude of 250 mV, deposition potential of –0.40 V and deposition time of 30 s. After 20 min, the difference in a sample signal (Is) and blank signal (Ib) was considered as a net signal (∆I). Calibration graph was recorded by plotting net peak currents vs. the analyte concentrations in the solutions.
Real samples preparation
To prepare rice sample solution, 0.500 g of the dried rice grain sample was placed into 1.0 mL of nitric acid at 5.0 mL glass vial for 24 h at 80 ºC.4848 Al-saleh, I.; Shinwari, N.; Biol. Trace Elem. Res. 2001, 83, 91. The pH of the result solution was adjusted to 7 by addition of 2 mol L–1 NaOH solution, and was transferred into a 10-mL volumetric flask and diluted to volume with water. 5.0 mL of the sample solution was used for the extraction step.
0.600 g fresh fish meat was added into 1.0 mL of concentrated nitric acid in a 5.0 mL glass vial. It was held for 3 h before heating and then it was slowly heated to 90 ºC for 3 h. Then, the sample was allowed to cool and 0.5 mL 30% hydrogen peroxide was added drop wise to the mixture. To destroy the excess of hydrogen peroxide, the sample was heated to 90 ºC for 1 h. After complete digestion, the pH of the result solution was adjusted to 7 by addition of 2 mol L–1 NaOH solution, and was transferred into a 10 mL volumetric flask and diluted to volume with water. Water samples were collected by a routine technique. After the sample was acidified by adding 1 mL of concentrated nitric acid to 1 L of water, it was stored in polyethylene bottles. Each sample was analyzed in triplicate by standard addition method.
Calculations
The enrichment factor (EF) and recovery (R) of the cadmium content were calculated using the following equations:


where CAP,final and CDP,initial are the final and initial concentrations of cadmium(II) in the acceptor and donor phases, respectively. CAP,final was obtained from the calibration curve. CDP detection and CDP initial were the measured and initial concentrations of the analyte in the donor phase, respectively.
Results and Discussion
Method development
PTFE membrane was applied for the pre-concentration and extraction of cadmium ions from aqueous samples. Cadmium ion was extracted from the donor phase into an organic solvent and finally, it was back extracted into a smaller volume of an aqueous receiving phase. To achieve maximum sensitivity, all parameters affecting the extraction efficiency were optimized using sequential single factor analysis approach and each experiment was repeated at least three times. The peak current of DPASV was used to evaluate the extraction efficiency under different conditions.
Selection of proper ligand
Dithizone and oxine are the two most important extracting agents that are widely used for metal ions complexation. Several heavy metal ions could interact with these reagents. The reaction of PAN with cadmium(II) at selected pH is relatively selective so that many commonly associated ions could not interfere, therefore this complexation reaction could be used to the solvent extraction. Thus, PAN was selected as suitable ligand for this study.
Selection of organic solvent
An essential variable for the preconcentration of analyte in PTFE membrane-LPME is the selection of the most suitable organic solvent. The importance of the suitable organic solvent selection lies in easy immobilization in the PTFE pores, nonvolatility of the solvent to prevent solvent loss during the extraction and immiscibility with water in order to serve as a barrier between the donor and the receiving aqueous solution. Six organic solvents including octanol, 2-decane, isoamine benzoate, undecane, propyl benzoate and dibenzyl ether were evaluated for the extraction of cadmium ion from a 5.0 mL of an aqueous solution containing 8.0 nmol L–1 cadmium (in phosphate buffer pH 8.0, 0.1 mol L–1). The PTFE membrane (that was impregnated with the organic solvent and PAN solution, 0.1%) was filled with the acceptor phase (0.2 mol L–1 HNO3, 0.01 mol L–1 NaCl). To complete the extraction, the donor phase was stirred for 20 min. The results are shown in Figure 2. As can be seen, propyl benzoate was the most suitable one for the subsequent experiments.
Influence of organic solvent as a liquid membrane. Conditions: CdII, 8.0 nmol L–1; pH, 8.0 (phosphate buffer 0.1 mol L–1); sample volume, 5.0 mL; PAN concentration, 0.10%; acceptor phase, 0.2 mol L–1 HNO3 and 0.01 mol L–1 NaCl; stirring rate, 700 rpm at room temperature; extraction time, 20 min (number of replications = 3).
Basicity and acidity of the donor and acceptor phases
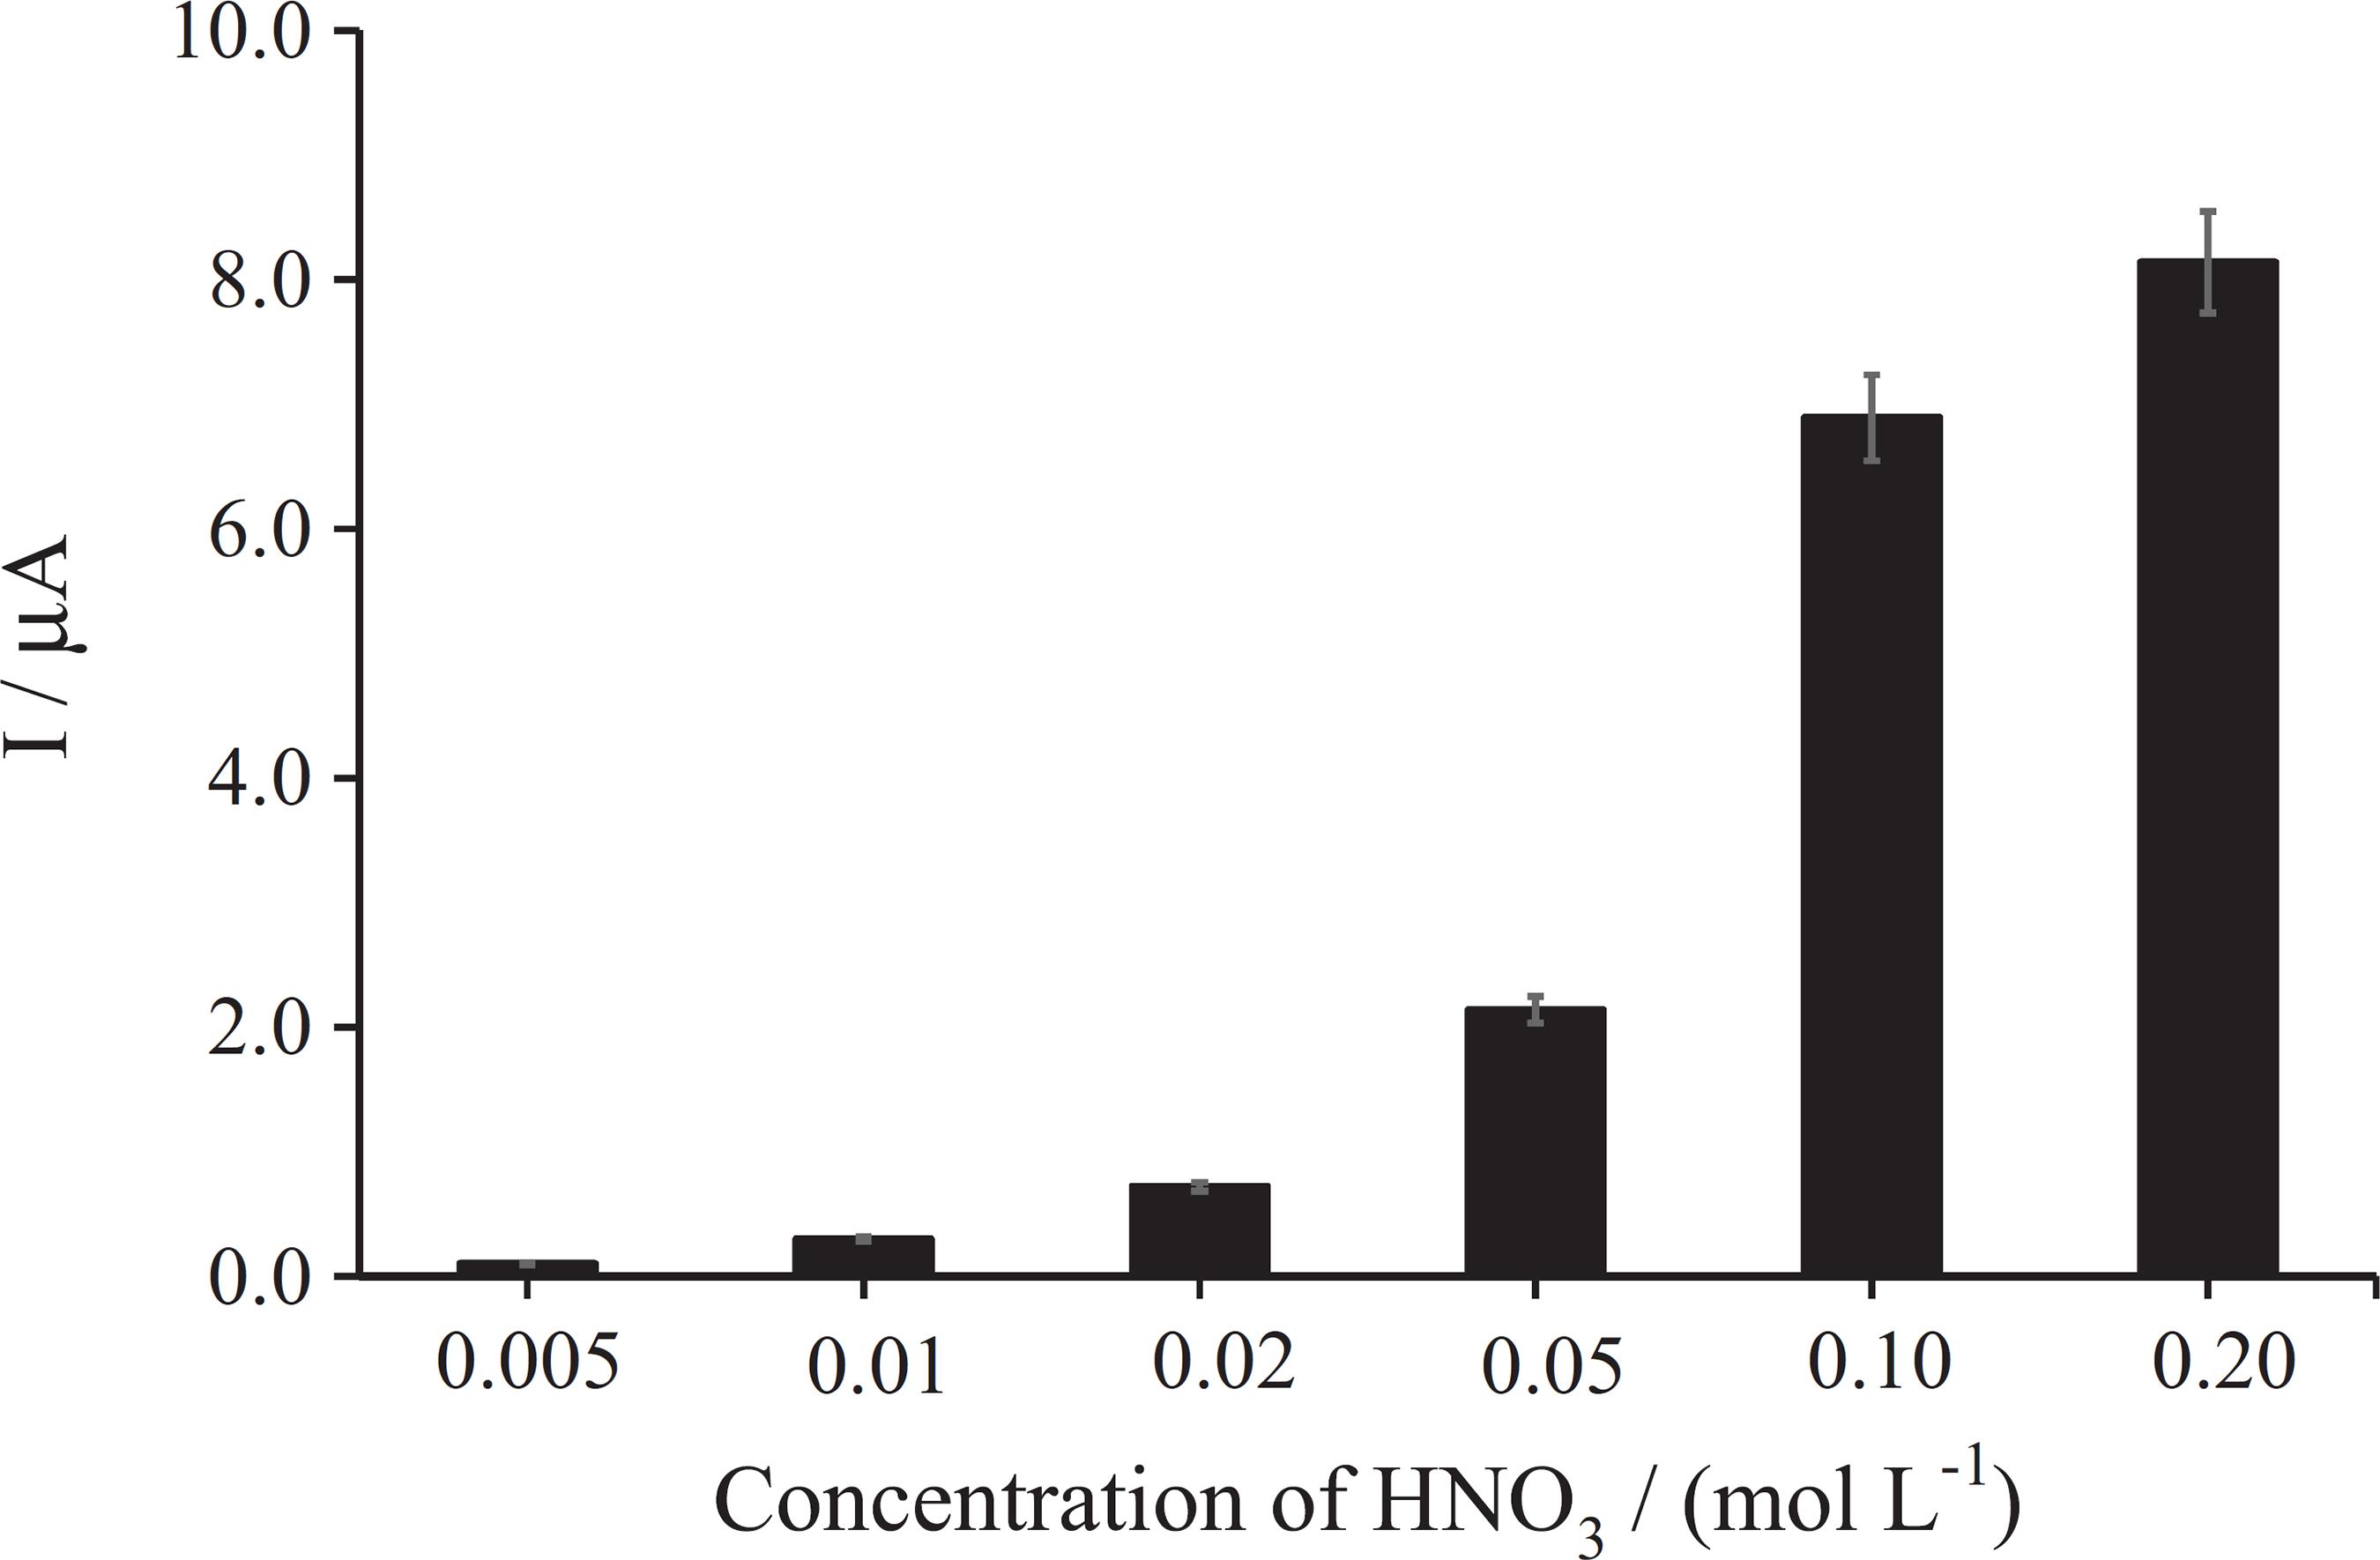
One of the most important factors effect on the extraction efficiency in LPME is the pH level of both phases. In this method, the analyte from the donor phase must be transferred into an organic phase. The pH of the donor solution and the influence of HNO3 concentration on the acceptor phase were investigated (Figure 3). HNO3 concentration WA varied between 5.0, 10.0, 20.0, 50.0, 100.0, 200.0 and 300 mmol L–1 in the acceptor phase. Based on the results, by increasing the HNO3 concentration in the acceptor phase up to 200 mmol L–1, the efficiency of the extraction was increased. So, 200 mmol L–1 HNO3 was selected as an optimum HNO3 concentration in the acceptor phase solution.
Influence of nitric acid concentration of the acceptor phase on the extraction efficiency. Conditions: organic phase, propyl benzoate; donor phase, pH 7.0 (phosphate buffer 0.10 mol L–1); PAN concentration, 0.10%; stirring speed, 700 rpm; extraction time, 20 min; CdII, 8.0 nmol L–1 (number of replications = 3).
The donor phase pH was varied between 4.0 and 9.0 (Figure 4). According to the obtained results, the best extraction efficiency appeared at pH 8.0. Decreasing on the peak current at higher pH is due to the precipitation of the cadmium ions in more basic solutions. Thus, in the next study, the pH of the sample solution was adjusted at 8.0.
Influence of donor pH value on the extraction efficiency. Conditions: organic phase, propyl benzoate; PAN concentration, 0.10%; stirring speed, 700 rpm; extraction time, 20 min; acceptor phase, 0.2 mol L–1HNO3 and 0.01 mol L–1 NaCl; CdII, 8.0 nmol L–1, (number of replications = 3).
Effect of contact area and stirring rate
By increasing the contact area, the extraction speed is increased. However, a fixed small area was used in this work. More stirring increases the mass transport of CdII from the donor to the membrane interface by convection. However, the transport of the neutral [Cd(PAN)2] complex through the organic phase supported by the membrane is anyway controlled by diffusion, since the external stirring does not reach inside the membrane (the lack of signal during the first minutes of Figure 5 serves as evidence and a thinner larger membrane would speed up the process). Some convection of the acceptor phase would be beneficial to speed-up the transport of re-extracted CdIIfrom the membrane/acceptor interface into the solution, otherwise also controlled by diffusion (some convection caused is applied only during the 30 s accumulation step on the working electrode, due to H2 bubbles formation). So, the highest speed of stirring might be the best one; nevertheless, at high speeds, due to the formation of air bubbles on the surface of the PTFE membrane the mass transfer and also extraction were frustrated. To avoid the bubbling and production of vortex flow, a 700 rpm stirring rate was selected as an optimum rate and used for the rest of the experiments.
Effect of extraction time on the extraction efficiency. Conditions: organic phase, propyl benzoate; CdII, 8.0 nmol L–1; pH, 8.0 (phosphate buffer 0.1 mol L–1); sample volume, 5.0 mL; acceptor phase, 200.0 µL of 0.2 mol L–1 HNO3 and 0.01 mol L–1 NaCl; stirring rate, 700 rpm at room temperature (number of replications = 3).
Effect of the ligand concentration
To evaluate the influence of the ligand concentration on the extraction efficiency, different concentrations of PAN at 0.05, 0.1, 0.2 and 1.0% were examined. The obtained results showed that different concentration of PAN has not significant affected the extraction efficiency.
Effect of the extraction time
An extraction is an equilibrium that needs enough time in order to allow partitioning of the analyte between the donor and the receiving phases. Mainly, to discover the effect of extraction time, some experiments under the same conditions but different relaxation times for the extraction were conducted. Anyway, in this work, based on the nature of in situ analysis, the signal (peak current) was obtained every 30 s during a run. Thus, the effect of the extraction time on the performance of the method was considered in a single run (Figure 5). The results showed that the equilibrium between both phases was reached after 1200 s. So, this time was selected for the subsequent experiments. However, for routine work, various extractions may be processed in parallel, e.g., with 4 (inexpensive) extraction cells, an extraction would be started every 5 min while the cap with the three electrodes for ASV is immersed in the one that just fulfilled 20 min of extraction.
AFM images and voltammograms of the working electrode
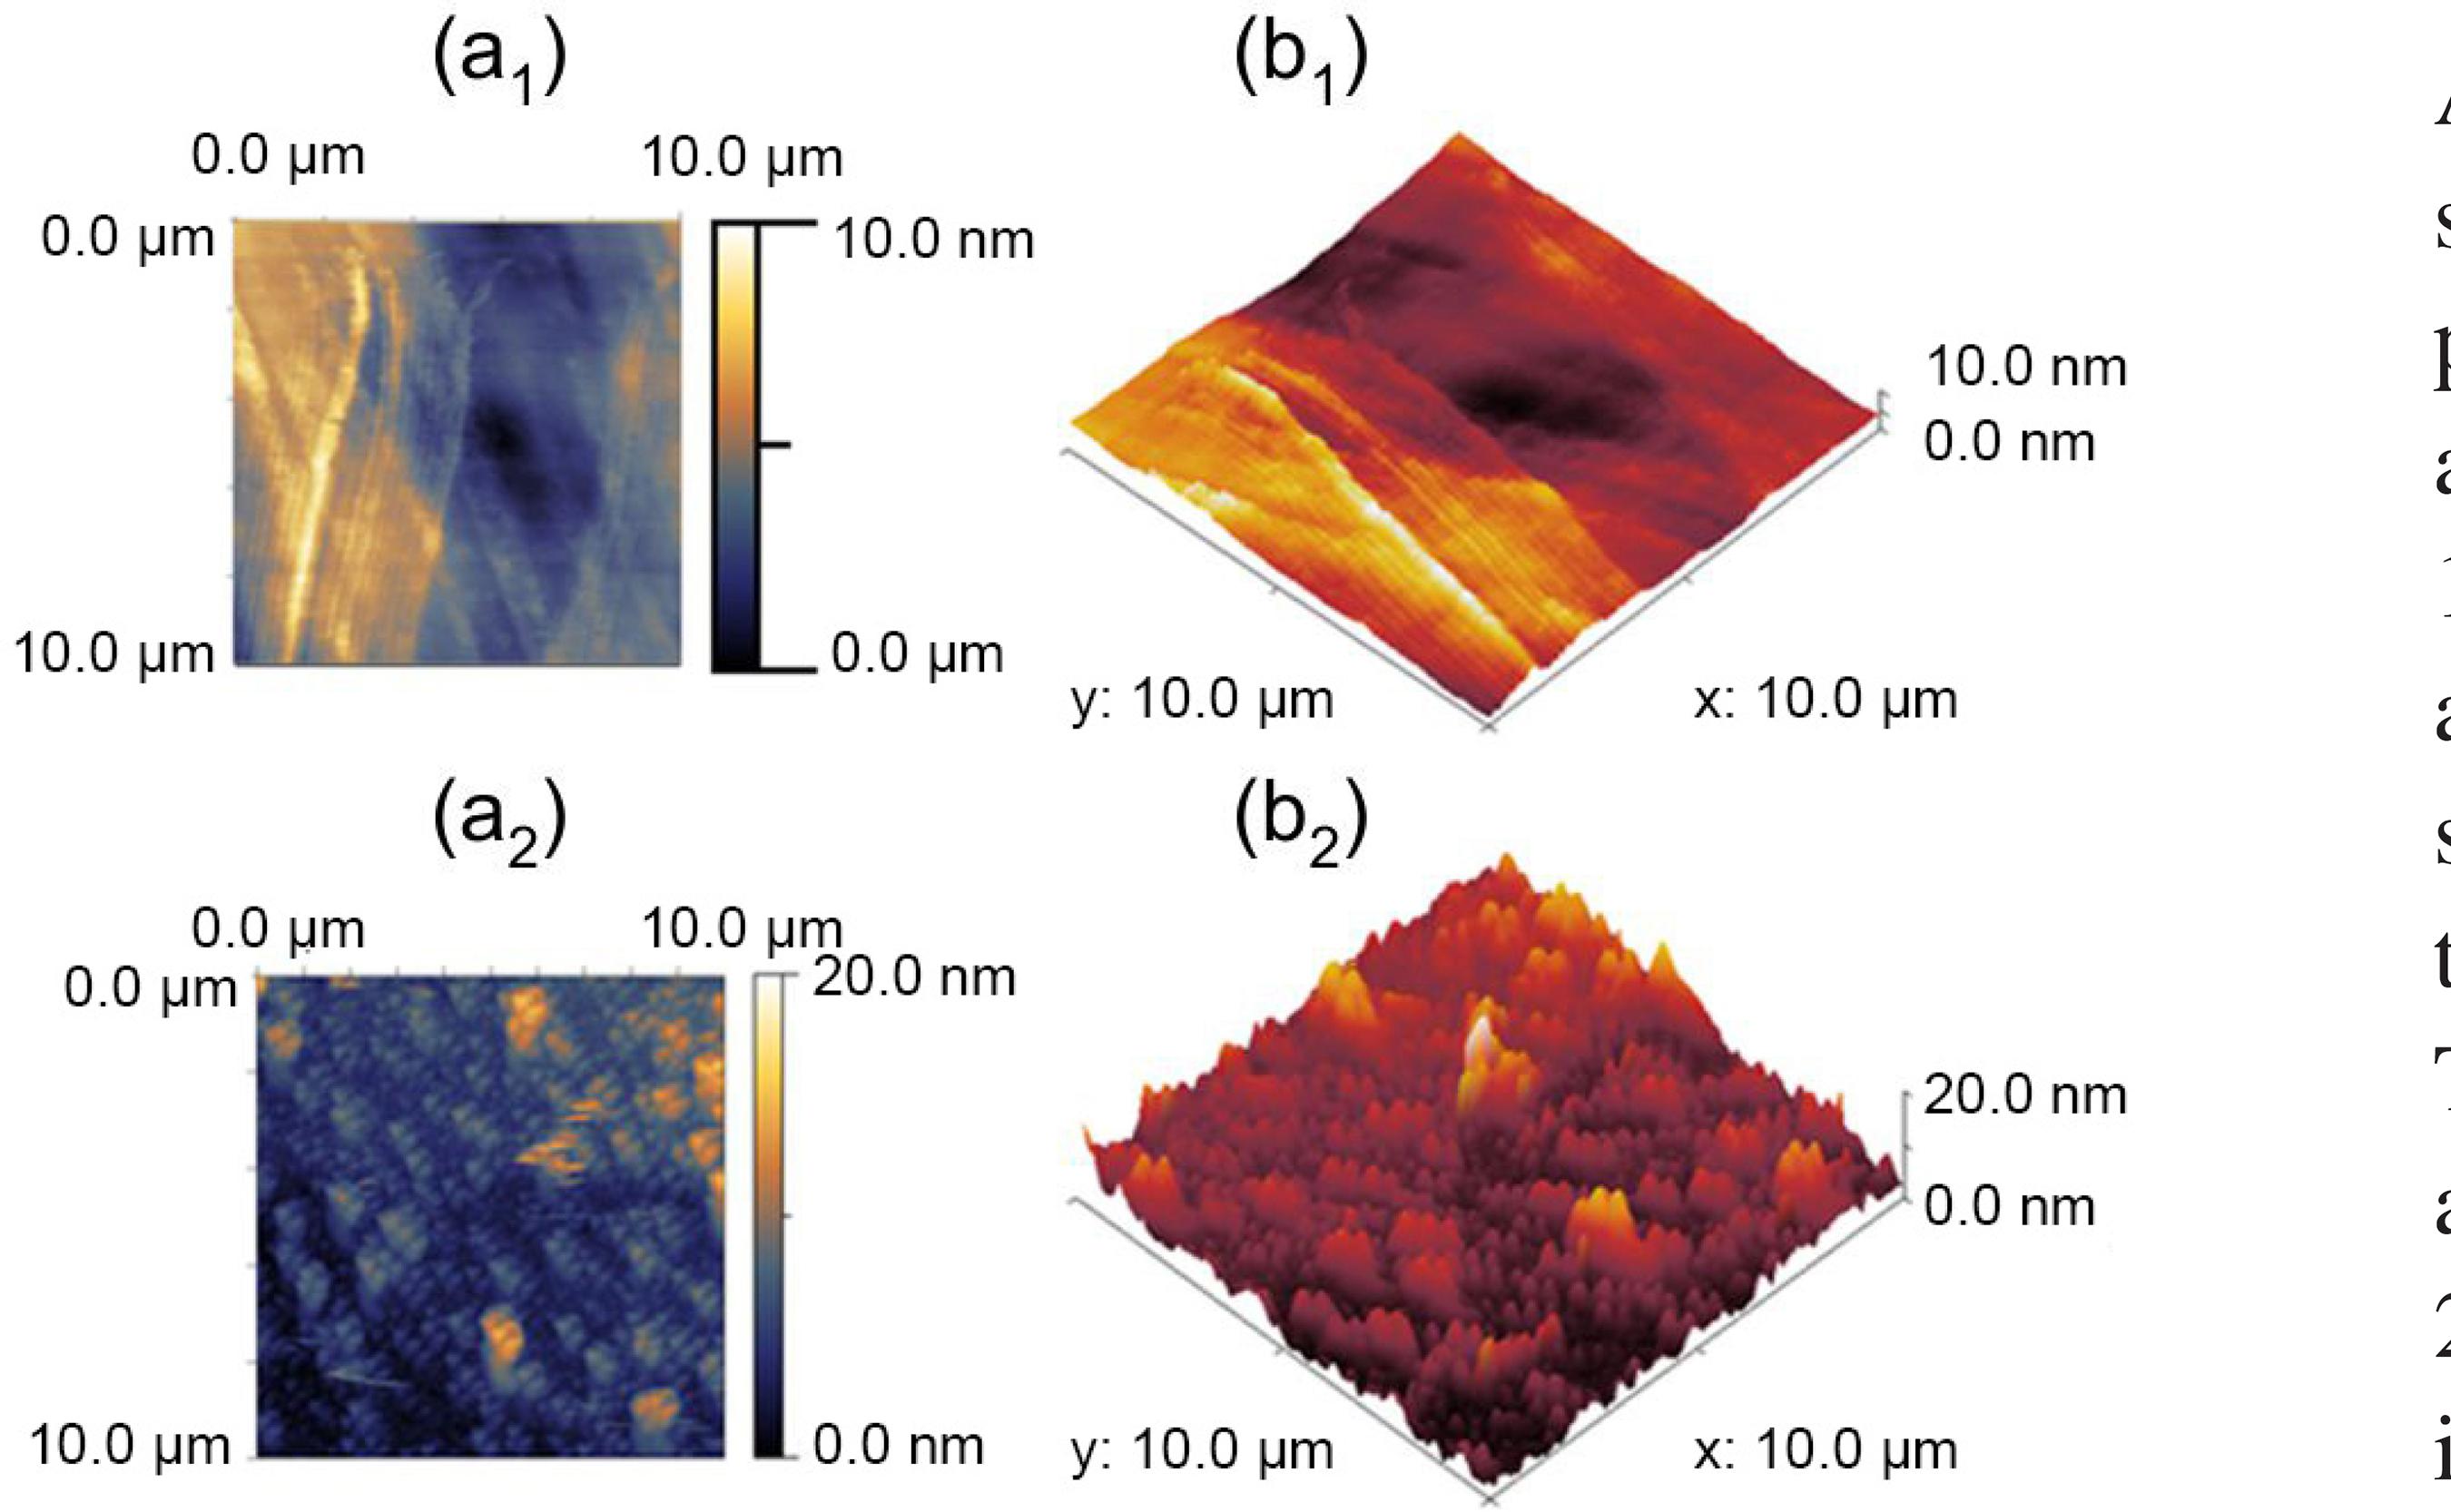
The AFM images of the working electrode surface morphology, such as thickness and roughness, are shown in Figure 6. These images demonstrated an AFM topology of the surface of the modified electrode (Figures 6a2 and 6b2), and Pt-electrode (Figures 6a1 and 6b1), which corresponded to 2D and 3D images recorded over an area of 10 × 10 µm. It can be seen that a dense layer was obtained and the height average of layer was less than 20 nm. This helped us to have a small size of the electrode with more surface area.
AFM pictures of (a1) 2D Pt-wire; (b1) 3D Pt-wire; (a2) 2D Pt/ sol-gel/nano gold; (b2) 3D Pt/sol-gel/nano gold AFM topology of the surface.
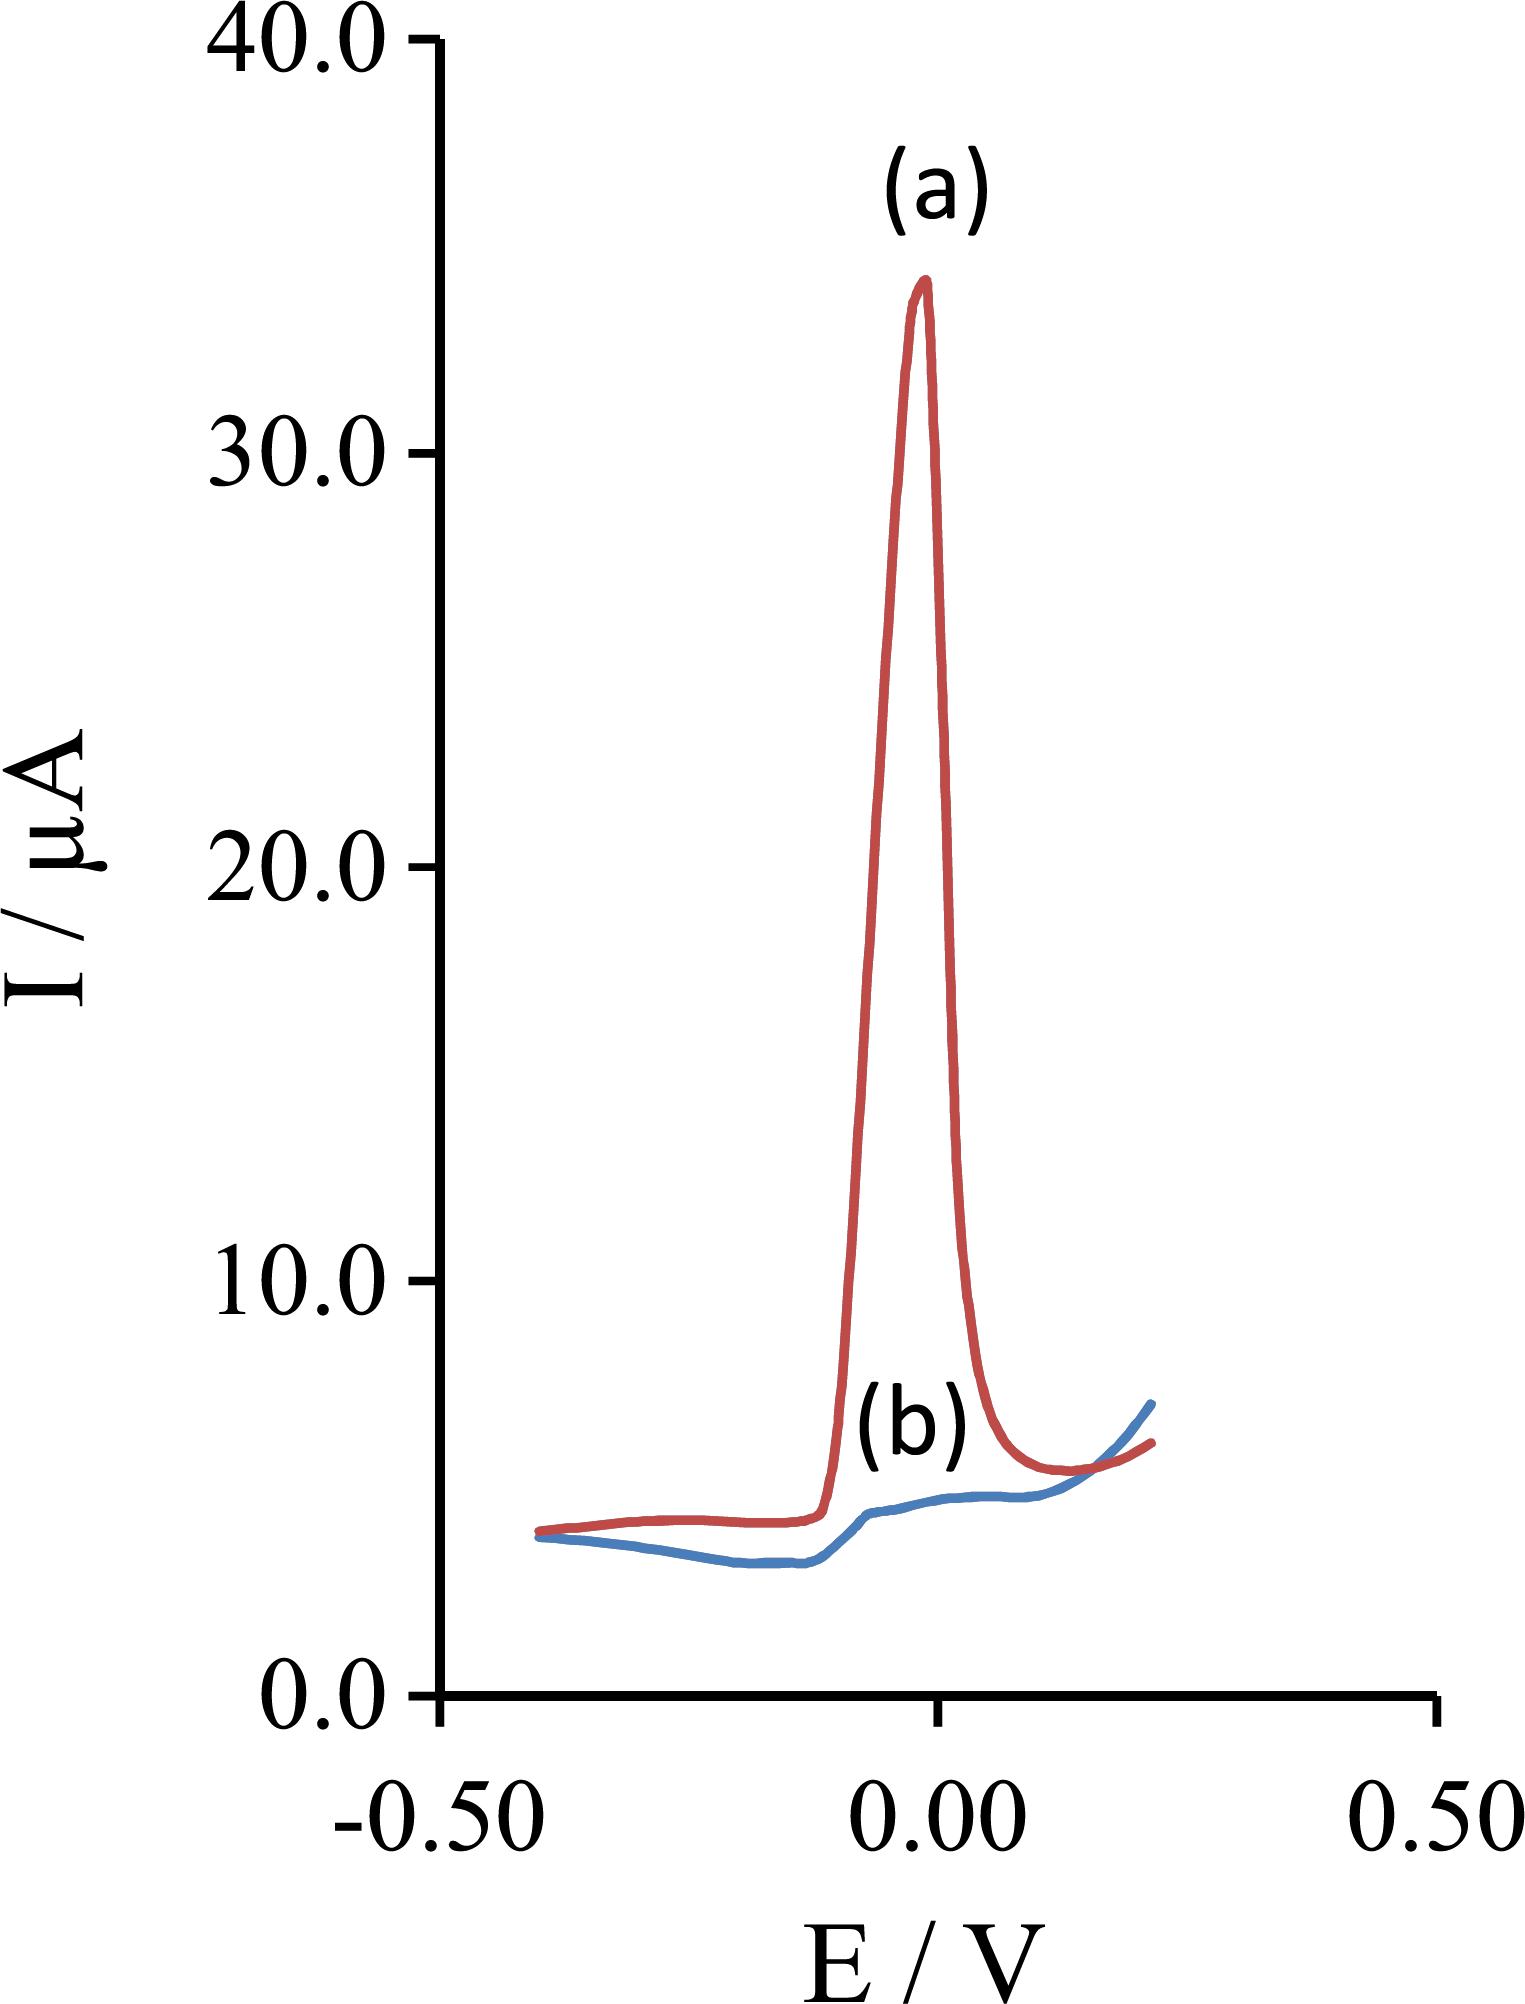
Figure 7 shows the electrochemical response of the Pt electrode modified with gold nanoparticles (Figure 7a) and unmodified Pt electrode (Figure 7b) to 30.0 nmol L–1 CdII at the optimum conditions using DPASV technique. The results showed that the current at the modified electrode is bigger than the response current at the surface of unmodified Pt electrode.
Electrochemical response of 30.0 nmol L−1 CdII at (a) Pt electrode modified with gold nanoparticles, and (b) unmodified Pt electrode at the optimum condition using differential pulse anodic stripping voltammetry.
FTIR spectra of the working electrode
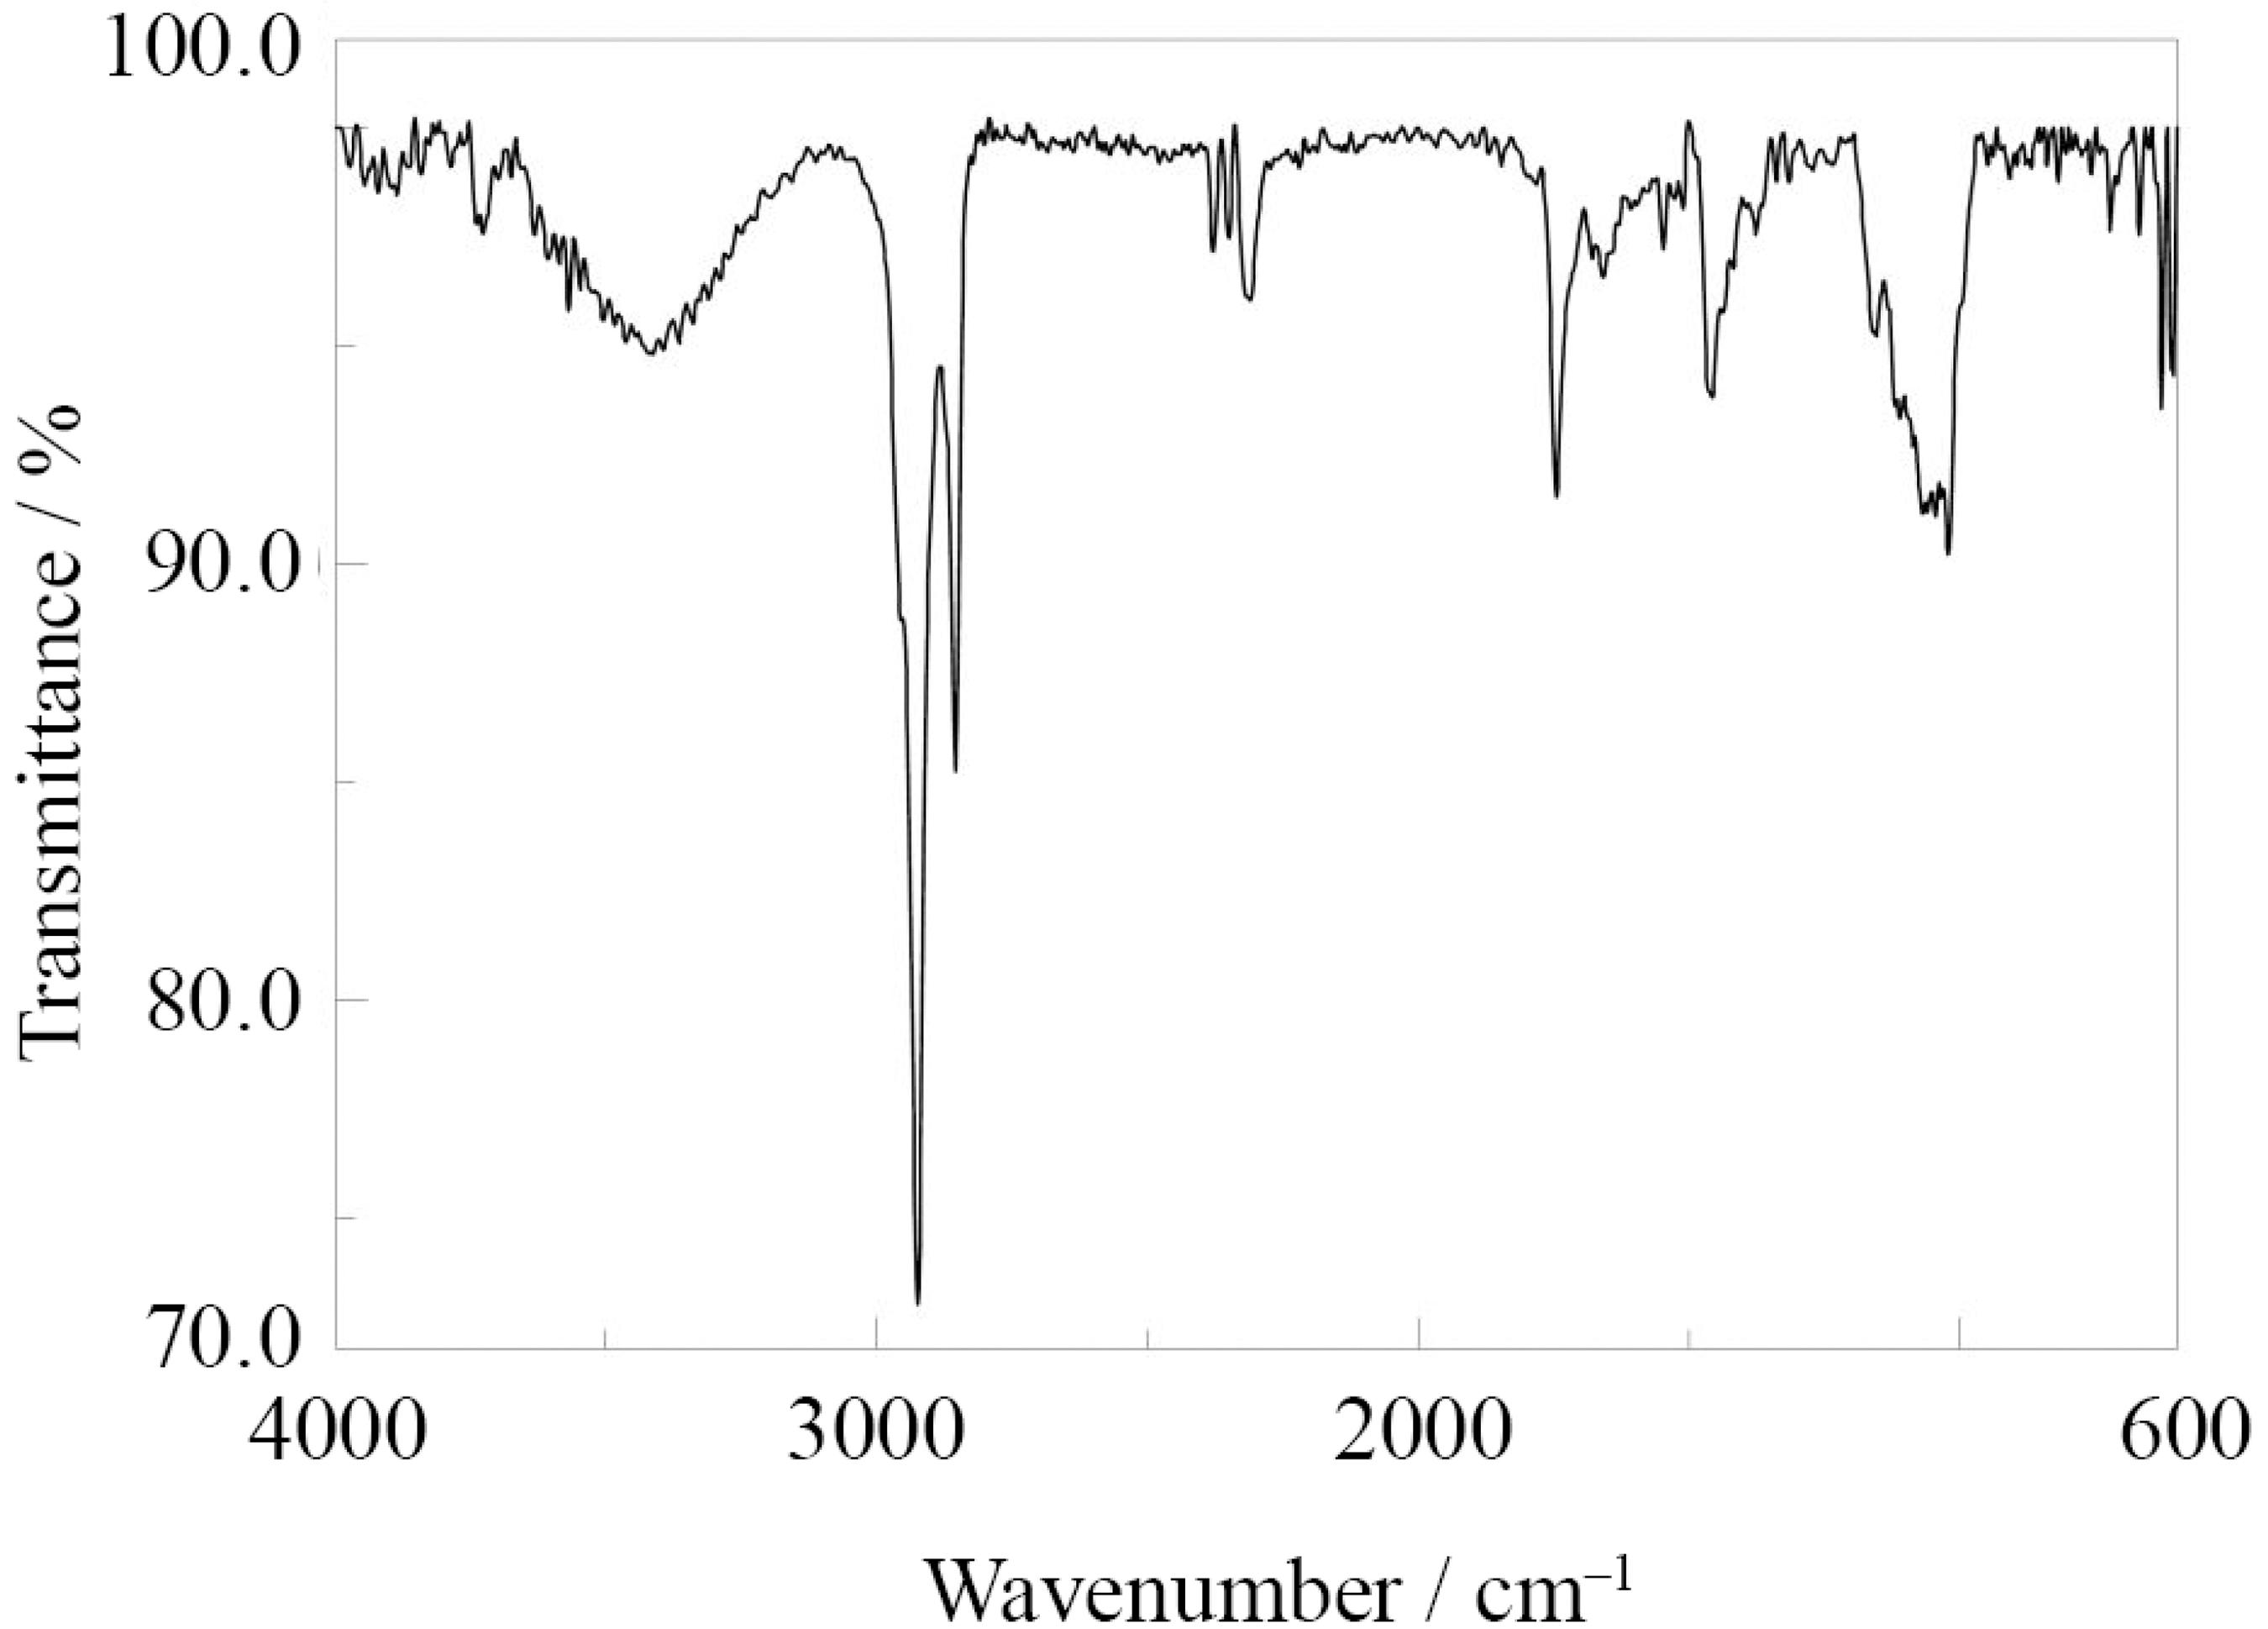
The chemical composition of the coatings materials deposited on the Pt substrate was investigated by FTIR spectroscopy. For this purpose, the modification made on a flat Pt foil and the foil was pressed directly on the ATR window. FTIR spectra of the coating on the Pt substrate are shown in Figure 8. The FTIR spectrum presented various characteristic bands around 2931 cm–1 and 1458 (CH3 stretching), 2854 cm–1(CH2 stretching), 1062 (Si–O–C bond) and 800 cm–1 (Si–C bond). The peak at 1085 cm–1 corresponded to the Si–O–Si asymmetric stretching vibration. The presence of this peak confirms the formation of a network structure inside the coating. The broad absorption band around 3340 and 3748 cm–1 are due to presence of –OH groups. In addition, a peak at 2351 cm–1 was observed assigned to a certain thiol group in ATR-FTIR spectrum.4949 Zucchi, F.; Frignani, A.; Grassi, V.; Trabanelli, G.; DalColle, M.; Corros. Sci. 2007, 49, 1570.
Analytical performance
The figures of merit in the proposed methods, such as enrichment factor, linear dynamic range and limit of detection (LOD) were investigated in the extraction of the CdII from aqueous solutions and optimum conditions. The results are summarized in Table 1. The calibration curves were obtained by plotting the peaks current height vs. the concentrations of cadmium in the aqueous sample (Figure 9). The maximum enrichment factor (100% CdII transfer from donor to acceptor) would be 25, while a reasonable factor of 15 was obtained in practice.
Limit of detection, enrichment factor (equation 1), linear dynamic range, squared correlation coefficient and relative recovery (equation 2) in distilled water, fish and rice
Calibration curve for CdII. Inset: differential pulse anodic stripping voltammograms of CdII standard solution after extraction under the optimized conditions at different concentration levels of (a) 2.0; (b) 4.0; (c) 8.0 and (d) 10.0 nmol L−1 CdII.
The reproducibility of the proposed method was evaluated using three separate modified electrodes, expressed as relative standard deviation (RSD), was evaluated by extracting the analyte from 5 aliquots of the same vial of water samples (spiked at 8.0 nmol L–1 CdII) and the RSD value was found to be 7.0%. Also, the LOD, which was 0.1 nmol L–1, was estimated based on a three signal-to-noise ratio criterion. Finally, a high enrichment factor of 15.0 was obtained for the analyte. All experiments were carried out at the room temperature.
Table 2 shows a comparison of the figures of merit of the investigated method with those reported in other publications based on stripping voltammetry.
Comparison of results obtained using the method described herein with those reported in other publications based on stripping voltammetry
Interference study
To evaluate the overall selectivity of the method under optimum conditions, the effects of different specimens were studied. To address the effects of interferences on the determination of CdII, standard solutions of analyte (8.0 nmol L–1) in the presence of different components, which might be present in real samples with different concentrations, were tested. Tolerance limit was defined as the maximum concentration of the substance that caused an error of less than 5% in the cadmium determination.4040 Saraji, M.; Bidgoli, A. A. H.; Farajmand, B.; J. Sep. Sci. 2011, 34, 1708. The results are given in Table 3. The results indicated that the compounds studied had no effects on the analysis when concentrations were up to 1000 times higher than cadmium. PAN is not highly selective for CdII. The selectivity is provided by the electrochemical measurement in which reoxidation of Cd occurs at a potential range at which no other species suffer redox reactions.
Interferences study for the determination of 8.0 nmol L–1Cd2+ under the optimized conditions
Real sample analysis
Due to the importance of the analysis of cadmium in complex matrices real samples, the proposed method was applied in order to determine the concentration of fish and rice samples. 10.0 ± 1.0 nmol kg–1 (0.001 ± 0.0002 mg kg–1) of cadmium in fish sample was found and there was no detection in the rice sample. Fish and rice samples were spiked with CdII at 1.0 nmol L–1. As can be seen from Table 1, the recoveries were 90 and 91 for fish meat and rice samples, respectively. To further demonstrate the practicality of the present electrode, it was evaluated by measuring CdII ions in tap water, wastewater and river water samples. A river water sample was collected from Zayandehrood River (Isfahan, Iran) and treated through a standard 0.45 µm filter. All water samples were spiked with CdII at different concentration levels and then analyzed with the proposed method (as summarized in Table 4). The accuracy of the method was also assessed by comparing the electrochemical results with those obtained using standard inductively coupled plasma optical emission spectroscopy (ICP) and conventional stripping anodic voltmmetry, using hanging mercury drop electrode. The obtained results with conventional stripping voltammetry do not agree with the ICP and the proposed method. This due to the interfering effect of some organic compounds presence in the real samples. The results are given in Table 4. It was found that the matrices of the real samples did not have any significant effect on the proposed (PTFE membrane-LPME)-DPASV method for the determination of CdIIin water, fish, and rice samples.
Conclusion
In the present study, the combination of PTFE membrane-LPME with in situ DPASV was successfully applied to the analysis of ultra-trace amounts of CdII in the real samples. Cadmium was extracted from real samples into the acceptor phase inside the PTFE membrane and analyzed in situ using DPASV. The results revealed that PTFE membrane-LPME could be used as an in situ pretreatment procedure before electroanalytical analysis. It was found that the combination of PTFE membrane-LPME and electrochemical techniques enhanced both selectivity and sensitivity for quantitative analysis. Due to the high total effective area of the gold nanoparticles, the anodic stripping voltammetric method relies exclusively on the underpotential deposition and stripping process of CdII on gold, with little hydrogen evolution during deposition at -0.40 V and no gassing at the stripping peak near 0.0 V vs. Ag/AgCl. The good selectivity for the underpotential deposition/stripping method is one of advantages of the proposed method. Complex matrices such as wastewater, fish, and rice were successfully analyzed using the proposed method.
Acknowledgments
The authors wish to thank Isfahan University of Technology (IUT) Research Council and Center of Excellence in Sensor and Green Chemistry for their support.
References
-
1Jarrett, J. M.; Xiao, G.; Caldwell, K. L.; Henahan, D.; Shakirova, G.; Jones, R. L.; J. Anal. At. Spectrom. 2008, 23, 962.
-
2Nordberg, G. F.; Fowler, B. A.; Nordberg, M.; Friberg, L.; Handbook on the Toxicology of Metals, 3th ed.; Academic Press: New York, 2007.
-
3Verougstraete, V.; Lison, D.; Hotz, P.; J. Toxicol. Environ. Health, Part B 2003, 6, 227.
-
4Munoz, E.; Palmero, S.; Garcya-Garcya, M. A.; Talanta 2002, 57, 985.
-
5Ajtony, Z.; Bencs, L.; Haraszi, R.; Szigeti, J.; Szoboszlai, N.; Talanta 2007, 71, 683.
-
6Tewari, P. K.; Singh, A. K.; Talanta 2001, 53, 823.
-
7Ensafi, A. A.; Ghaderi, A. R.; J. Hazard. Mater. 2007, 148, 319.
-
8Mikula, B.; Puzio, B.; Talanta 2007, 71, 136.
-
9Costa, A. C. S.; Lopes, L.; Korn, M. G. A.; Portela, J. G.; J. Braz. Chem. Soc. 2002, 13, 674.
-
10Tanikkul, S.; Jakmunee, J.; Lapanantnoppakhun, S.; Rayanakorn, M.; Sooksamiti, P.; Synovec, R. E.; Christian, G. D.; Grudpan, K.; Talanta 2004, 64, 1241.
-
11Raimundo, I. M.; Narayanaswamy, R.; Sens. Actuators, B 2003, 90, 189.
-
12Castillo, E.; Cortina, J. L.; Beltran, J. L.; Prat, M. D.; Granados, M.; Analyst 2001, 126, 1149.
-
13Sanchez-Pedreno, C.; Garcya, M. S.; Ortuno, J. A.; Albero, M. I.; Exposito, R.; Talanta 2002, 56, 481.
-
14Silva, C. L.; Masini, J. C.; Fresenius' J. Anal. Chem. 2000, 367, 284.
-
15Van Staden, J. F.; Matoetoe, M. C.; Anal. Chim. Acta 2000, 411, 201.
-
16Bonfil, Y.; Brand, M.; Kirowa-Eisner, E.; Anal. Chim. Acta 2002, 464, 99.
-
17Hocevar, S. B.; Svancara, I.; Vytras, K.; Ogorevc, B.; Electrochim. Acta 2005, 51, 706.
-
18Caoa, L.; Jia, J.; Wang, Z.; Electrochim. Acta 2008, 53, 2177.
-
19Alhemiary, N. A. F.; Al-Duais, M. A. H.; Mutair, A. A.; Wassel, A. A.; Alshrabi, B. M.; Albadany, B. A.; J. Iran. Chem. Res. 2011, 4, 9.
-
20Jha, M. K.; Kumar, V.; Jeong, J.; Lee, J.; Hydrometallurgy 2012, 111, 1.
-
21Whitchurch, C.; Andrews, A.; Analyst 2000, 125, 2065.
-
22Garcya-Reyes, J. F.; Ortega-Barrales, P.; Molina-Dyaz, A.; Microchem. J. 2006, 82, 94.
-
23Ensafi, A. A.; Hajian, R.; Food Chem. 2009, 115, 1034.
-
24Rezaei, B.; Damiri, S.; J. Hazard. Mater. 2010, 183, 138.
-
25Ensafi, A. A.; Rezaei, B.; Amini, M.; Heydari-Bafrooei, E.; Talanta 2012, 88, 244.
-
26Ensafi, A. A.; Heydari-Bafrooei, E.; Amini, M.; Biosens. Bioelectron. 2012, 1, 376.
-
27Rezaei, B.; Mirahmadi, S. Z.; Ensafi, A. A.; J. Braz. Chem. Soc. 2011, 22, 897.
-
28Gooding, J. J.; Electrochim. Acta 2005, 50, 3049.
-
29Dai, X.; Wildgoose, G. G.; Salter, C.; Crossley, A.; Compton, R. G.; Anal. Chem. 2006, 78, 6102.
-
30Avnir, D.; Acc. Chem. Res. 1995, 28, 328.
-
31Tokumoto, M. S.; Pulcinelli, S. H.; Santilli, C. V.; Briois, V.; J. Phys. Chem. B 2003, 107, 568.
-
32Kang, J.; Wistuba, D.; Schurig, V.; Electrophoresis 2002, 23, 1116.
-
33Zusman, R.; Rottman, C.; Ottolenghi, M.; Avnir, D.; J. Non- Cryst. Solids 1990, 122, 107.
-
34Levy, D.; Chem. Mater. 1997, 9, 2666.
-
35Oviatt Jr., H. W.; Shea, K. J.; Kalluri, S.; Shi, Y.; Steier, W. H.; Dalton, L. R.; Chem. Mater. 1995, 7, 493.
-
36Wang, J.; Pumera, M.; Talanta 2006, 69, 984.
-
37OShea, T. J.; Lute, S. M.; Anal. Chem. 1993, 65, 247.
-
38Ensafi, A. A.; Allafchian, A. R.; Saraji, M.; Mirahmadi Zare, S. Z.; Anal. Methods 2011, 3, 463.
-
39Saraji, M.; Farajmand, B.; Ensafi, A. A.; Allafchian, A. R.; Mirahmdi Zare, S. Z.; Talanta 2010, 82, 1588.
-
40Saraji, M.; Bidgoli, A. A. H.; Farajmand, B.; J. Sep. Sci. 2011, 34, 1708.
-
41Saraji, M.; Bidgoli, A. A. H.; Anal. Bioanal. Chem. 2010, 397, 3107.
-
42Hyotylainen, T.; Riekkola, M. L.; Anal. Chim. Acta 2008, 614, 27.
-
43Eshaghi, Z.; Khalili, M.; Khazaeifar, A.; Rounaghi, G. H.; Electrochim. Acta 2011, 56, 3139.
-
44Feng, C. S.; Wang, R.; Shi, B.; Li, G.; Wu, Y.; J. Membr. Sci. 2006, 277, 55.
-
45Goessi, M.; Tervoort, T.; Smith, P.; J. Mater. Sci. 2007, 42, 7983.
-
46Woolfenden, E.; J. Chromatogr. A 2010, 1217, 2685.
-
47Ensafi, A. A.; Taei, M.; Rahmani, H. R.; Khayamian, T.; Electrochim. Acta 2011, 56, 8176.
-
48Al-saleh, I.; Shinwari, N.; Biol. Trace Elem. Res. 2001, 83, 91.
-
49Zucchi, F.; Frignani, A.; Grassi, V.; Trabanelli, G.; DalColle, M.; Corros. Sci. 2007, 49, 1570.
-
50Armstrong, K. C.; Tatum, C. E.; Dansby-Sparks, R. N.; Chambers J. Q. ; Xue, Z. L. ; Talanta 2010, 82, 675.
-
51Tarley, C. R. T.; Santos, V. S.; Baeta, B. E. L.; Pereira A. C. ; Kubota, L. T. ; J. Hazard. Mater. 2009, 169, 256.
-
52Wu, Y.; Li, N. B.; Luo, H. Q.; Sens. Actuators B 2008, 133, 677.
-
53Guell, R.; Aragay, G.; Fontas, C.; Antico E.; Merkoci, A.; Anal. Chim. Acta 2008, 627, 219.
-
54Sherigara, B. S.; Shivaraj, Y.; Mascarenhas R. J.; Satpati, A. K. ; Electrochim. Acta 2007, 52, 3137.
-
55Jakmunee J. ; Junsomboon, J. ; Talanta 2008, 77, 172.
-
56Mahesar, S. A.; Sherazi, S. T. H.; Niaz, A.; Bhanger, M. I.; Rauf, A.; Food Chem. Toxicol 2010, 48, 2357.
-
57Ensafi, A. A.; Nazari, Z.; Fritsch, I.; Analyst 2012, , 424.
-
58Alves, G.; Magalhaes, J. M.; Tauler, R.; Soares, H. M.; Electroanalysis 2013, 25, 1895.
Publication Dates
-
Publication in this collection
July 2015
History
-
Received
21 Feb 2015 -
Accepted
08 May 2015