Computational Design and in silico Screening of Selective Chromone-Based COX-2 Inhibitors
Abstract
This study applied an integrated in silico workflow to design and evaluate chromone-based derivatives (1-20) as selective cyclooxygenase-2 (COX-2) inhibitors with prospective anti-inflammatory activity. Computational methods included density functional theory calculations at the B3LYP/6-31G(d,p) level, molecular docking, ADMET (absorption, distribution, metabolism, excretion, and toxicity) prediction, and molecular dynamics simulations. Among all screened compounds, ligand 3 demonstrated superior binding affinity toward COX-2 (-10.9 kcal mol-1) relative to celecoxib (-9.4 kcal mol-1). Docking revealed stable interactions with critical active site residues, including Gln (glutamine), Leu (leucine), His (histidine), and Val (valine). Density functional theory (DFT) results showed a relatively low HOMO (highest occupied molecular orbital)-LUMO (lowest unoccupied molecular orbital) energy gap of 3.820 eV, indicating enhanced chemical reactivity and potential biological activity. Molecular dynamics simulations of the ligand 3:COX-2 (cyclooxygenase-2) complex (PDB ID: 5F19) confirmed structural stability across temperatures from 300 to 320 K, with low root mean square deviation (RMSD) fluctuations of approximately 0.4 nm and consistent radius of gyration values, and optimal stability observed at 31 K. ADMET analysis predicted good intestinal absorption and moderate lipophilicity (LogP 1.86); however, high molecular weight (623.67 g mol-1) and elevated topological polar surface area (160.03 Å2) may compromise oral bioavailability. Overall, ligand 3 appears to be a promising COX-2 selective inhibitor. However, reliance on predictions requires experimental validation.
Keywords:
chromone; cyclooxygenase enzyme; virtual screening; ADMET; MDS; PCA
Introduction
Inflammation is a natural defense mechanism of the body that is triggered in response to injury or infection. Immune receptors activate a series of mediators, such as tumor necrosis factor (TNF), which work to heal tissues. This process often results in pain and fever due to the production of prostaglandins in inflamed areas.1,2 Among the critical mediators in this process are prostaglandins, lipid ligands derived from arachidonic acid that are significantly elevated in injured tissues.3-5 These molecules play key roles in inducing symptoms like pain and fever and work in conjunction with other biological agents, such as C-reactive protein, to promote healing and blood clotting.4,5 Different types of prostaglandins, such as PGE2, PGI2, and PGD2, contribute uniquely to the inflammatory response.6-8 Nonsteroidal anti-inflammatory drugs (NSAIDs) have long been used to manage inflammation, pain, and related conditions such as arthritis. These drugs work by inhibiting the cyclooxygenase (COX) enzyme, which converts arachidonic acid into prostaglandins.8 However, despite their effectiveness, prolonged use of NSAIDs is linked to adverse effects such as gastrointestinal issues, liver and kidney damage, and cardiovascular concerns, particularly with selective COX-2 inhibitors like rofecoxib.9,10 This has led to a growing need for safer alternatives that retain the therapeutic benefits of NSAIDs while minimizing risks.11
Chromones, a unique class of natural and synthetic ligands characterized by a benzopyranone ring structure, have attracted significant attention in the scientific community due to their diverse medicinal properties. Research highlights their potential as anti-inflammatory, anticancer, antioxidant, and antimicrobial agents, with particular interest in chromone derivatives targeting COX 2 over COX-1.12 They are also being explored for their potential to treat allergies and high blood pressure.13,14 Promising peptides, essential for numerous bodily functions, are being investigated as new medications.15-17 However, they face challenges such as rapid degradation, poor absorption into the bloodstream, and unintended side effects. Researchers are working to overcome these hurdles to unlock peptides’ full potential as drugs.18 Peptidomimetics are designed to mimic the beneficial actions of peptides, with critical improvements such as greater stability, improved absorption, and reduced susceptibility to enzymatic breakdown. These features make peptidomimetics valuable for medicinal chemists, particularly in developing new antiviral drugs.19-21 This specificity could provide a safer alternative to traditional nonsteroidal anti-inflammatory drugs (NSAIDs),22 minimizing gastrointestinal side effects while still offering effective pain relief. However, the selectivity of chromone derivatives remains an area for improvement, necessitating further refinement to reduce the risk of adverse effects.
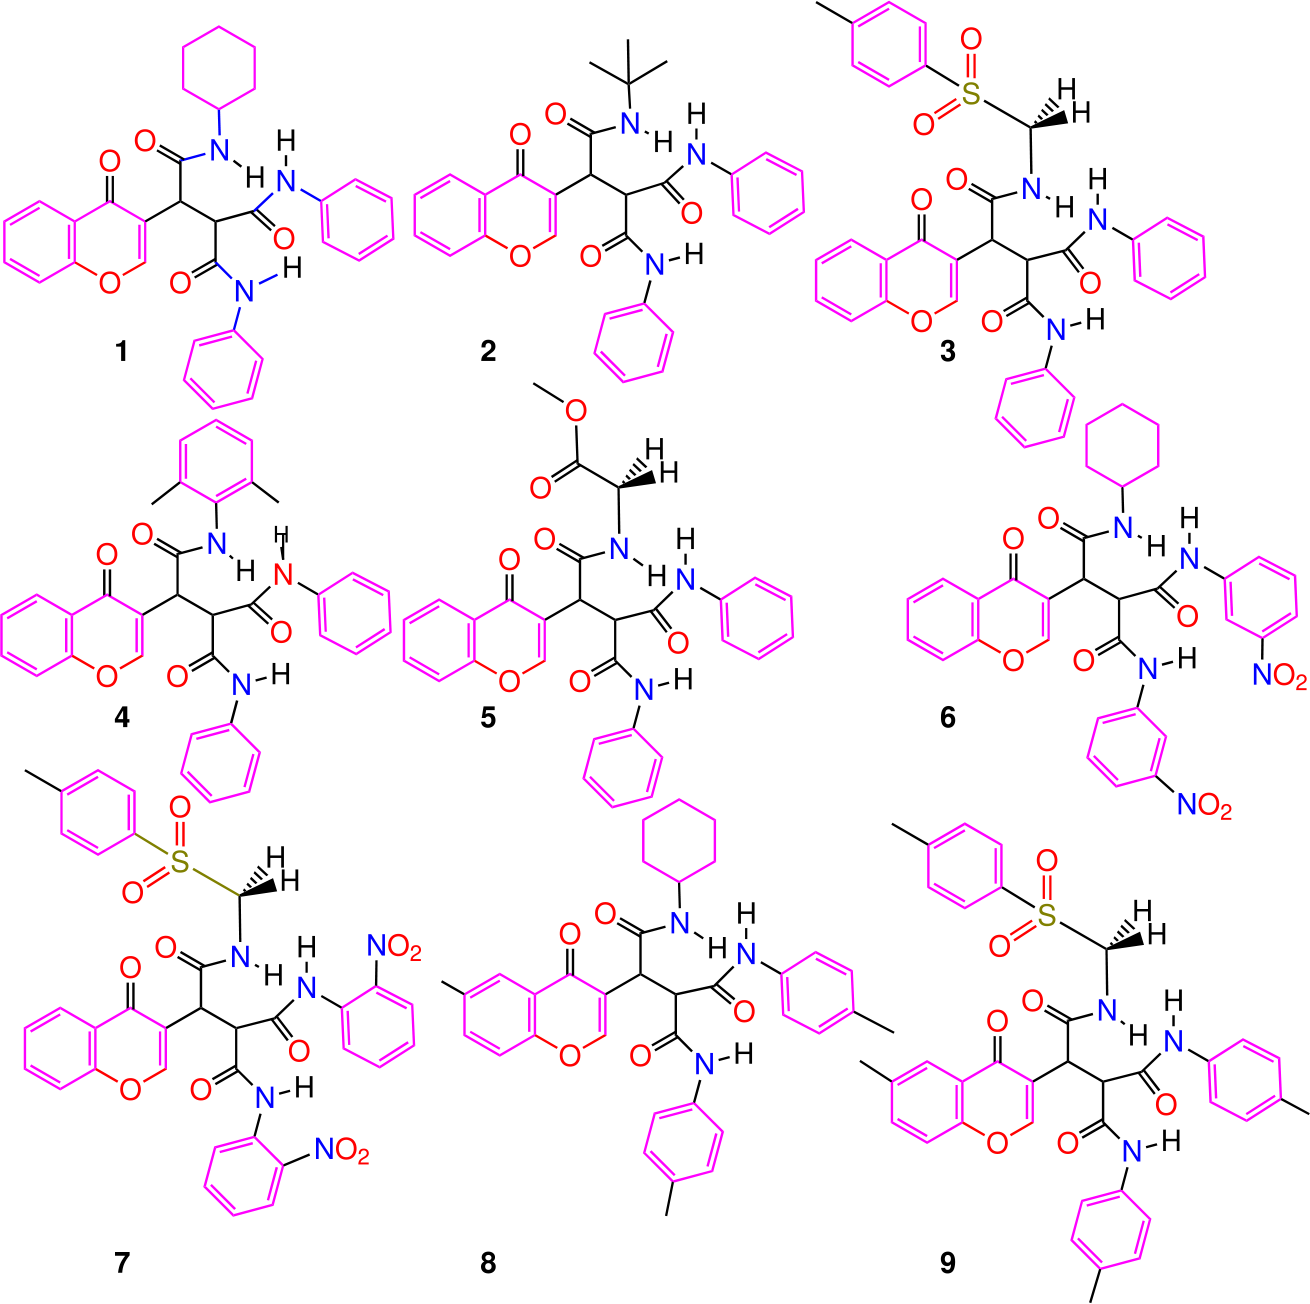
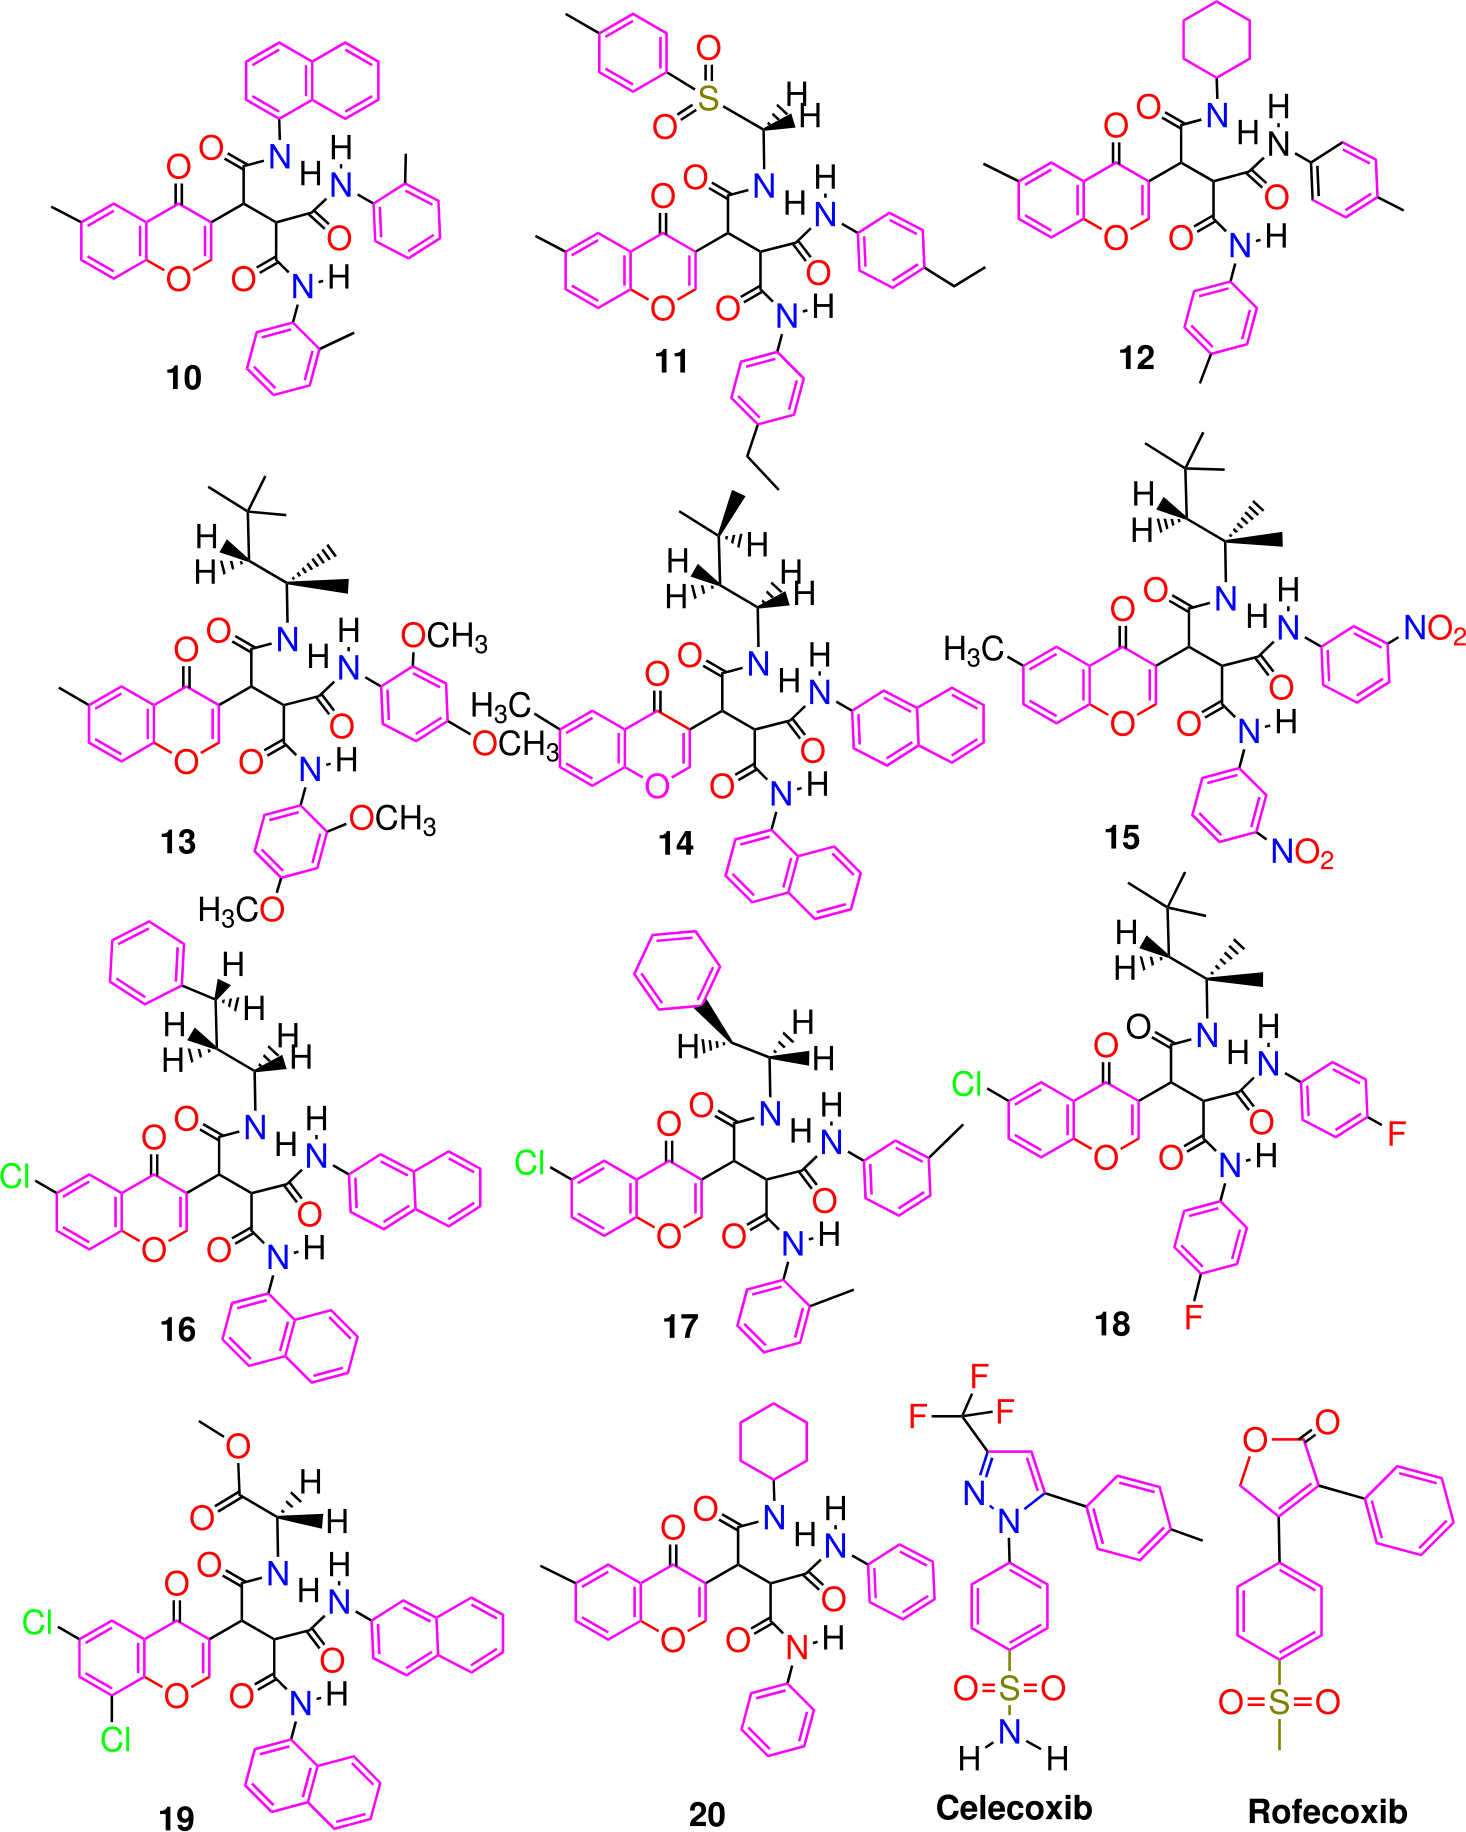
Combining chromones, hydrazine’s, quinolones, naphthoquinones, and flavonoids with advanced computational techniques such as molecular docking and molecular dynamics (MD) simulations presents a promising strategy for the discovery of novel and more effective anti-inflammatory agents.23-27 Recent studies2327 have utilized in silico approaches to evaluate various chemical derivatives’ therapeutic potential against multiple diseases. In a related effort, Wynn et al.28 reported the synthesis of a library of 100 novel peptidomimetics incorporating chromone scaffolds via a straightforward one-step reaction at room temperature. This method employed a combination of building blocks, including 3-formylchromones, amines, isocyanides, and Meldrum’s acid, resulting in a structurally diverse set of compounds with potential medicinal value. However, these ligands have not yet been explored computationally. Conducting in silico analyses on this set of 100 ligands, compounds 1-20 could uncover promising drug candidates, as illustrated in Figures 1 and 2.
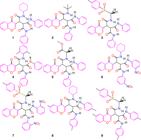
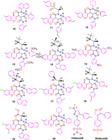
Chemical structures of chromone derivatives (10-20) and COX-2 inhibitors, celecoxib and rofecoxib.
This study investigates a series of 3-formyl chromone derivatives, 1-20, for their potential as treatments for conditions such as diabetes, pain, and muscular dystrophy.28 The structural behavior and binding potential of these compounds are evaluated using advanced computational methods, including molecular docking and molecular dynamics (MD) simulations. Celecoxib serves as a reference drug for comparison. The aim is to gain insights into how the structure and energetic properties of these chromone derivatives influence their therapeutic potential, thereby contributing to the design of more effective and targeted medications.
Methodology
Computational analysis
All computations were performed using the Gaussian16 software,29 with GaussView 630 utilized for both the design and visualization of the chromone derivatives (1 20). Specifically, GaussView 6 was employed to assess the energy distribution between the highest occupied molecular orbital (HOMO) and the lowest unoccupied molecular orbital (LUMO), as well as to generate molecular electrostatic potential (MEP) maps. The optimized molecular geometries, along with HOMO, LUMO, and MEP visualizations, are provided in Tables S1-S20 and Figures S1-S11 (Supplementary Information (SI) section). In this study, several key chemical parameters were calculated for the chromone derivatives, including the energy gap (EGap), chemical potential (μ), hardness (Η), softness (Σ), and electrophilicity (Ω). These properties were derived using the following standard formulas: EGap (eV) = (ELUMO - EHOMO); IP (eV) = -EHOMO; EA (eV) = -ELUMO; μ (eV) = (IP + EA)/2; Χ (eV) = (IP + EA)/2; Η = (IP - EA)/2; Σ = 1/Η; Ω = μ2/2Η.31-33
Analysis of physicochemical and pharmacokinetic properties
We employed publicly available web-based tools, such as AdmetSAR34 and SwissADME,35 to estimate and evaluate various properties including drug-likeness, medicinal chemistry, lipophilicity, physicochemical characteristics, pharmacokinetics, and water solubility. To streamline this process, we used the Simplified Molecular Input Line Entry System (SMILES) format. The chemical structures of the ligands (1-20) were initially generated using ChemBioDraw Ultra 14.0,36 and then converted to SMILES format to facilitate data collection in MDL Molfile format.
Pharmacological attributes
Using the Prediction of Activity Spectra for Substances (PASS) tool,37 we identified various pharmacological effects for the 20 ligands (1-20) as well as the reference drugs. These effects included chemopreventive activity, induction of apoptosis, antineoplastic and antileukemic activity, and inhibition of the Myc oncogene. The PASS web server also provides information on biologically active substances that have been approved in both the USA and Russia.38
Molecular docking
Preparation of ligands
Using GaussView version 6, along with the reference drug celecoxib obtained in PDB format from AlphaFold Protein Structure Database38 and the RCSB Protein Data Bank,39 we generated three-dimensional (3D) structural data files for the anti-inflammatory agents (1-20). The structures were then optimized using the Gaussian 16 package with the B3LYP/6-31G(d,p) method. To prepare the ligands for docking, PyRx 0.8 developed by Dallakyan et al.40 was employed to minimize their individual energies. Finally, the LOG files of each ligand were converted into PDBQT format using the Open Babel open chemical toolbox.41
Preparation of the target protein
Using the AlphaFold Protein Structure Database38 and the RCSB Protein Data Bank,39 we employed molecular docking tools to identify proteins with potential binding sites for our ligands. The study specifically focused on the following protein structures: human epidermal growth factor receptor 2 (HER2; PDB ID: 7JXH), epidermal growth factor receptor (EGFR; PDB ID: 4UV7), farnesyl diphosphate synthase (FPPS; PDB ID: 1YQ7), hematopoietic prostaglandin D synthase (H-PGDS; PDB ID: 1V40), human COX-1 (PDB ID: 6Y3C), and human COX-2 (PDB ID: 5F19).
The quality of these protein structures was evaluated using Ramachandran plots via the SAVESv6.0 website,42 and their Z-scores were assessed using ProSA.43 Structural optimization was performed using Chimera version 1.1644 to ensure optimal performance during molecular docking experiments. The AMBER ff14SB force field in Chimera 1.16 was applied by default for both proteins and ligands (1 20).28
Protein-ligand docking
The Vina Wizard in PyRx40 was used to conduct molecular docking between the ligands (1-20) and reference drugs against the H chain of the six target proteins (HER2, EGFR, FPPS, H-PGDS, COX-1, and COX-2). To validate the docking results, a redocking method was employed. Throughout the docking process, the stability of both the proteins and ligands was maintained, and the simulations were repeated to enhance reliability. Following the docking procedure, UCSF Chimera (v1.16),44 PyMOL (v2.5)45 developed by Schrödinger and BIOVIA Discovery Studio46 developed by Dassault Systèmes were used to visualize the binding sites and analyze receptor-ligand interactions. UCSF Chimera44 identified the interacting amino acids, PyMOL45 generated 3D images of the docked complexes, and BIOVIA Discovery Studio provided visualizations of 2D interactions between proteins and ligands, including hydrogen bond density around the interacting residues.46
Molecular dynamics simulation
Molecular dynamics (MD) simulations were performed using the GROMACS 2021.6 package47,78 to explore interactions between the target protein and the protein-ligand complexes (ligands 3 and 4). The simulations employed the AMBER99SB force field,49 which provides detailed information on atomic interactions. MD simulations offer high accuracy and valuable insights into the behavior of multidimensional systems often difficult to obtain experimentally.50 Additional MD simulations were performed using the H chain on docked complexes involving PDB: 5F19 with ligands 3 and 4 to validate previous findings. The Galaxy European Server, a widely used molecular modeling and simulation platform,51 was employed to generate the protein’s topological parameters. The simulation setup included the TIP3P water model, the removal of hydrogen atoms from the GROMACS configuration, the addition of hydrogens to the ligands at pH 7.4, the preservation of the molecular charge at 0 with a multiplicity of 1 during topology generation, and the application of the gaff force field for parameterization. The structural configuration was created by combining the ligand and protein files within a triclinic box of 1 nanometer. Sodium and chloride ions were added to achieve standard salt concentrations and neutralize the system after it was solvated with sample point charge (SPC) water molecules in the triclinic box.
System stability was maintained through an equilibration process that applied the leapfrog algorithm and position-restrained dynamics (NVT) at 300 K for 3000 ps.23-27,52 Following this equilibration, the system was run for an additional 3000 ps under constant pressure and temperature during the production phase. Subsequently, the system was simulated for 20 ns at the same temperature and pressure. Various GROMACS utilities, including gmx rmsd, gmx gyrate, gmx rmsf, and gmx hbond, were used to generate graphs depicting the hydrogen bonds of the ligands, RMSF (root mean square fluctuation), RMSD (root mean square deviation), and Rg (Radius of gyration) at 300 K over the 20 ns simulation period. Principal component analysis (PCA) was conducted to assess the stability of the protein-ligand complexes at 300 K for ligand 3, at 300, 305, 310, and 320 K, using the Bio3D package available on the GALAXY Europe server.53-56 The cosine content of the ligands was also evaluated. These molecular dynamics simulations provided valuable insights into protein-ligand complexes, enhancing our understanding of the physical principles that govern the structure and function of biological macromolecules.
Results and Discussion
Analysis of frontier molecular orbital
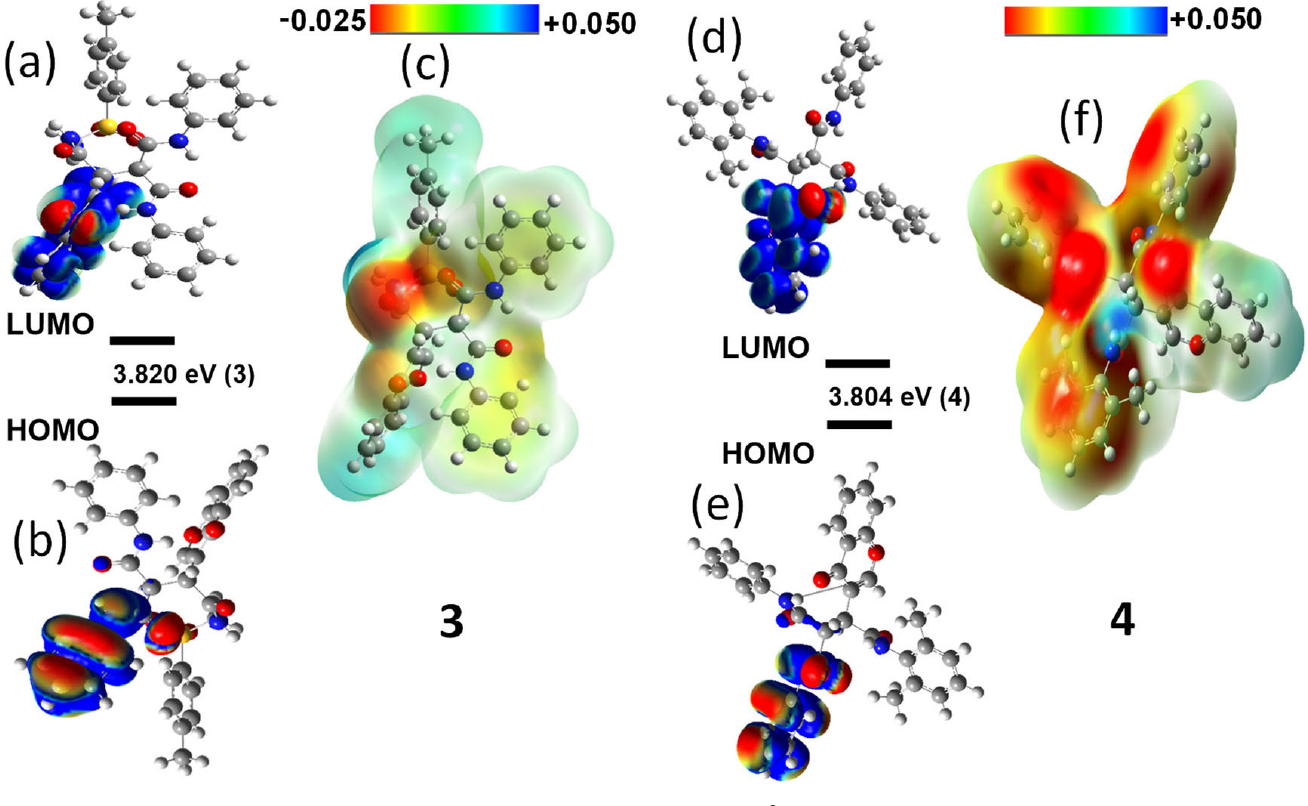
Density functional theory (DFT) calculations using the B3LYP/6-31G(d,p) method were carried out on chromone derivatives (1-20) to evaluate their Frontier Molecular Orbitals (FMOs)57 and the energy gap between the HOMO-LUMO gap (Egap). A lower LUMO energy suggests enhanced electron acceptance, while a higher HOMO energy indicates a greater propensity for electron donation. A larger Egap generally denotes higher stability and reduced reactivity. Additionally, DFT calculations were used to determine other properties, including ionization potential (IP), electron affinity (EA), electronegativity (Χ), chemical potential (μ), global hardness (Η), softness (Σ), electrophilicity (Ω), and dipole moment. The detailed results are presented in Table 1 and Figure 3 (also in the SI section, Figures S1-S7). The analysis revealed that ligands 3 and 4 exhibited lower Egap values (3.820 and 3.804 eV, respectively) compared to reference drugs, suggesting greater potential stability. The Egap values decreased slightly from ligand 1 to 20, indicating a gradual decrease in stability. Based on this combined analysis, particularly the favorable Egap and stability profiles, ligands 3 and 4 emerged as encouraging candidates for further investigation. The molecular electrostatic potential (MEP) maps, shown in Figure 3 and Figures S8-S11 of the SI section, visually depict the inherent electrostatic potential of the chromone derivatives. These color-coded maps highlight regions with electrophilic (electron-deficient, blue) and nucleophilic (electron-rich, red) characteristics. When combined with the DFT calculations, this information provides valuable insights into the chemical properties and reactivity profiles of the studied ligands.
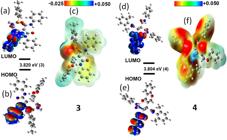
(a-b and d-e) Molecular orbitals of isodensity surfaces (0.02 electrons Bohr-3 surface) (red = electron-rich, blue = electron-deficient) of LUMO and HOMO; (c and f) maps of electrostatic potential (0.02 electrons Bohr-3 surface) (red = electron-rich, blue = electron-deficient) for the ligands 3 and 4, respectively.
In silico molecular docking
This computational method offers valuable insights into chemical interactions between protein active-site residues and their subsequent biological implications. Table 2 presents the binding affinities of twenty chromone derivatives (1-20) and the reference COX-2 inhibitor (celecoxib) to six target proteins: COX-1, COX-2, HER2, EGFR, FPPS, and H-PGDS. A lower binding energy (more negative value) indicates a stronger interaction between the ligand and the target protein. Notably, the target protein COX-2 (PDB: 5F19) exhibited higher binding affinities with all tested drugs than the other proteins. Several ligands exhibit strong binding affinity for other targets, such as HER2 and EGFR. This suggests potential multi-target activity, which might be beneficial in certain therapeutic contexts. Our primary goal is to identify ligands that selectively inhibit COX-2 over COX-1. A selective COX 2 inhibitor would minimize side effects associated with non-selective NSAIDs. Ligands 1, 3, 4, 6, 8, 11, and 14 show the strongest binding affinity towards both COX-1 and COX-2. These ligands might be potential inhibitors of COX enzymes. Among them, ligand 3, 4, and 14 exhibit a higher binding affinity to COX-2 (5F19) at -10.9, -10.6, and -11.6 kcal mol-1, respectively, compared to COX-1 (6Y3C), which could translate to a reduced risk of side effects. Interestingly, compared to the ligands tested (1 20), the reference drug celecoxib exhibited slightly lower binding affinities with COX-1 (-7.6 kcal mol-1) and COX-2 (-9.4 kcal mol-1) proteins. Though ligand 14 has a limitation in the optimized structure, we have chosen ligands 3 and 4, which appear to be promising candidates for selective COX-2 inhibition.
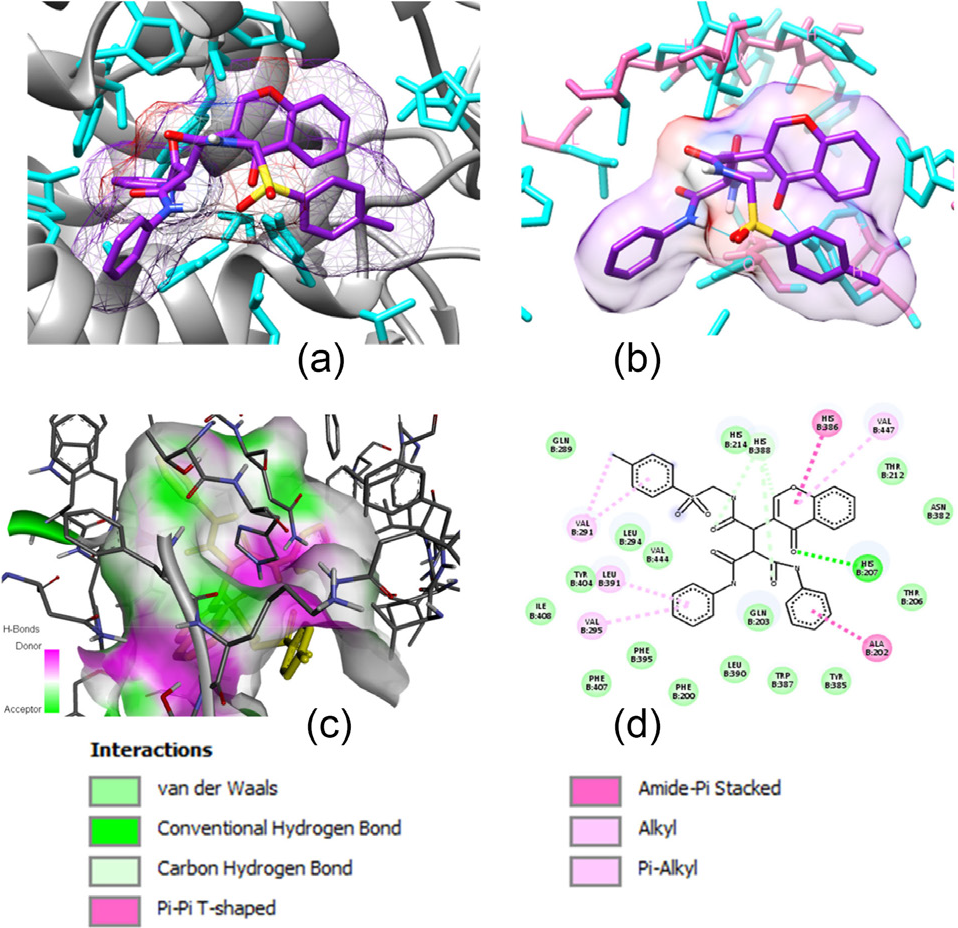
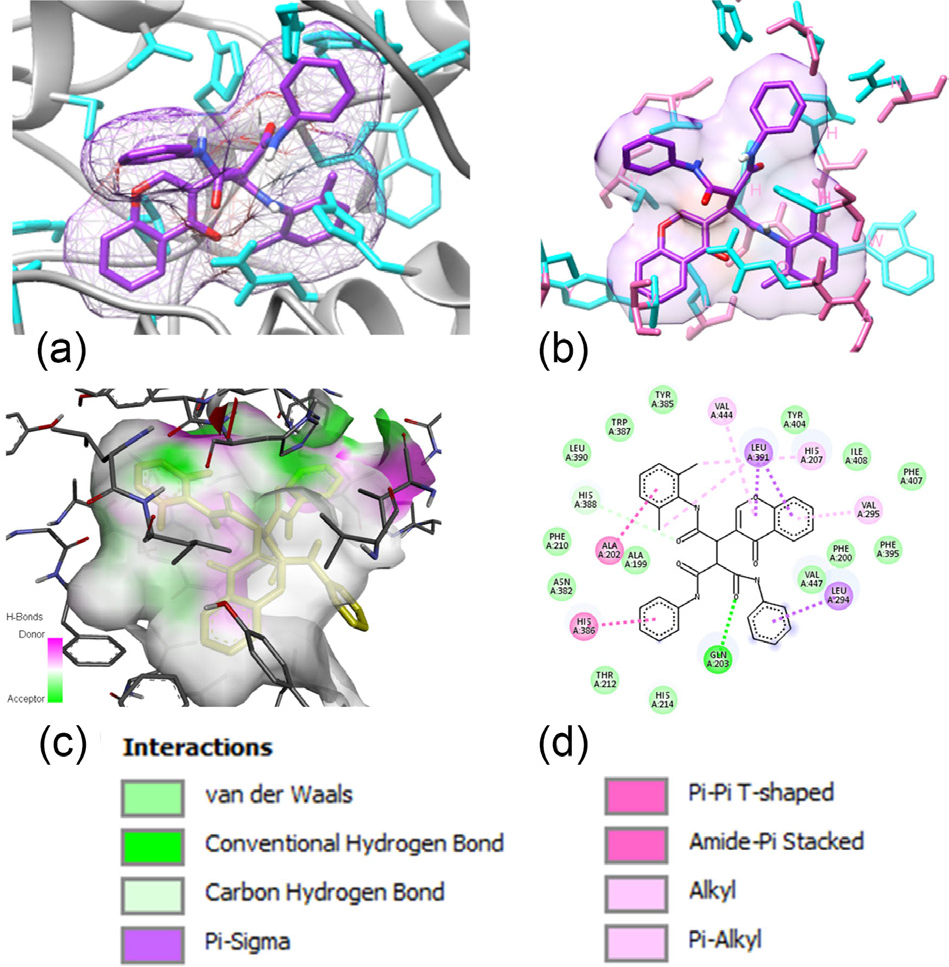
Furthermore, by examining the chemical bonds and interactions between the ligand and protein, we can uncover how the ligand influences the active sites of disease-causing pathogens. The research provides precise bond length data for each bond type and residue number. Figures 4 and 5 visually represent the interaction between the target protein COX-2 (5F19) and ligands 3 and 4, showcasing (Figures 4a and 5a) the ligand within the protein cavity, (Figures 4b and 5b) key active site residues, (Figures 4c and 5c) hydrogen bond distribution, and (Figures 4d and 5d) ligand-protein interactions. The SI section contains the remaining docking images (see Figures S12 and S13).

The molecular docking poses: (a) ligand in protein pocket; (b) active site; (c) hydrogen bonding in solid; (d) ligand-protein interaction for 2D diagram, for ligand 3 in 5F19.
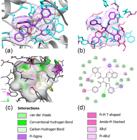
The molecular docking poses: (a) ligand in protein pocket; (b) active site; (c) hydrogen bonding in solid; (d) ligand-protein interaction for 2D diagram, for ligand 4 in 5F19.
Multiple software tools, including UCSF Chimera, Pymol version 2.5, and BIOVIA Discovery Studio, were utilized for in-depth analysis of all 20 ligands and their corresponding protein targets. Figures 4a and 4b depict the COX-2 binding site (PDB: 5F19) in complex with ligand 3, highlighting the specific active-site residues involved in ligand binding. Nitrogen atoms are colored blue, hydrogen white, and oxygen red in Figures 4 and 5, with active site residues interacting with the ligands shown in blue. The active site comprises amino acids such as Gln (glutamine), Leu (leucine), His (histidine), Val (valine), Asn (asparagine), Thr (threonine), Phe (phenylalanine), Tyr (tyrosine), Ile (isoleucine), Ala (alanine), and Trp (tryptophan). Two robust hydrogen bonds are observed between the ligand and the active site 5F19 at distances of 2.157 and 2.089 Å, respectively. Figure 4c illustrates the distribution of hydrogen bond density in the ligand-protein pocket, using magenta to signify donor hydrogen bonds and green for acceptor hydrogen bonds. Figure 4d highlights various intramolecular interactions involving the ligand, including a conventional hydrogen bond with His, five Pi-alkyl bonds with Leu and three Val residues, and two van der Waals forces contributed by His residues.
In Figures 5a and 5b, the binding pocket of COX-2 (PDB: 5F19) encloses ligand 4, identifying the active site residues interacting with the ligand, primarily consisting of Leu, Val, Tyr, Gln, Ile, Phe, His, Ala, Trp, and Asn. The analysis reveals a conventional hydrogen bond involving a Gln residue in the 5F19 active site, which interacts with an oxygen atom from one of the three peptide bonds. Figure 5c shows the hydrogen bond density distribution within the ligand-protein pocket, with magenta and parrot green denoting donor and acceptor hydrogen bonds, respectively. Figure 5d illustrates an array of intramolecular bonds within the ligand-protein pocket, including van der Waals interactions, carbon-hydrogen bonds, Pi-alkyl interactions, and conventional hydrogen bonds.
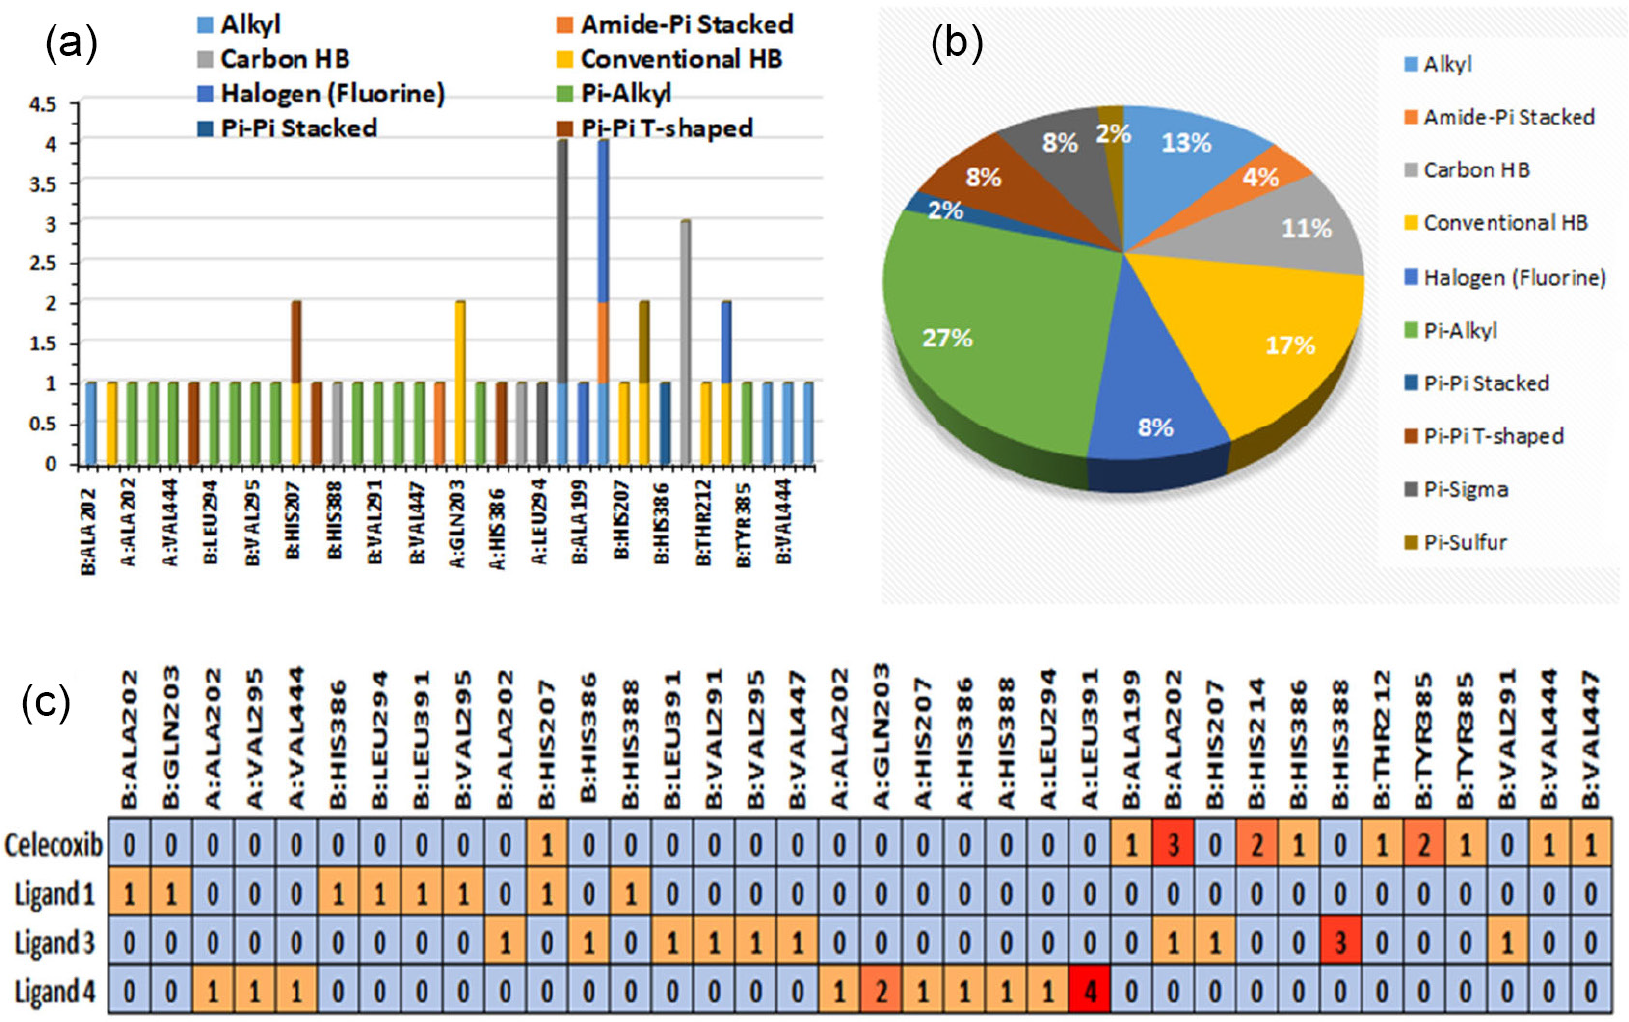
Beyond the docking values, the study emphasizes interactions between ligands 1, 3, 4, and celecoxib with COX-2 protein complexes, as depicted in Figure 6. Residues such as Gln203, His207, His388, His214, Thr212, Tyr385, Val444, Ala202, Val291, Leu391, Leu294, and Ala199 within the fusA binding site engage in noncovalent interactions with these ligands (Figure 6a). Conventional hydrogen bonding constitutes 17%, and carbon-hydrogen bonding accounts for 11% of all interactions (Figure 6b). Additionally, hydrophobic interactions involving alkyl groups contribute to 13%, Pi-alkyl interactions to 27%, Pi sigma to 8%, halogen interactions to 8%, Pi-Pi stacked to 2%, Pi sulfur to 2%, Pi-Pi T-shaped to 8%, and amide Pi stacked interactions to 4% of the total interactions. Key residues such as Leu391, Ala202, His388, Gln203, His214, and Tyr385 exhibit multiple interactions with ligands, underscoring their significance in peptide attachment (Figure 6c). Other crucial residues interacting with these ligands include His207, Val444, Thr212, Val291, and Leu294. Consequently, the in silico analysis suggests that these ligands have promising potential to affect the COX-2 protein.
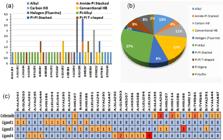
(a) Residues in interaction within 5F19, (b) the distribution of non-covalent interactions, and (c) a map illustrating the interaction between residues in 5F19 with ligand 1, 3, and 4; and the reference drug of celecoxib complex
Analysis of physicochemical and pharmacokinetic properties
The analysis of physicochemical properties is essential for determining whether chromone derivatives (1 20) conform to the Lipinski and Veber guidelines. Lipinski’s guidelines require that a ligand meet five parameters for successful oral administration: (i) molecular weight (MW) < 500 g mol-1; (ii) octanol-water partition coefficient (logP) < 5; (iii) number of H-bond donors (HBD) ≤ 5; (iv) number of H-bond acceptors (HBA) ≤ 10; and (v) topological polar surface area (TPSA) ≤ 140 Å2.52 Additionally, Veber introduces another set of prerequisites for drug bioavailability: (i) number of rotatable bonds (nrotb) must be ≤ 10, and (ii) TPSA must remain ≤ 140 Å2 (in adherence with Lipinski’s guidelines).53 In this study, SwissADME was used to assess the compatibility of ligands (1-20) with these critical biological activity requisites. Out of the 20 ligands, 8 have been identified as conforming to the majority of Lipinski and Veber regulation limit ranges, as depicted in Table 3. However, it is worth noting that all ligands surpass the molecular weight limit, revealing a potential area for further investigation and optimization.58
Table 3 provides a comprehensive overview of the physicochemical and drug-likeness attributes for the set of 20 chromone derivatives. Noteworthy observations include ligand (7) demonstrating the highest count of hydrogen bond acceptors, while all ligands exhibit an identical number of hydrogen bond donors. Ligand (13) stands out for its high number of rotatable bonds, a characteristic that can enhance oral bioavailability by increasing ligand flexibility. Molecular weight is an influential factor that affects the ability of the a ligand to efficiently reach its intended target site. None of the ligands adhere to Lipinski’s rule that the molecular weight does not exceed 450 500 g mol-1, but ligands (1, 2, 4, 5, and 8) closely approach the recommended threshold, with values ≤ 600 g mol-1.
Of the ligands within the series (1-20), seven demonstrate favorable TPSA values, a determinant of a ligand’s permeability through parameters like passive diffusion, blood-brain barrier permeability, and peripheral circulation restriction. Notably, ligands (1, 2, 4, 8, 10, 17, 18, and 20) exhibit acceptable counts of rotatable bonds, while ligands (12, 14, and 16) display TPSA values outside the recommended range. All ligands exhibit commendable lipophilicity, a vital trait. Ligand 3 has the highest LogP, suggesting better absorption but potentially higher toxicity. The LogP value (1.86) of ligand 3 is within an acceptable range for drug-like molecules, suggesting good absorption and distribution. With 3 HBD and 7 HBA, ligand 3 has the potential to form hydrogen bonds with biological targets. Lastly, ligand 7 emerges as the least suitable for oral administration, flagging the highest number of violations (three) against both Lipinski and Veber guidelines. This highlights the importance of strict adherence to these guidelines for optimizing ligand suitability for oral delivery. While ligand 3 shows promising properties in terms of LogP and HBD/HBA, the high molecular weight might be a concern. Further optimization or formulation strategies might be needed to improve its oral bioavailability. Additionally, the relatively high number of rotatable bonds could increase the complexity of its conformational space, potentially affecting its selectivity.
Analysis of bioactivity and drug-likeness of chromone derivatives
All the ligands (1-20) that conformed to the rule of six parameters are shown in Table 4, including the G protein-coupled receptor (GPCR), ion channel modulators (ICM), kinase inhibitors (KI), nuclear receptor ligands (NRL), protease inhibitors (PI), and enzyme inhibitors (EI). A bioactivity score of 0.00 indicates that a chemical has a high potential for downstream biological activity. A score between -0.50 and 0 indicates strong biological activity, whereas a score below -0.50 implies inactivity. Ligand 3 from Table 4 exhibits relatively low scores across all parameters, suggesting a balanced profile.
The analyzed flavonoid compounds show moderate potential for interactions with GPCRs, proteins, and enzymes. Apart from ligands (7, 11, 13, and 15), all flavonoids demonstrated good bioactivity in at least one of the six pathways tested. The findings suggest that a variety of processes may be involved in the pharmacological activity of medicinal molecules. Their interactions with GPCR ligands, nuclear receptor ligands, and protease and other enzyme inhibitors may be critical to their physiological effects. The GPCR value ligand 1 (-0.09) is very close to that of the reference drug celecoxib (D1) (-0.06), according to the Molinspiration drug-likeness calculation criteria (Table 4).
Based on the drug-likeness scores, ligands 19 and 3 appear to have favorable profiles. Efficient assessment of pharmacokinetic properties, which include absorption, distribution, metabolism, excretion, and toxicity (ADMET), is critical for accelerating drug development while reducing costs. For assessing the ADMET properties of active ligands (1-20), the SwissADME platform and AdmetSAR tools were used. As shown in Table 5, the ligands (1-20) were evaluated across six ADMET parameters: human intestinal absorption (HIA), blood-brain barrier (BBB) permeability, plasma protein binding (PPB), cytochrome P450 enzyme interactions (CYP3A4 and CYP2C19), and synthetic accessibility (SA) score. Notably, BBB permeability is an important factor for medications targeting the central nervous system (CNS), with classifications indicating high (> 2), medium (2-0.1), or low (0.1).
Our data show that most drugs had BBB penetration values ranging from +0.60 to +0.70, with ligands 12 and 17 having the greatest values, but lower than the reference celecoxib (D1). The analysis also demonstrates that, except for ligand (5), most ligands had high HIA values, with ligands 2 and 18 having absorption rates similar to celecoxib. Furthermore, all ligands have excellent water solubility. Notable findings include cytochrome P450 enzyme interactions, with all drugs exhibiting positive/negative CYP3A4 inhibition. In contrast, although displaying negative inhibition for CYP2C19, most drugs, with the exception of (13, 15, 16, 17, 18, and 19), differ from the reference celecoxib (D1).
Analysis of pharmacological activities
The Prediction of Activity Spectra for Substances (PASS) framework was used to characterize ligands (1-20) in a novel way, using the innovative Multilevel Neighborhoods of Atoms (MNA) descriptors. PASS is a computational method capable of simultaneously predicting multiple biological activities, including analgesic, non-opioid analgesic, and muscular dystrophy therapy modalities. Such predictions depend on biological activity, which considers not only ligand features such as structure and physicochemical properties, but also biological factors such as species, gender, and age, as well as treatment variables such as dose and route of administration. PASS provides two probabilistic indicators of a ligand’s projected activity spectrum, based on quantified MNA descriptors: probable activity (Pa) and probable inactivity (Pi). These Pa and Pi values, which range from 0.000 to 1.000 (with Pa + Pi ≠ 1), indicate whether a chemical molecule is active or inactive. In general, the results of PASS predictions are used in a flexible manner, as follows: (i) Pa values greater than 0.7 indicate a higher likelihood of successful experimental activity discovery; (ii) Pa values between 0.5 and 0.7 indicate a lower likelihood of successful experimental activity discovery, possibly due to structural dissimilarity to established pharmaceutical agents; and (iii) Pa values less than 0.5 indicate a lower likelihood of successful experimental activity discovery.
None of the ligands in our list, including the reference drug D1, shows Pa value in the higher likelihood range (Pa > 0.7). Furthermore, most of the chromone derivatives did not show any analgesic or non-opioid analgesic activity, as shown in Table 6. However, ligands (3, 9 and 11) with values for analgesic ranging from Pa = 0.578 to Pa = 0.645, which are clearly higher than those of the reference drug (celecoxib, Pa = 0.412). These three ligands also have satisfactory scores in the non-opioid analgesic category.
Although these Pa values suggest that the chance of discovering the activity experimentally is low, we cannot entirely rule out this possibility, as structures similar to compounds 3, 4, and 5 may not be available in the database. Seven ligands show potential for muscular dystrophy activity, with Pa values ranging from 0.5 to 0.7. These ligands are arranged in descending values Pa: 6 (Pa: 0.605) > 4 (Pa: 0.585) > 1 (Pa: 0.563) > 7 (0.547) = 8 (Pa: 0.547) > 14 (Pa: 0.526) > 16 (Pa: 0.515). It must be noted that in all three categories of biological activities mentioned here, the standard D1 exhibited probable activit (Pa) values that fall below the threshold of favorable outcomes (Pa < 0.5). This indicates that there was not enough data on the website regarding celecoxib as a potential treatment for analgesia or muscular dystrophy for comparison.
In silico molecular dynamics
Molecular dynamics (MD) simulations were performed to investigate the stability and behavior of COX-2 (PDB ID: 5F19) in complex with ligands 3 and 4. These ligands were chosen for detailed analysis based on prior docking results and pharmacokinetic profiling. Each protein-ligand complex underwent a 20-nanosecond simulation using GROMACS 2021.6 under physiological conditions.
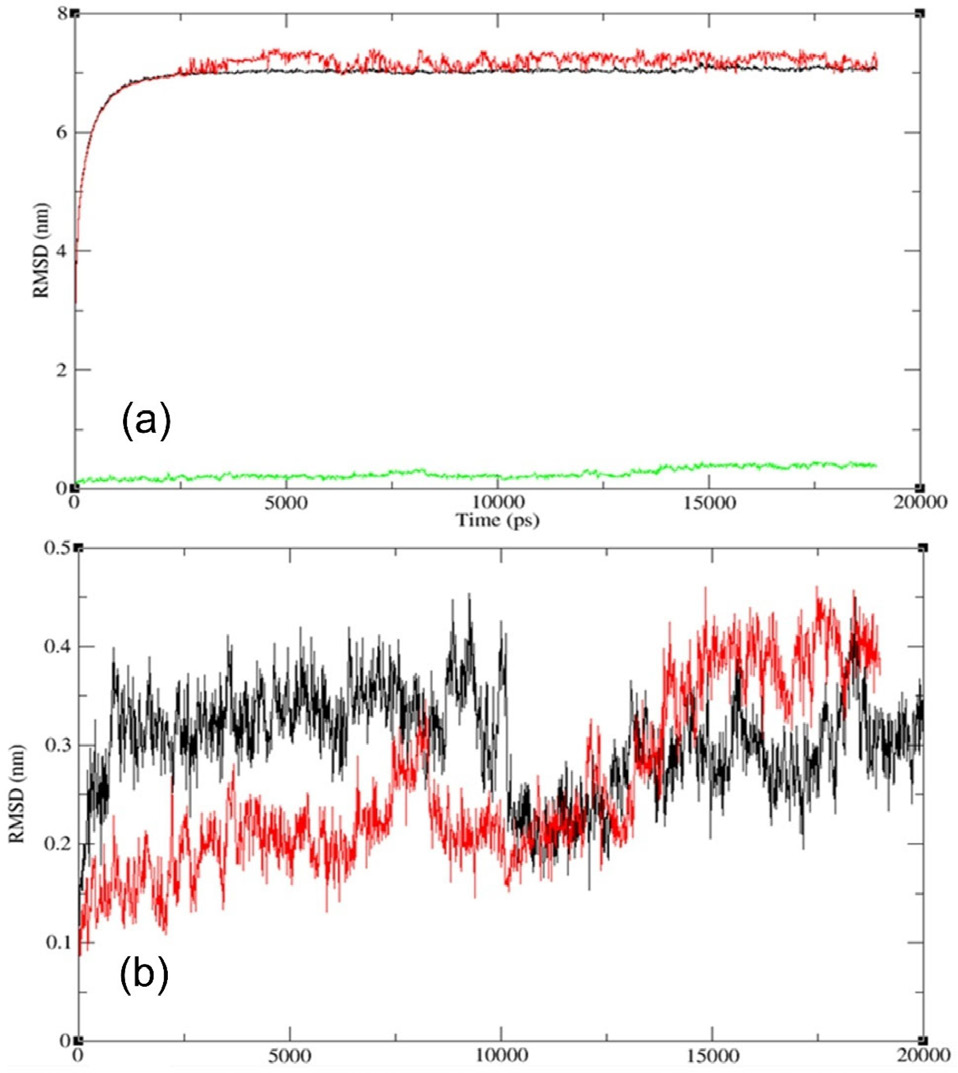
To assess structural stability, the root-mean-square deviation (RMSD) was calculated. As shown in Figure 7, both protein-ligand complexes quickly reached equilibrium and remained stable throughout the 20-nanosecond simulation. For the COX-2 structure (PDB ID: 5F19) bound to ligand 3, RMSD values for the protein, ligand, and surrounding water molecules ranged from 0.07 to 0.18 nm. Similar values were observed for the ligand 4 complex, ranging from 0.06 to 0.18 nm, indicating that both ligands remained stably bound within the COX-2 active site. Additional RMSD data are available in the SI section (Figures S14 and S15).
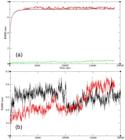
The RMSD evolution (a) red line: water ion, black line: ligand 3 (ligand), green line: 5F19 with ligand 4; (b) merged docked complex between two proteins-ligands during 20 ns MD simulation. black line: 5F19 with ligand 3, red line: 5F19 with ligand 4.
The RMSD graph of merged protein-ligand complexes is shown in Figure 7b, with 5F19-ligand 3 fluctuations shown in red and 5F19-ligand 4 fluctuations shown in black. The graph illustrates how the variations in both complexes differ over time. For instance, ligand 4 shows a significantly higher initial fluctuation, whereas ligand 3 shows a greater fluctuation after 10 ns. The graph shows an initial rapid increase in RMSD values over the first 0 1.0 ns (or up to 1000 ps) of the simulation. Towards the end of the 20 ns simulation, both the complexes become relatively stable at 0.4 nm for ligand 3 and 0.4 nm for ligand 4. The relative stability of these energy profiles after equilibration underscores the reliability of the results for subsequent MD simulations.
The protein-ligand complex exhibited a highly favorable negative binding affinity in the docking studies; therefore, the 5F19-ligand 3 complex was selected for further MD simulations, as shown in Figure 8. A 20 ns MD simulation was conducted to investigate the structural stability, conformational dynamics, and residue-level flexibility of the complex. Analyses included RMSD, root-mean-square fluctuation (RMSF), radius of gyration (Rg), hydrogen bonding, and principal component analysis (PCA), all performed at 300 K. To assess temperature-dependent effects, additional simulations were carried out at 305, 310, and 320 K, with PCA extended across these conditions to provide broader insight into the complex’s dynamic behavior.
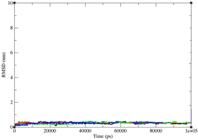
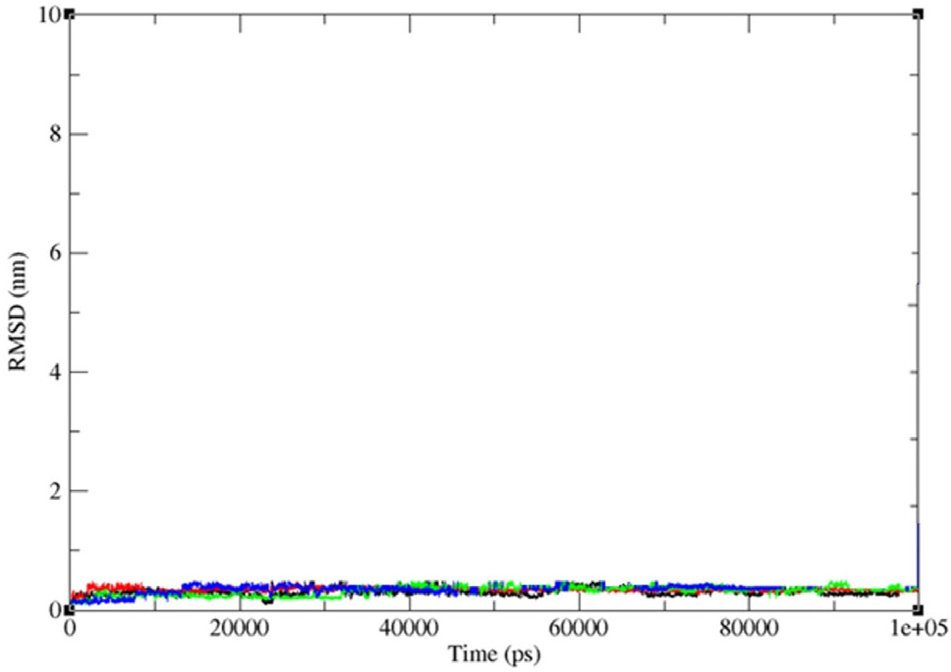
RMSD progression for protein (5F19)-ligand complex of ligand 3 at different temperatures (300 K: black line, 305 K: red line, 310 K: green line, 320 K: blue line) throughout the 20 ns MD simulation.
At 300 K, the RMSD values remained low and stable throughout the simulation, indicating high structural integrity of the 5F19-ligand 3 complex. The consistent RMSD profile supported the formation of a stable and well-maintained protein-ligand assembly, further reinforcing the favorable interaction observed in docking studies.
Temperature-dependent RMSD profiles for ligand 3 are presented in Figure 8. At 300 K, deviations ranged from 0.20 to 0.45 nm, while a slight increase in fluctuation was observed at 310 K (0.35-0.55 nm). At 320 K, RMSD values ranged from 0.30 to 0.40 nm, suggesting enhanced stability at physiological temperature. In contrast, the simulation at 305 K exhibited distinct behavior: RMSD values remained stable between 6.9 and 7.2 nm until 13 ns, then rose sharply to approximately 9.0 nm, followed by fluctuations before stabilizing toward the end of the trajectory. These deviations likely reflect conformational rearrangements induced by temperature variation.
Overall, the consistently low RMSD values at 320 K indicate that the 5F19-ligand 3 complex remains structurally stable under conditions approximating human body temperature, supporting its potential as a robust COX-2 inhibitor.
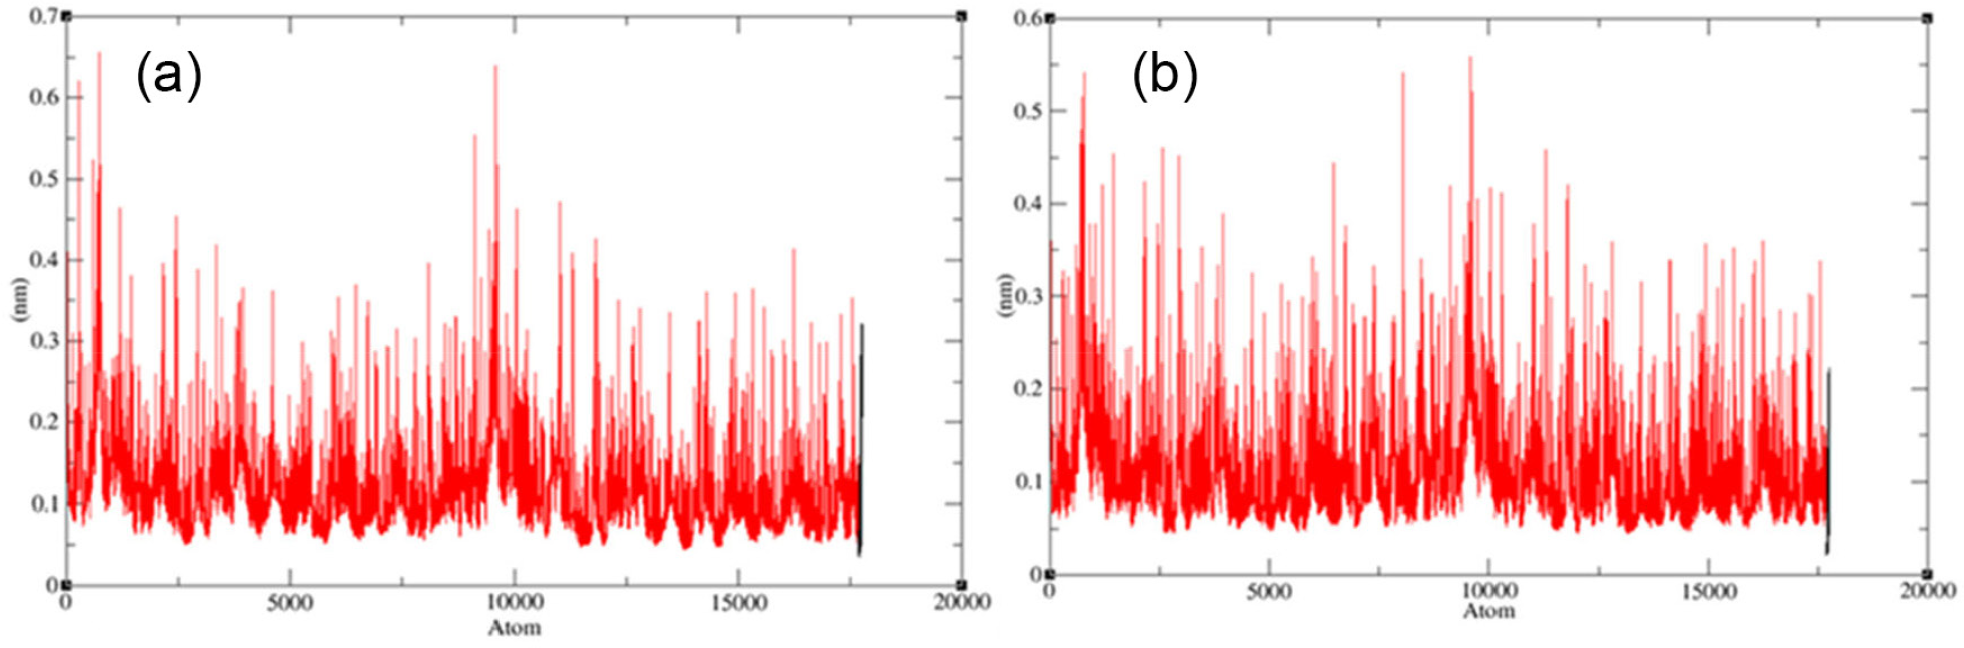
The thermodynamic stability of each COX-2 inhibitor complex was evaluated using RMSF analysis. This approach examined the positional fluctuations of CΑ atoms around their average positions for each residue, with higher RMSF values indicating greater flexibility and lower values reflecting increased structural rigidity. RMSF represents the average deviation of atoms from their mean positions over the simulation period and was calculated separately for both protein and ligand components. As shown in Figure 9, the RMSF profiles for the COX-2 (PDB: 5F19) complexes with ligands 3 and 4 demonstrate overall stability. Specifically, the complex containing ligand 3 exhibits an average RMSF of approximately 0.1 nm, with localized fluctuations observed around the 1500th residue (ca. 0.3 nm) and the 9000th residue (ca. 0.25 nm). These limited deviations suggest that both the protein and ligand maintain stable conformations throughout the simulation, with only minor atomic movements. However, localized increases in RMSF, particularly within ligand atoms, may be associated with functional interactions or conformational adjustments. Such fluctuations can arise from factors including ligand-binding dynamics, solvent exposure, and environmental conditions such as temperature and pH variations.
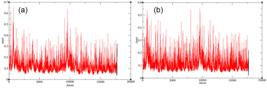
RMSF profiles for the docked complexes: (a) 5F19 bound to ligand 3, and (b) 5F19 bound to ligand 4.
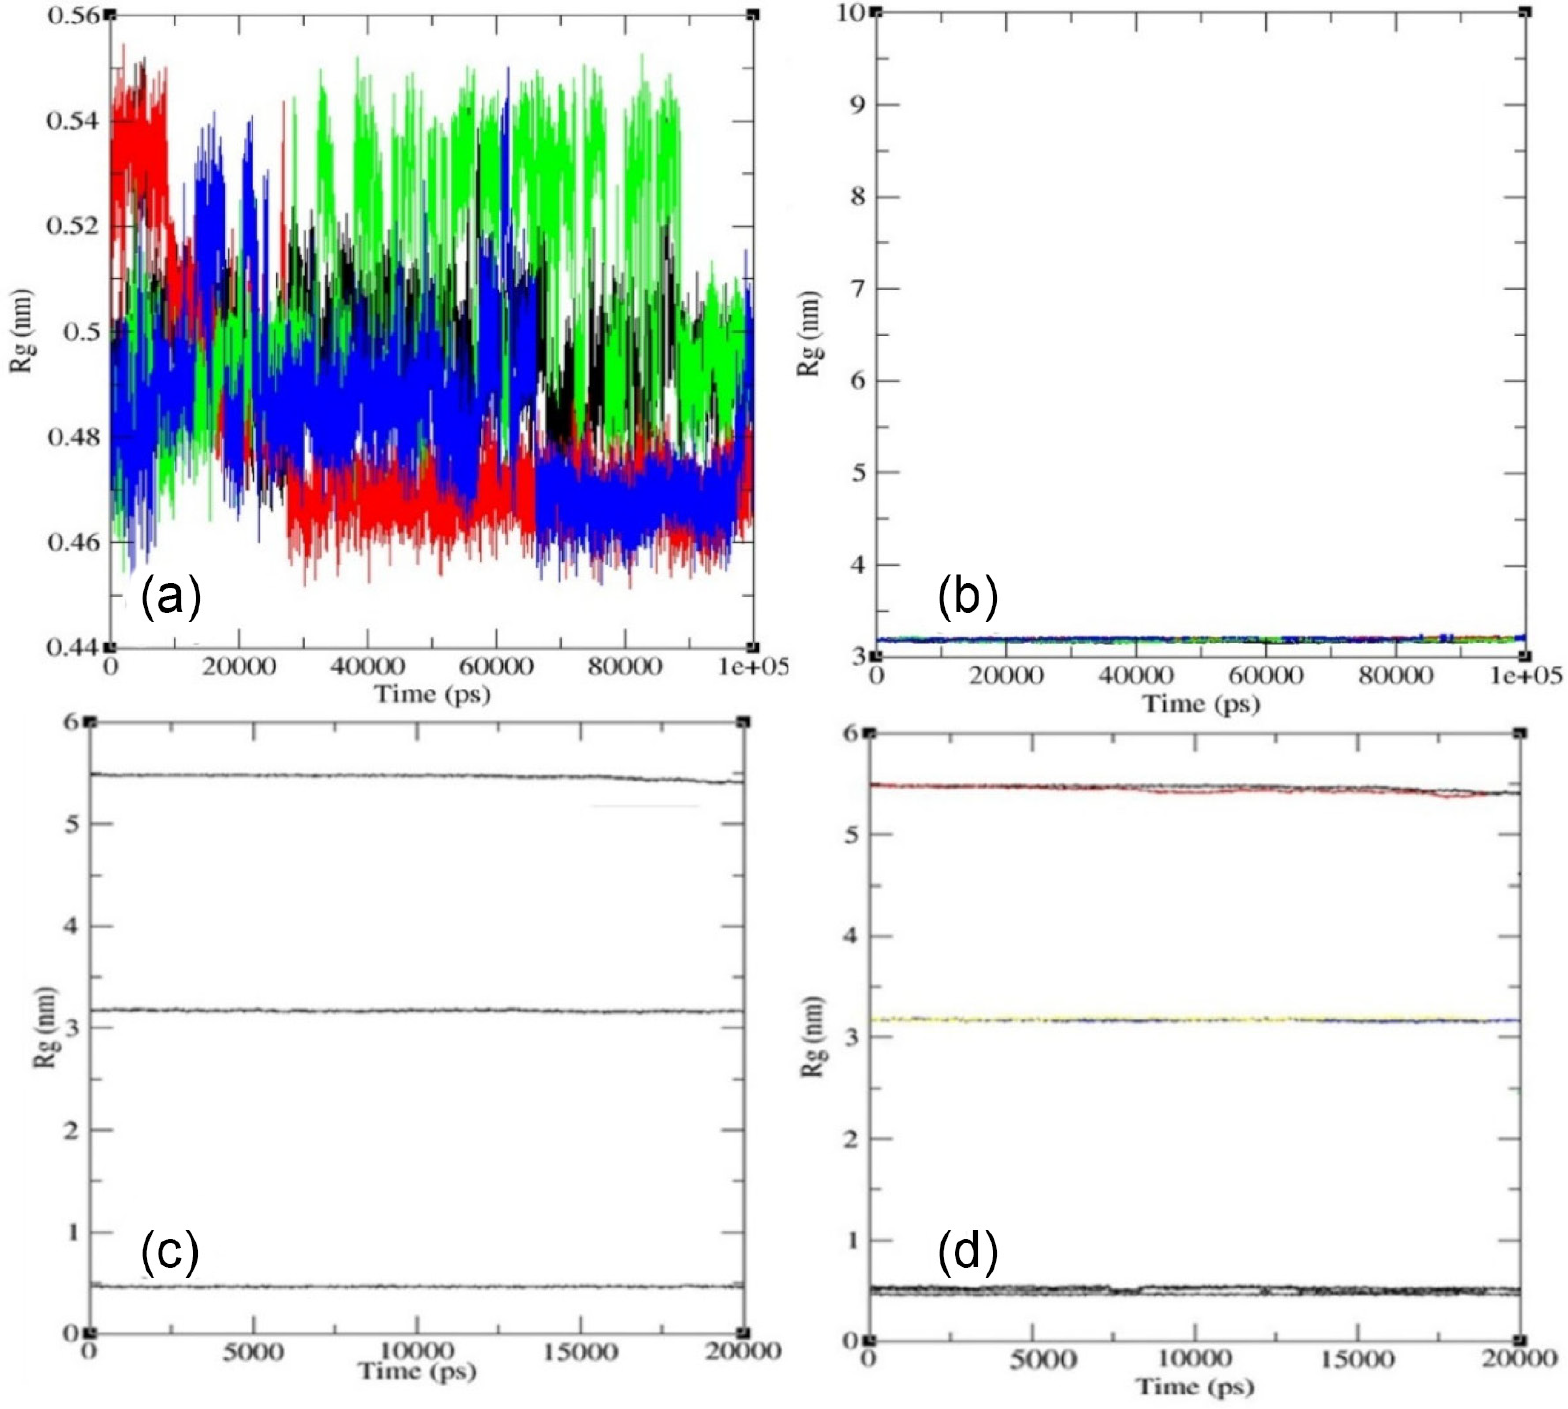
In molecular dynamics simulations, the Rg is used to track changes in the shape and compactness of the molecule over time or to compare the structures of various molecules. Rg values associated with ligand-protein complexes containing ligand 3 and PDB: 5F19 indicate an extended conformation, but Rg values related to the ligand alone indicate a more compact shape. The consistent range of radius of gyration values observed for ligand 3 across the various temperatures (300, 305, 310, and 320 K) indicates that the overall compactness or size of the ligand remains relatively stable throughout the simulation period at each temperature. The values ranging from 0.46 to 0.54 nm suggest that the ligand maintains a similar overall shape and conformation across the different temperature conditions tested (Figure 10a). This stability in the Rg values indicates that the ligand molecule maintains a consistent level of structural compactness across temperature variations. It suggests that the ligand’s molecular structure is relatively rigid and maintains its overall shape without significant expansion or contraction under the simulated conditions.
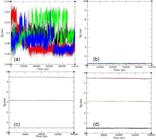
The plots for radius of gyration, Rg (nm) versus time (ps) of (a) only ligand 3 and (b) protein-ligand (ligand 3) complex at different temperatures such as 300, 305, 310 and 320 K; the water-ion (upper line), protein-ligand complex (middle line), and ligand (lower line), for (c) 5F19 with ligand 4 and for (d) merge docked complex between (a) and (b) during 20 ns MD simulation.
At temperatures of 300, 305, 310, and 320 K; the Rg value of the protein-ligand complex starts at 3.2 nm and remains stable at this value throughout the entire simulation period of 0 to 20 ns (Figure 10b). This consistent Rg value suggests that, regardless of temperature variations, the overall compactness or size of the protein-ligand complex remains unchanged over the course of the simulation. The stability of the Rg value implies that there are no significant conformational changes or alterations in the overall shape of the complex during the simulation at these temperatures. However, there is a sudden and substantial increase around 13 ns into the simulation in the Rg value at 305 K simulation, reaching a range of 6.7 to 6.9 nm (Figure 10b). This sudden increase suggests a significant expansion or alteration in the overall size or conformation of the protein-ligand complex. Following this increase, the Rg value fluctuates between 6.7 and 3.2 nm for the subsequent simulation period from 13 to 17 ns. This fluctuation indicates potential dynamic changes or structural rearrangements occurring within the complex. Subsequently, after 17 ns, the Rg value rises again to 6.9 nm and stabilizes at this value for the remainder of the simulation period, from 17 to 20 ns. These observations suggest that the protein-ligand complex undergoes significant conformational changes or fluctuations in size during the simulation. The initial stability followed by sudden increases and subsequent fluctuations in the Rg value indicate dynamic structural rearrangements within the complex, potentially influenced by interactions between the protein and the ligand or environmental factors. Overall, these results suggest that the protein-ligand complex maintains its structural integrity and stability under the simulated conditions at temperatures of 300, 310, and 320 K, with no observable changes in its overall size or compactness over time. Additionally, the Rg values for the ligand-protein combination generated by ligand 4 and PDB: 5F19 indicate the presence of a large and extended complex (Figure 10). The radius of gyration for the protein complex 5F19 with ligand 3 and ligand 4 is illustrated in Figures 10c and 10d, respectively. Additionally, Figure 10c provides the radius of gyration profiles for the merged complexes for ligands 3 and 4. Notably, both ligands have similar Rg values, which can be attributable to the fact that both complexes use the same protein PDB: 5F19. Therefore, this observed similarity in Rg values can imply comparable conformational changes and structural characteristics that these protein complexes have in common.
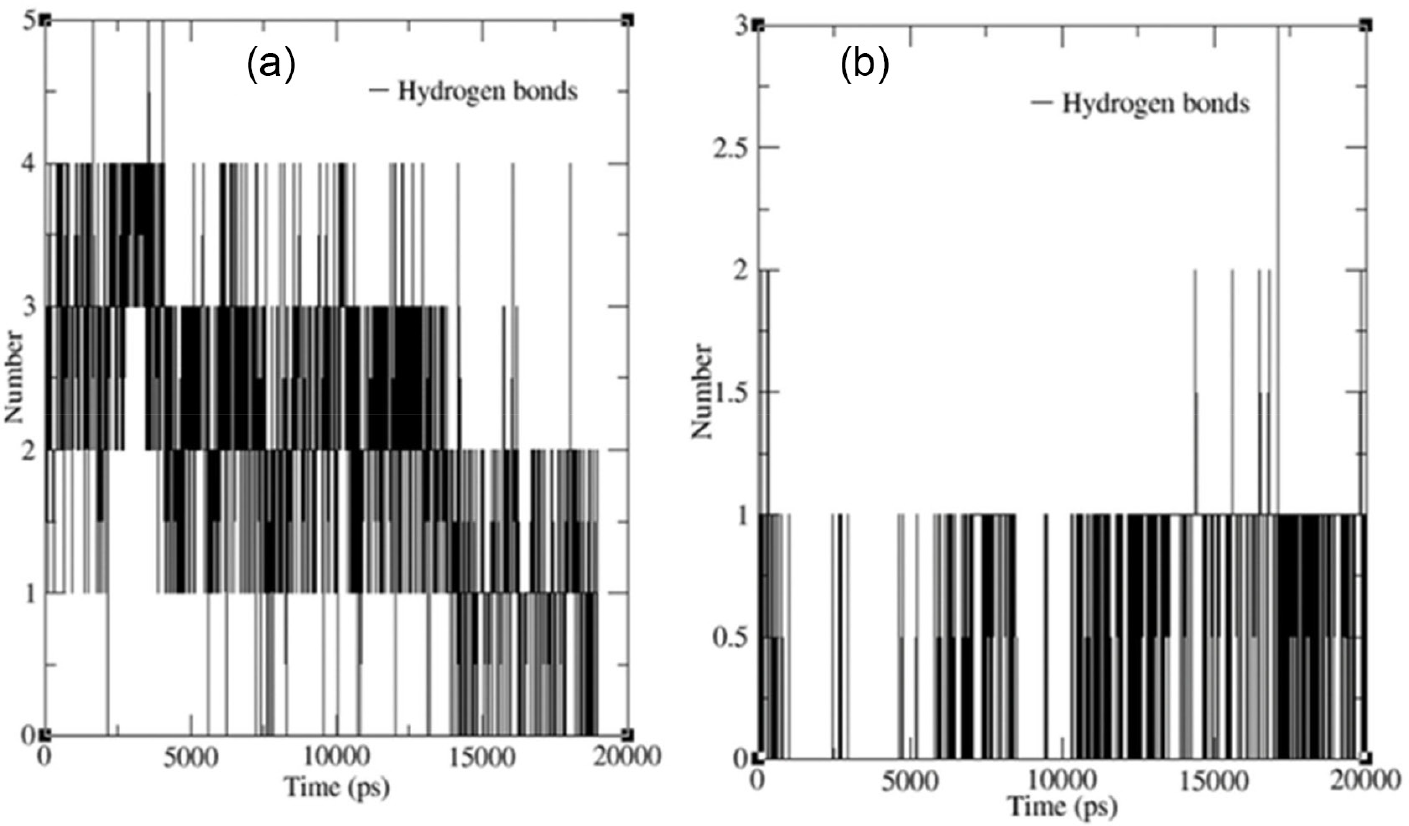
The number of hydrogen bonds established between (PDB: 5F19) and ligands 3 and 4 over the 20 ns simulation period ranged from 0 to 6. Due to this variety, it is possible that the ligand might adopt various conformations and binding strategies inside the protein-binding pocket, indicating that the interaction between the ligand and protein is dynamic. Both ligand 3 and ligand 4 can interact with the active regions of the protein, based on the formation of stable hydrogen bonds shown in Figure 11.
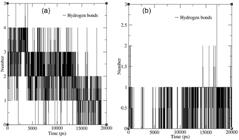
The number of hydrogen bond versus time (ps) plots for the hydrogen bond stabilization hydrogen bonding for (a) between protein complex of PDB: 5F19 and ligand 3 and (b) between protein complex of PDB: 5F19 and ligand 4 during 20 ns MD simulation.
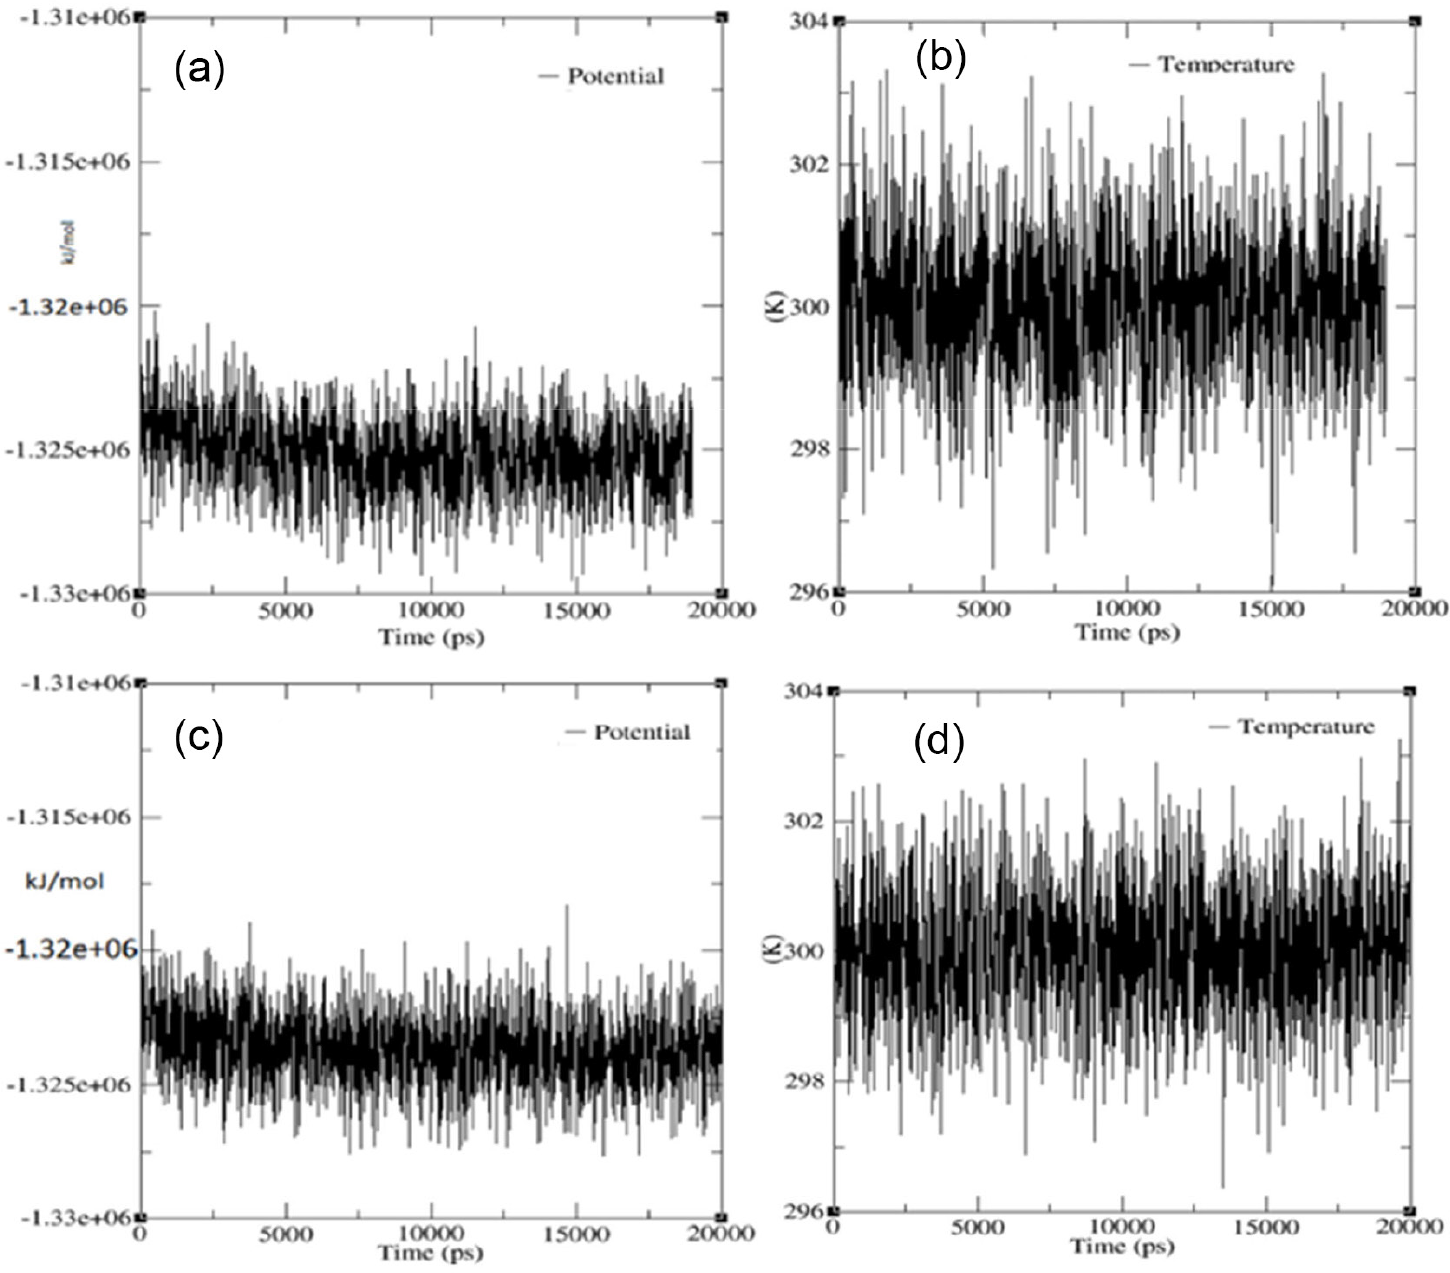
The temperature curves plotted in Figure 12 demonstrated stability, ranging from 296.0 to 303.5 K throughout the 20 ns simulation. This suggests that the system maintained consistent thermal energy, despite the presence of the protein-ligand complex. The potential energy of the system showed fluctuations ranging from -1.33 × 10⁻⁶ to -1.32 × 10⁻⁶ kJ mol -1, indicating changes in electrostatic interactions between atoms within the system (Figure 12). The simulations indicate that ligands 3 and 4 hold promise as COX-2 inhibitors (PDB: 5F19), as both exhibit robust interactions with COX-2. This discovery is encouraging, considering that selective COX-2 inhibition is linked to anti-inflammatory effects accompanied by reduced adverse effects. Thus, ligands 3 and 4 hold the potential to serve as selective non-steroidal anti-inflammatory agents. Nonetheless, additional empirical investigations are necessary to corroborate their effectiveness and safety as potential treatments for inflammation.
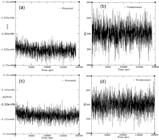
The temperature and potential energy curves over the course of the 20 ns MD simulation for (a) potential energy graph for the protein-ligand complex of PDB: 5F19 and ligand 3 and (b) temperature graph of the protein-ligand complex of PDB: 5F19 and ligand 3. (c) Potential energy graph for the protein-ligand complex of PDB: 5F19 and ligand 4. (d) Temperature graph of the protein-ligand complex of PDB: 5F19 and ligand 4.
Principal component analysis (PCA)
PCA in molecular dynamics simulation is a technique used to simplify and analyze the complex motion of atoms or molecules in a system.59 In molecular dynamics simulations, we can track the positions and velocities of atoms or molecules over time to understand their behavior and interactions. PCA can be applied to the atomic coordinates or molecular conformations obtained from the simulation trajectory. By performing PCA on the trajectory data, you can identify the dominant modes of motion or conformational changes in the system. This can provide insights into important structural changes, such as protein folding or ligand binding, and help understand the system’s underlying dynamics.
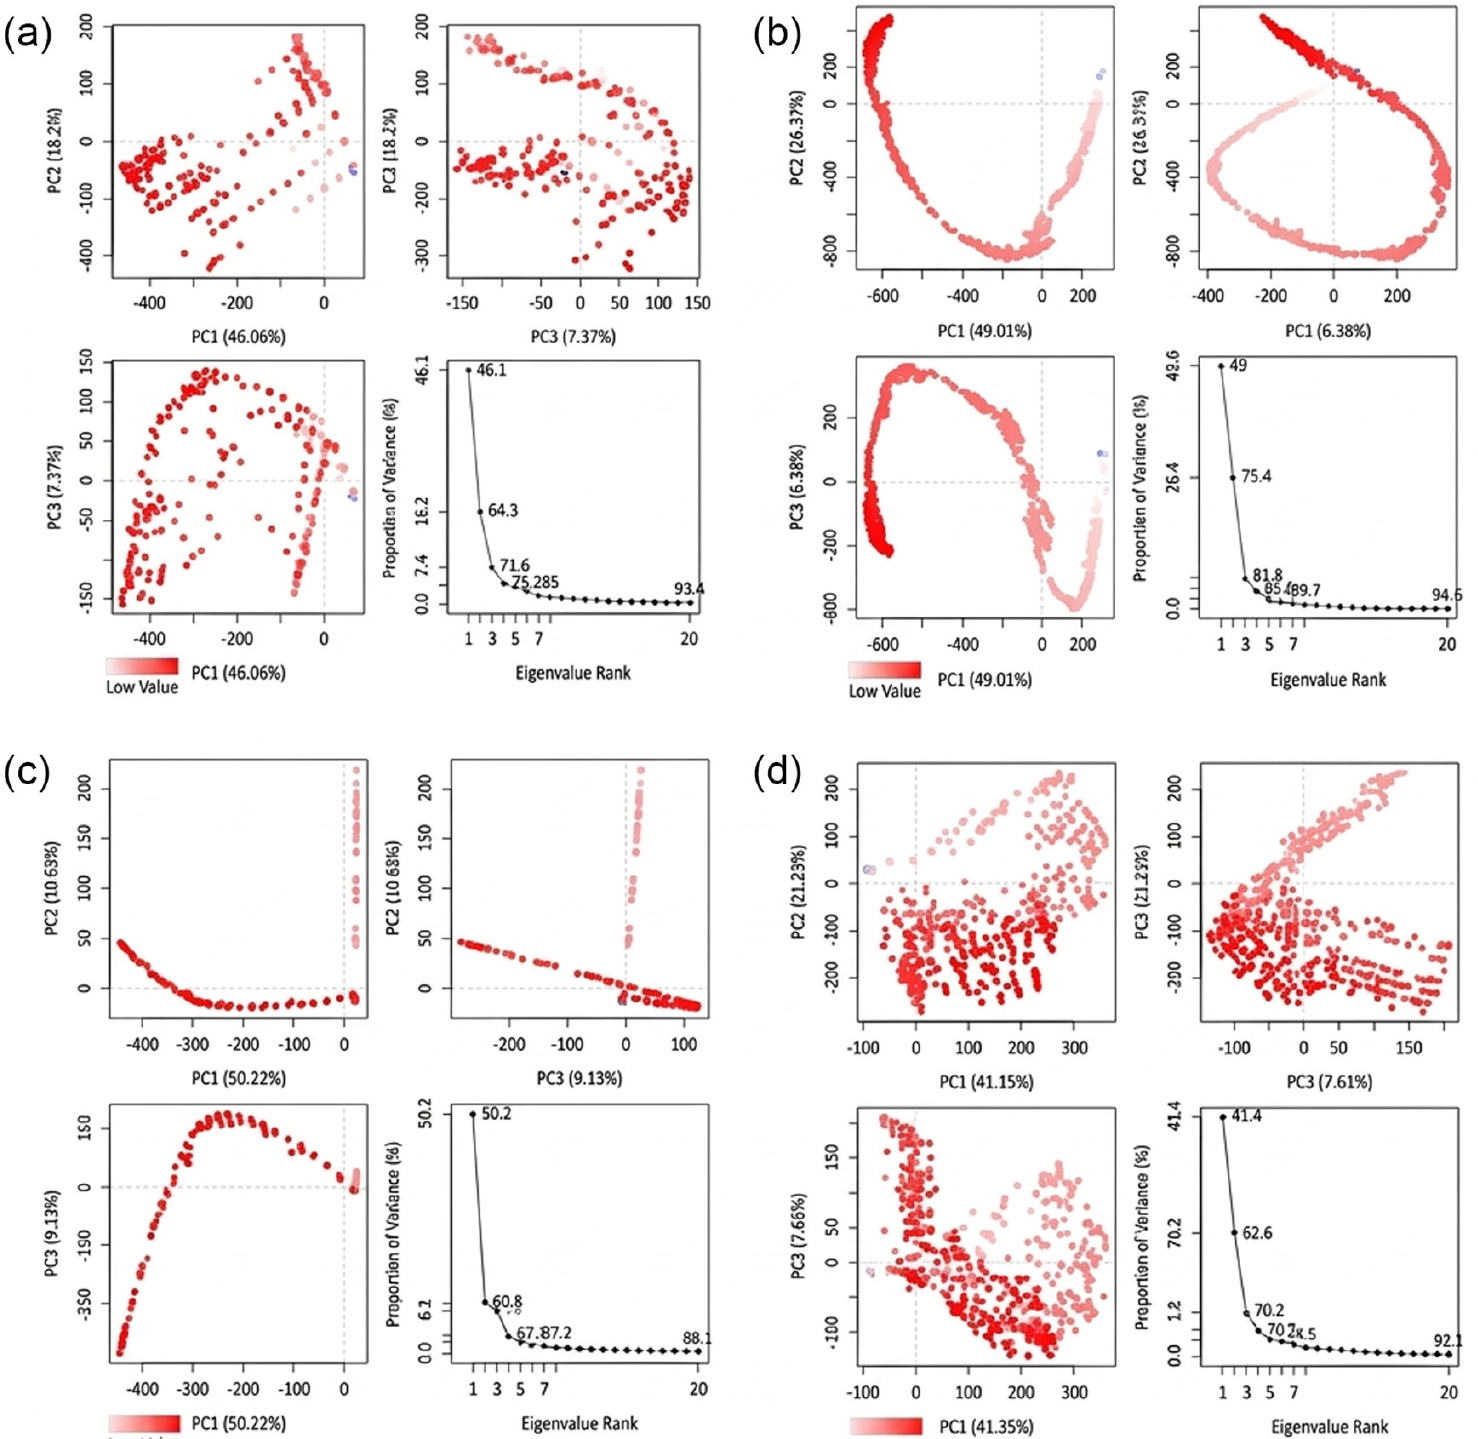
After conducting MD simulations of the COX-2 protein (PDB: 5F19) complexed with ligand 3 at various temperatures, a PCA was performed to evaluate the protein’s variance and conformational dynamics throughout the simulations. This analysis, performed on MD trajectories of the COX-2 protein-ligand complex at 300, 305, 310, and 320 K, was executed using the Bio3D package. PCA was employed to isolate the principal motion of the trajectory within a reduced-dimensional space and compare it across the first three principal components (PC1, PC2, and PC3). The variance captured by these principal components was represented by colored dots, with transitions from blue to white to red indicating the density of samples within the complex. At 300 K, the protein-ligand complex demonstrated the highest variability in PC1 (46.06%), followed by PC2 (18.2%), with PC3 contributing the least variability (7.37%), resulting in a cumulative variance of 64.3%. Conversely, the reference drug celecoxib exhibited lower variance, with PC1, PC2, and PC3 values of 25.36, 11.68, and 7.28%, respectively, resulting in a cumulative variation of 44.3%. Additionally, cosine content values calculated from the MD trajectories were 0.89 for ligand 3 and 0.75 for celecoxib (Figure 13).
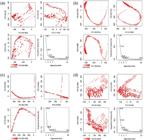
Principal Component Analysis (PCA) of MD Trajectories for the target protein (PDB: 5F19) and ligand 3 complex at (a) 300 K, (b) 305 K, (c) 310 K, and (d) 320 K (intermediate states are marked by white dots, energetically unstable conformations are represented by blue dots with scattering, and stable conformation states are denoted by red dots).
At 310 K, the protein-ligand complex (ligand 3) displayed the greatest variability in PC1 (50.22%) regarding the internal motions observed within the MD trajectory. PC2 captured a smaller proportion of variance (10.63%) compared to PC1, while subsequent PC3 calculations revealed minimal changes ranging from 6.38 to 9.13% across the temperature range. The PCA values for the temperature range indicated convergence in the simulation, with a range of 0 < H < 0.5. The results obtained at physiological body temperature (310 K) suggested a strong interaction between ligand 3 and the COX-2 protein, supported by both computational and experimental investigations. Nonetheless, further in vivo studies are warranted to validate the efficacy and safety of ligand 3 as a COX-2 protein inhibitor. Table 7 presents a summary of the primary motion observed in the complex (ligand 3-5F19) at different temperatures (Table 7) focusing on a smaller subset and comparing first three eigenvectors (PC1, PC2, and PC3). Overall, PCA in molecular dynamics simulation serves as a powerful tool for dimensionality reduction and analysis, enabling researchers to extract meaningful information from complex simulation data.
Variability in principal components (PC) revealed via PCA for the target protein (5F19) and ligand 3 complex at four temperatures
Conclusions
A group of 3-formyl chromone derivatives (1-20) were optimized in this study using the B3LYP/6 31G(d,p) approach. Additionally, an in silico investigation was conducted to evaluate the effectiveness of these derivatives (1-20) against the human COX-2 protein, which is involved in inflammation. To gain insight into their biological activity profiles, the study included DFT calculations, molecular docking, binding energy calculations, thermodynamic evaluations, analysis of HOMO and LUMO states, drug likeness evaluations, ADMET properties, and MD simulations. According to computational analysis, all twenty ligands showed favorable binding affinities as possible anti inflammation drugs, with ligands 3 and 4 standing out as the best candidates. These findings highlight the potential of the ligands as possible therapeutic entities, notably ligands 3 and 4.
Supplementary Information
Supplementary information (optimized structures, cartesian z matrix, biological activity, active site residues of proteins, molecular orbitals, docking poses, MD simulation evolutions) is available free of charge at http://jbcs.sbq.org.br as PDF file.
Supplementary PDF
Acknowledgments
The authors acknowledge the support of the Research Institute/Center Supporting Program (RICSP-26-1) at King Saud University, Riyadh, Saudi Arabia. Special thanks are extended to the Digital Research Alliance of Canada for providing access to computational resources. Additionally, we gratefully acknowledge the support from the NSU Conference & Travel Grant Committee (CTRGC).
Data Availability Statement
All data are available in the text.
References
-
1 Burkman, A.; Understanding Inflammation; Collaborative Natural Health Partners, 2024. [Link] accessed in March 2026
» Link -
2 Meizlish, M. L.; Franklin, R. A.; Zhou, X.; Medzhitov, R.; Annu. Rev. Immunol. 2021, 39, 557. [Crossref]
» Crossref -
3 Sharma, S.; Khanna, G.; Kaur, G.; Singh, I.; Future J. Pharm. Sci 2021, 7, 7. [Crossref]
» Crossref -
4 Szabo, T. M.; Frigy, A.; Nagy, E. E.; Int. J. Mol. Sci. 2021, 22, 13053. [Crossref]
» Crossref -
5 Widyadharma, I. P. E.; Sari, N. N. S. P.; Pradnyaswari, K. E.; Yuwana, K. T.; Adikarya, I. P. G. D.; Tertia, C.; Wijayanti, I. A. S.; Indrayani, I. A.; Utami, D. K. I.; Egypt. J. Neurol. Psychiatry Neurosurg. 2020, 56, 121. [Crossref]
» Crossref -
6 Ricciotti, E.; FitzGerald, G. A.; Arterioscler., Thromb., Vasc. Biol. 2011, 31, 986. [Crossref]
» Crossref -
7 Imig, D.; Clin. Sci. 2020, 134, 2707. [Crossref]
» Crossref -
8 Uppal, M. K.; Prostaglandins in Inflammation - A Review [Link] accessed in March 2026
» Link -
9 Palis, N.; Safitri, A.; Wijayanti, E. D.; Fatchiyah, F. J.; Biol. Res. 2023, 29, 57. [Crossref]
» Crossref -
10 Serhan, N.; Chiang, N.; Van Dyke, T. E.; Nat. Rev. Drug Discovery 2008, 8, 349. [Crossref]
» Crossref -
11 Medzhitov, R.; Nature 2008, 454, 428. [Crossref]
» Crossref -
12 Chaplin, D. D. J.; Allergy Clin. Immunol. 2010, 125, S3. [Crossref]
» Crossref -
13 Nathan, C.; Nat. Rev. Immunol. 2006, 6, 863. [Crossref]
» Crossref -
14 MacLeod, S.; Mansbridge, J.; Adv. Wound Care 2016, 5, 65. [Crossref]
» Crossref -
15 Fullerton, N.; Gilroy, D. W.; Nat. Rev. Immunol. 2020, 20, 66. [Crossref]
» Crossref -
16 Wang, L.; Ma, C.; Wipf, P.; Liu, H.; Su, W.; Xie, X.-Q.; AAPS J 2013, 15, 395. [Crossref]
» Crossref -
17 Kumar, R.; Singh, A. K.; Gupta, A.; Pandey, A. K. In Phytochemistry: An In-silico and In-vitro Update; Kumar, S.; Egbunap, C., eds.; Springer: Singapore, 2019, 479. [Crossref]
» Crossref -
18 Upadhyaya, S. R.; Bashyal, J.; Raut, B. K.; Parajuli, N.; Discover Chem. 2025, 2, 189. [Crossref]
» Crossref -
19 Eberini, I.; Daniele, S.; Parravicini, C.; Sensi, C.; Trincavelli, M. L.; Martini, C.; Abbracchio, M. P. J.; Comput.-Aided Mol. Des. 2011, 25, 743. [Crossref]
» Crossref -
20 Zhang, X.; Wu, F.; Yang, N.; Zhan, X.; Liao, J.; Mai, S.; Hua, Z.; Interdiscip. Sci.: Comput. Life Sci. 2022, 14, 285. [Crossref]
» Crossref -
21 Márquez, V.; Wilson, D. N.; Tate, W. P.; Triana-Alonso, F.; Nierhaus, K. H.; Cell 2004, 118, 45. [Crossref]
» Crossref -
22 Tak, P. P.; Firestein, G. S.; Immunol. Rev. 2000, 171, 161. [Crossref]
» Crossref -
23 GBD 2015 Risk Factors Collaborators; Lancet 2016, 388, 1659. [Crossref]
» Crossref -
24 Sehgal, S. A.; Hammad, M. A.; Tahir, R. A.; Akram, H. N.; Ahmad, F.; Curr. Neuropharmacol. 2018, 16, 649. [Crossref]
» Crossref -
25 Kolaczkowska, M.; Kubes, P.; Nat. Rev. Immunol 2013, 13, 159. [Crossref]
» Crossref -
26 Lavecchia, A.; Cerchia, C.; Drug Discovery Today 2016, 21, 288. [Crossref]
» Crossref -
27 Makhouri, F. R.; Ghasemi, J. B.; Curr. Neuropharmacol. 2018, 16, 664. [Crossref]
» Crossref -
28 Wynn, T.; Chawla, A.; Pollard, J.; Nature 2013, 496, 445. [Crossref]
» Crossref - 29 Frisch, M. J.; Trucks, G. W.; Schlegel, H. B.; Scuseria, G. E.; Robb, M. A.; Cheeseman, J. R.; Scalmani, G.; Barone, V.; Petersson, G. A.; Nakatsuji, H.; Li, X.; Caricato, M.; Marenich, A. V.; Bloino, J.; Janesko, B. G.; Gomperts, R.; Mennucci, B.; Hratchian, H. P.; Ortiz, J. V.; Izmaylov, A. F.; Sonnenberg, J. L.; Williams-Young, D.; Ding, F.; Lipparini, F.; Egidi, F.; Goings, J.; Peng, B.; Petrone, A.; Henderson, T.; Ranasinghe, D.; Zakrzewski, V. G.; Gao, J.; Rega, N.; Zheng, G.; Liang, W.; Hada, M.; Ehara, M.; Toyota, K.; Fukuda, R.; Hasegawa, J.; Ishida, M.; Nakajima, T.; Honda, Y.; Kitao, O.; Nakai, H.; Vreven, T.; Throssell, K.; Montgomery, J. A., Jr.; Peralta, J. E.; Ogliaro, F.; Bearpark, M. J.; Heyd, J. J.; Brothers, E. N.; Kudin, K. N.; Staroverov, V. N.; Keith, T. A.; Kobayashi, R.; Normand, J.; Raghavachari, K.; Rendell, A. P.; Burant, J. C.; Iyengar, S. S.; Tomasi, J.; Cossi, M.; Millam, J. M.; Klene, M.; Adamo, C.; Cammi, R.; Ochterski, J. W.; Martin, R. L.; Morokuma, K.; Farkas, O.; Foresman, J. B.; Fox, D. J.; Gaussian 16, Revision C.01, Gaussian, Inc.: Wallingford, CT, USA, 2016.
- 30 Dennington, R.; Keith, T.; Millam, J.; GaussView 6; Gaussian, Inc.: Wallingford, CT, USA, 2016.
-
31 Esha, N. J. I.; Quayum, S. T.; Saif, M. Z.; Almatarneh, M. H.; Rahman, S.; Alodhayb, A.; Poirier, R. A.; Uddin, K. M.; Int. J. Quant. Chem. 2024, 124, e27274. [Crossref]
» Crossref -
32 Quayum, S. T.; Esha, N. J. I.; Siraji, S.; Al Abbad, S. S.; Alsunaidi, Z. H. A.; Almatarneh, M. H.; Rahman, S.; Alodhayb, A. N.; Alibrahim, K. A.; Kawsar, S. M. A.; Uddin, K. M.; MethodsX 2024, 12, 102537. [Crossref]
» Crossref -
33 Kim, D. C.; Quang, T. H.; Tien, N. T.; Kim, K. W.; Kim, Y. C.; Ngan, N. T. T.; Oh, H.; Arch. Pharm. Res. 2022, 45, 90. [Crossref]
» Crossref -
34 LMMD ADMET-SAR2, version 2.0, 2018. [Link] accessed in March 2026
» Link -
35 SwissADME. [Link] accessed in March 2026
» Link - 36 ChemBioDraw Ultra 14; PerkinElmer Informatics: Waltham, MA, USA, 2013.
-
37 WAY2Drug PASS Online. [Link] accessed in March 2026
» Link -
38 AlphaFold Protein Structure Database. [Link] accessed in March 2026
» Link -
39 RCSB Protein Data Bank. [Link] accessed in March 2026
» Link - 40 Dallakyan, S.; Olson, A. J.; PyRx - Virtual Screening Tool, version 0.9.8; The Scripps Research Institute: La Jolla, CA, USA, 2015.
-
41 O’Boyle, N. M.; Banck, M.; James, C. A.; Morley, C.; Vandermeersch, T.; Hutchison, G. R.; J. Cheminf. 2011, 3, 33 [Crossref]; Open Babel. [Link] accessed in March 2026
» Crossref» Link -
42 SAVES Server. [Link] accessed in March 2026
» Link - 43 Sippl, M. J.; ProSaII, 1993. [Link] accessed in March 2026
-
44 UCSF Chimera. [Link] accessed in March 2026
» Link - 45 PyMOL Molecular Graphics System, version 2.5; Schrödinger, LLC: New York, NY, USA, 2021.
- 46 BIOVIA Discovery Studio 2021; Dassault Systèmes: San Diego, CA, USA, 2021.
- 47 Abraham, M. J.; Murtola, T.; Schulz, R.; Páll, S.; Smith, J. C.; Hess, B.; Lindahl, E.; GROMACS 2021.6; GROMACS Development Team: Utrecht, Netherlands, 2021.
-
48 Nair, C.; Miners, J. O.; In Silico Pharmacol 2014, 2, 4. [Crossref]
» Crossref -
49 Hornak, V.; Abel, R.; Okur, A.; Strockbine, B.; Roitberg, A.; Simmerling, C.; Proteins 2006, 65, 712. [Crossref]
» Crossref -
50 Bagley, M. C.; Dale, J. W.; Bower, J.; Chem. Commun 2002, 16, 1682. [Crossref]
» Crossref -
51 Galaxy Europe Server. [Link] accessed in March 2026
» Link -
52 Ladha, D. G.; Shah, N. K.; Ghelichkhah, Z.; Zarei, M. R. K.; Hatami, A. T.; Nabavi, N. A.; Hatami, A. M.; Al-Amiery, A. E.; Shariati, M. T.; Uddin, K. M.; Mater. Corros. 2018, 69, 125. [Crossref]
» Crossref -
53 Mehta, N.; Martin, J. M. L.; J. Phys. Chem. A 2023, 127, 2104. [Crossref]
» Crossref -
54 Uddin, M.; Alrawashdeh, A. I.; Henry, D. J.; Warburton, P. L.; Poirier, R. A.; Int. J. Quant. Chem. 2020, 120, e26059. [Crossref]
» Crossref -
55 Agu, P. C.; Afiukwa, C. A.; Orji, O. U.; Ezeh, E. M.; Ofoke, I. H.; Ogbu, C. O.; Ugwuja, E. I.; Aja, P. M.; Sci. Rep 2023, 13, 7. [Crossref]
» Crossref -
56 Arnittali, M.; Rissanou, A. N.; Harmandaris, V.; Procedia Comput. Sci. 2019, 156, 69. [Crossref]
» Crossref -
57 Kitao, A.; J 2022, 5, 298. [Crossref]
» Crossref -
58 Akritopoulou-Zanze, I.; Curr. Opin. Chem. Biol. 2008, 12, 324. [Crossref]
» Crossref -
59 Ingkaninan, K.; IJzerman, A. P.; Verpoorte, R.; J. Nat. Prod. 2000, 63, 315. [Crossref]
» Crossref
Edited by
-
Editor handled this article:
Paula Homem-de-Mello (Executive)