Untargeted Metabolomics of Dried Urine Spot Samples from Pompe Disease Patients
Abstract
Dried blood samples on filter paper have been used in newborn screening programs for decades and have recently gained attention as a practical alternative to traditional liquid matrices for untargeted metabolomics. This material provides benefits, such as long-term stability and cost-effective transportation, which are particularly valuable for rare disease studies. While dried blood spots are well-established in clinical and research settings, dried urine spots (DUS) remain largely unexplored for untargeted metabolomics, despite their potential as a noninvasive matrix for biomarker discovery. In this study, it was conducted an exploratory untargeted metabolomics investigation using liquid chromatography-high-resolution mass spectrometry (LC-HRMS) to analyze DUS samples from individuals with Pompe disease (PD). Using an integrated data analysis strategy that combined univariate testing with multivariate and machine learning methods, 29 metabolites that differed significantly (p < 0.05) between Pompe disease patients and controls were annotated. Of these, six have been previously reported in liquid urine, confirming that DUS is a reliable sampling method for biomarker detection and discovery. In conclusion, our results demonstrate that untargeted LC-HRMS analysis of DUS offers a reliable alternative for urine studies, highlighting specific metabolic changes in Pompe disease and supporting its application in research on rare disorders.
Keywords:
dried urine spots; metabolomics; LC-HRMS; Pompe; rare diseases
Introduction
Metabolomics is an interdisciplinary field that aims to systematically detect and quantify metabolites in complex biological matrices, including cells, tissues, and biological fluids.1,2 Its applications include biomarker identification, development of novel pharmacological agents, assessment of nutritional status and dietary patterns, investigation of environmental exposures, and personalized medicine.3-5
Recently, metabolomics has advanced the field of inherited metabolic disorders, contributing to the discovery of biomarkers for diagnosis, prognosis, monitoring treatment responses, and a better understanding of alterations in metabolic pathways.6,7 The most frequently used biological matrices in these studies are blood, urine, and feces.6 However, when involving newborns, card samples prepared by collecting blood on filter paper are widely used because they require less blood for collection and analysis, and they also offer stable storage and easier shipping.8,9
Originally used for neonatal screening, the dried blood spot (DBS) technique has been expanded to various clinical and research uses.9-11 Recent advances in tandem and high-resolution mass spectrometry have enabled high-throughput, sensitive, and multiplexed detection of metabolites from dried spots. From an analytical chemistry perspective, the dried-spot format can reduce matrix complexity and improve metabolite stability, making it particularly attractive for untargeted metabolomics.12,13
Although DBS has been widely used in metabolomics,14-19 similar approaches using dried urine spots (DUS) on filter paper have primarily been applied to targeted clinical screening rather than to untargeted metabolomics. This method offers the same practical benefits as DBS, such as easy handling and storage, but with the added advantage of being non-invasive.
DUS has previously been used for urine screening for various inherited disorders, such as Gaucher disease,20,21 mucopolysaccharidoses,22,23 Fabry disease,24 triple H syndrome,25 ornithine transcarbamylase deficiency,25 Pompe disease,26 and others.26,27
Recently, our group has developed and validated a simple methodology using liquid chromatography coupled to high-resolution mass spectrometry (LC-HRMS) for the direct measurement of urinary glucose tetrasaccharide (Glc4), a biomarker of Pompe disease, in both dried28 and liquid urine29 from Pompe patients.
Pompe disease (PD) is a rare inherited disorder (total incidence estimated at 1:40,000 live births) characterized by the intralysosomal accumulation of glycogen caused by a deficiency of α-glucosidase acid enzyme (GAA), which catalyzes the α-1,4- and α-1,6 linkages of lysosomal glycogen.30-32 Although this enzyme deficiency can occur in all cell types, it primarily occurs in the cardiac and skeletal muscle cells of Pompe patients.31 Glycogen accumulation disrupts cellular architecture, leading to progressive tissue damage.33
Using liquid urine, our method for measuring Glc4 integrated an untargeted analysis in the same sample run to discriminate between controls and Pompe patients, which revealed a panel of metabolites significantly altered in Pompe disease.29 For the DUS-based methodology, our results demonstrated a good relationship in Glc4 levels between dried and liquid urine samples, as assessed by Bland-Altman analysis, and high stability of metabolites present in DUS.28 However, it remained unclear whether an untargeted metabolomics analysis of DUS could uncover novel biomarkers or confirm previous findings in Pompe disease. Thus, the aim of this study was to evaluate the feasibility of DUS for untargeted LC-HRMS-based metabolomics and to investigate metabolic alterations associated with Pompe disease.
Experimental
Materials and reagents
Whatman® 903 filter paper, acarbose (internal standard), creatine, taurine, phenylacetylglycine, and glucose tetrasaccharide (Glc4) were obtained from Sigma Aldrich (São Paulo, Brazil). Plastic boxes for sample processing and storage (width 2.5 cm × 5.0 cm) were purchased from Dental Cremer (São Paulo, Brazil). Ammonium hydroxide (NH4OH), methanol (MeOH), and acetonitrile (ACN) were purchased from Tedia (Fairfield, USA). All organic solvents were of high-performance liquid chromatography (HPLC)/spectrophotometric grade. Ultrapure water (resistivity of 18.2 MΩ cm) was obtained from a Millipore Milli-Q purification system (Billerica, MA, USA).
Collection and extraction of urine samples
Fifty urine samples were used in this study. Twenty-five were from the control group with no history of metabolic diseases (13 males and 12 females), and 25 samples were from 11 Pompe patients (7 males and 4 females), including samples collected from patients at different time-points during enzyme replacement therapy (ERT). The limited number of patient samples reflects the rarity of the disease. Among the Pompe patients, 12 samples were from patients with earlyor infantile-onset (IOPD) presentation and 13 from late-onset (LOPD), both treated with or without ERT. These samples correspond to the same set of specimens previously described in our targeted Glc4 studies,28 but have now been evaluated using untargeted metabolomics.
Remnant specimens were obtained from the Laboratory of Inborn Errors of Metabolism (LABEIM-LADETEC (IQ-UFRJ, Brazil)) after routine screening or monitoring of patients. All samples were coded and stored at -20 °C until analysis. This study was approved by the Institutional Ethics Committee of the Clementino Fraga Filho University Hospital (HUCFF (UFRJ, Brazil), No. 3120923).
Samples were prepared as previously described.28 Briefly, 1 mL of each urine sample was collected using a filter paper kit and evaporated to dryness at room temperature for 24 h, followed by extraction with 3 mL of ACN:H2O (1:1, v/v) containing 0.1% NH4OH by vortexing at 500 rpm for 15 min. An aliquot of 2 mL of the supernatant was transferred to an Eppendorf tube and incubated at 4 °C for 30 min. Then, the samples were centrifuged for 15 min at 9000 rpm, and 1 mL of the resulting supernatant was collected, transferred to another Eppendorf tube, and stored at -20 °C until analysis. For LC-HRMS analysis, 120 µL of the sample extract were diluted in 470 µL of 0.1% NH4OH solution in water (1:1, v/v) containing 10 µL of a 120 mg mL-1 internal standard working solution of acarbose.
A pooled quality control (QC) sample was prepared by combining 10 μL aliquots from each individual sample extract. This QC sample was injected three times before randomized sample injection for column conditioning and subsequently every eight samples and at the end of the sequence to evaluate the stability and performance of the analytical system.34,35
Instrumental analysis
Analyses were performed on a Dionex UltiMate 3000 ultra-high performance liquid chromatography (UHPLC) system coupled to a Q Exactive™ Plus Hybrid Quadrupole-Orbitrap™ mass spectrometer equipped with an electrospray ionization source (ESI). The analytical parameters were determined based on our previous work.28,29 Chromatographic separation was achieved using a Waters Xbridge Amide (150 mm × 4.6 mm, 3.5 μm) column at 45 °C. The mobile phases consisted of (A) water: acetonitrile (95:5, v/v), and (B) acetonitrile: water (95:5, v/v), both containing 0.1% ammonium hydroxide. The injection volume was 8 μL, the flow rate was 0.4 mL min-1, and the elution gradient was as follows: 0 to 2 min, 99% B; 2 to 15 min, 99 to 50% B; 15 to 20 min, 50% B; 20 to 21 min, 50 to 99% B; 21 to 28 min, 99% B. The mass spectrometer was operated in negative ion mode (ESI(-)), with source ionization parameters set as follows: spray voltage at -3.1 kV; capillary temperature at 320 °C; S-Lens RF level at 60; and sheath and auxiliary gas flow rates at 45 and 15 (arbitrary units), respectively. Samples were analyzed over the m/z range 100-1000, followed by sequential tandem mass spectrometry (MS/MS) acquisition using data-dependent acquisition (DDA). Full-scan resolution was set to 35,000 (full width at half-maximum, FWHM), with an automatic gain control (AGC) target of 1 × 10⁶ and a maximum injection time (IT) of 150 ms. Data-dependent acquisition (ddMS2, top 3 scan mode) was performed at a resolution of 17,500 FWHM, with an AGC target of 1 × 10⁵ and a maximum IT of 60 ms. The loop count was 3, normalized collision energy (NCE) was 25, and the isolation window was 1.5 Da.
Untargeted data processing and metabolite annotation
Raw LC-MS data were exported to MS-DIAL software (version 4.9, developed by RIKEN Center for Sustainable Resource Science, Japan)36 for preprocessing (peak detection, spectral deconvolution, and alignment) and metabolite annotation. The parameters were MS1 and MS2 tolerances of 0.005 and 0.05 Da, respectively; minimum peak height of 5.0 × 10⁵; mass slice width of 0.05 Da; sigma window value for deconvolution of 0.4; 0.1 min and 0.005 Da tolerance for peak alignment. A pooled QC sample, injected halfway through the analytical sequence, served as the reference file for peak alignment. Features from the mobile phase were excluded based on signals detected in the blank sample.
Putative metabolite annotation was performed by comparing fragmentation spectra with the MassBank of North America (public) and NIST Tandem Mass Spectral Library 2020 spectral libraries, considering a similarity score higher than 80% and an error between experimental and theoretical m/z values of ± 5 ppm. Molecular features not directly annotated were investigated using alternative databases, such as Human Metabolome Database (HMDB),37 PubChem,38 METLIN Metabolomics Spectral Library,39 and KEGG Compound Database.40 A mass tolerance of 10 ppm was used for peak matching. At least three fragments were considered for ranking metabolite candidates. Additionally, the molecular formulas and chemical classes were characterized using the MS-FINDER platform (version 3.44, developed by RIKEN Center for Sustainable Resource Science (CSRS), Japan).41 Identification level 1 was determined by comparing the m/z values of precursor ions, fragmentation spectra, and retention times with analytical standards according to the Metabolomics Standards Initiative (MSI).42 Biological interpretation of annotated metabolites was performed according to the literature and HMDB database information.
Statistical analysis
The aligned data table from MS-DIAL platform was converted to a .csv file and uploaded to the MetaboAnalyst platform (version 5.0, McGill University, Canada)43 to perform univariate and multivariate analyses. Poor-quality data, with a coefficient of variation (CV) higher than 30% based on the pooled QC injections, were removed from the original table.44 Features were normalized to sample creatinine followed by a cube root transformation and range scaling. The resulting data were subjected to principal component analysis (PCA), which was used as an exploratory analysis to evaluate the overall data structure and batch effects, identify potential outliers, and to partial least squares-discriminant analysis (PLS DA) for sample classification and feature selection. The PLS DA model was cross-validated by calculating R2 (model fit) and Q2 (model predictive ability). Features with variable importance on projection (VIP) scores > 1 were considered significant for this study.45 Data normality was evaluated for each feature using the Shapiro-Wilk test. Based on the data distribution, the non-parametric Mann-Whitney test was applied in R software (version 4.4.3, R Foundation for Statistical Computing, Vienna, Austria)46 to assess significant differences between groups (p < 0.05), without false discovery rate (FDR) adjustment. Random forest (RF) algorithm classification was performed on the previous dataset using 2000 decision trees. 70% of the samples were used to build the predictive model, and the remaining 30% were used as test samples to estimate the classification error (known as out-of-bag (OOB) error). All features ranked by mean decrease in prediction accuracy were considered significant. Thus, the selected discriminant features identified by both supervised methods (PLS DA + RF algorithm) were confirmed using a volcano plot with the following parameters: p-value < 0.05 and fold change (FC) of 2.0. Further investigation of the selected features was conducted using a heatmap, where possible grouping and patterns were evaluated. The performance of the selected variables from PLS-DA and RF was evaluated using a univariate receiver operating characteristic (ROC) curve. An ROC curve for each discriminant feature was constructed by plotting the true positive rate against the false positive rate at different cut-off points. The area under the curve (AUC) was used to assess the utility of each variable. Features with AUC < 0.7 were discarded. Finally, the features with AUC > 0.7 were used to build a multivariate exploratory ROC curve model using RF as the classification method to evaluate the predictive ability of the model. The model performance was verified using a permutation test (n = 1000) to assess the predictive accuracy of a set of biomarkers.
Results and Discussion
PCA exploratory analysis and quality control assessment
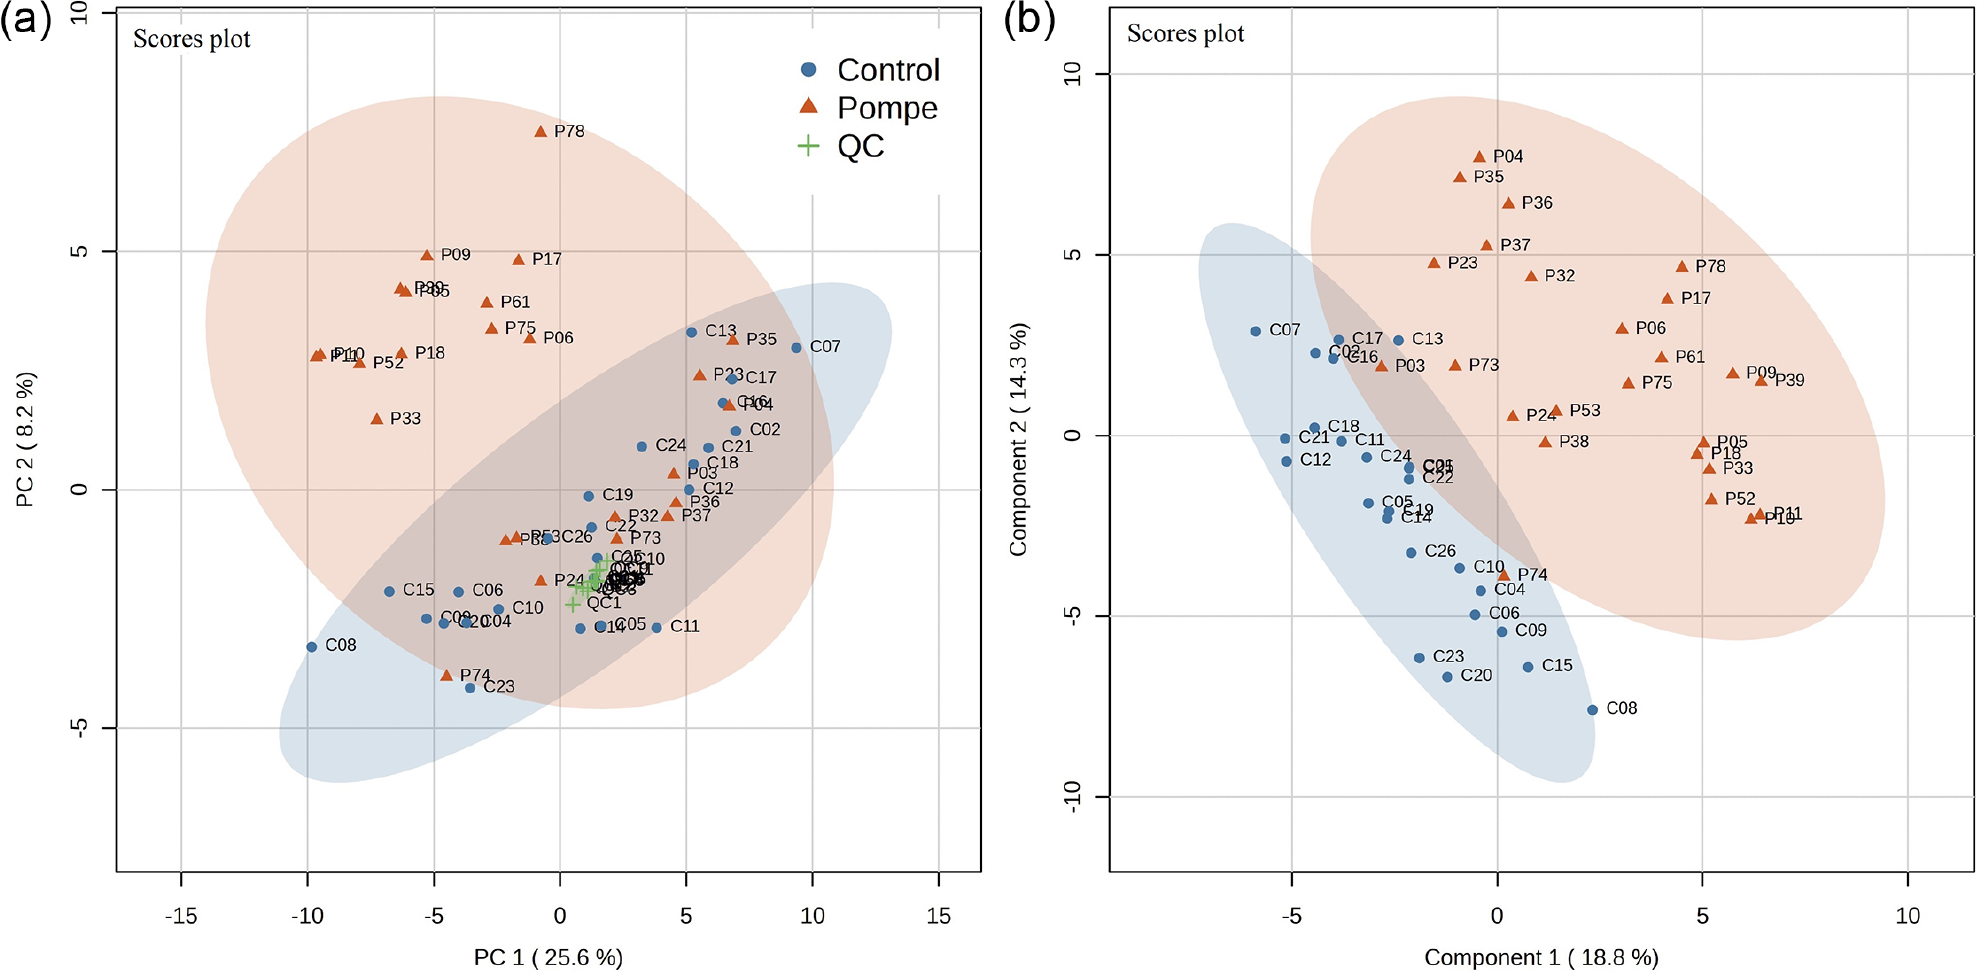
The unsupervised PCA multivariate method was initially used to explore the dataset (Figure 1a). No outlier samples were observed outside the 95% confidence region, and the pooled QC samples were tightly clustered near the center of the PCA plot, indicating the stability of the analytical system throughout the 30-hour batch injection. This stability was also evaluated using a control chart of the first principal component (PC1) versus injection order (Figure S1 in the Supplementary Information (SI) section), in which no trends was observed for the pooled QC samples. This shows that sample variability is due to biological differences rather than poor analytical system performance.
(a) Principal component analysis (PCA) and (b) partial least-squares discriminant analysis (PLS-DA) score plots for LC-HRMS data. Control samples (n = 25) are shown in blue circles, Pompe samples (n = 25) in brown triangles, and pooled quality control (QC) samples (n = 12) in green plus signs.
The Pompe group was not entirely separate from the control group. However, a trend toward separation was observed for PC1, with some samples (P03, P04, P23, P24, P32, P35, P36, P37, P38, P53, P73, and P74) overlapping between the two groups. These overlapping samples come from individuals receiving enzyme replacement therapy (ERT) or from patients with LOPD, a milder form of the condition compared to IOPD. The separation profile of urine samples spotted on filter paper closely resembles that observed in our previous findings using liquid urine,29 suggesting that the sample collection method has not significantly altered the metabolic profile of samples. Table S1 (SI section) summarizes details on Pompe disease patients and controls, including treatment (ERT), phenotype, sex, and urine Glc4 levels.
Combined use of supervised algorithms for sample classification and feature selection
PLS-DA analysis was applied to model the separation between the Pompe and control groups, as shown in Figure 1b. The resulting score plots clearly differentiate the two groups. Cross-validation indicated that three components were sufficient to build the PLS-DA model, which achieved Q2 = 0.54 (prediction) and R2 = 0.69 (goodness-of-fit), demonstrating good reliability.47 All annotated metabolites with variable importance in projection (VIP) > 1 and p-value < 0.05 were considered for further biomarker investigation (Table 1).
In addition to the PLS-DA analysis, the random forest (RF) supervised method was used for classification and variable selection to identify and/or confirm the features most influencing the separation between the groups. RF is a highly accurate classifier, capable of handling large datasets, and is robust to overfitting and outliers.48 The dataset was split into two groups: the RF algorithm used 70% of the sample set as a bootstrap sample and 30% as a test sample to estimate the OOB error. Figure S2 (SI section) shows the random forest model, which provided a class prediction accuracy of 0.85 with an overall OOB error of 0.15, correctly classifying 88% of the controls and 81% of the Pompe samples. Similar to the PLS-DA workflow, all annotated metabolites were selected and statistically evaluated according to previously described criteria (Table 1). A tentative identification of these molecular features was carried out by comparing the accurate mass of the precursor ions and MS/MS spectra with spectral libraries or analytical standards. Representative MS/MS spectra are shown in Figure S3 (SI section). Overall, the combined use of PLS-DA and RF identified 29 metabolites with statistically significant differences (p < 0.05) compared to the control group, as summarized in Table 1 and Figure S4 (SI section).
The 29 annotated metabolites were classified into amino acids and derivatives (9), aromatic derivatives (3), fatty acids and lipid derivatives (3), nitrogenous bases, nucleosides, and nucleotide derivatives (6), organic acids (4), pyrimidine derivatives (1), sugar and derivatives (3), as summarized in Figure S5 (SI section) and Table 1. These results suggest that cellulose-based filter paper constitutes a chemically competent matrix capable of retaining and stabilizing urine metabolites spanning a wide range of functional groups.
All annotated metabolites were subsequently selected for further analysis. Univariate ROC curve analysis was performed, and the AUC, specificity, sensitivity, and confidence interval values were summarized in Table S2 (SI section). The AUC values ranged from 0.705 to 0.878, while sensitivity and specificity ranged from 0.600 to 0.900, suggesting that the selected metabolites can reliably distinguish Pompe patients from controls and may serve as candidate biomarkers.
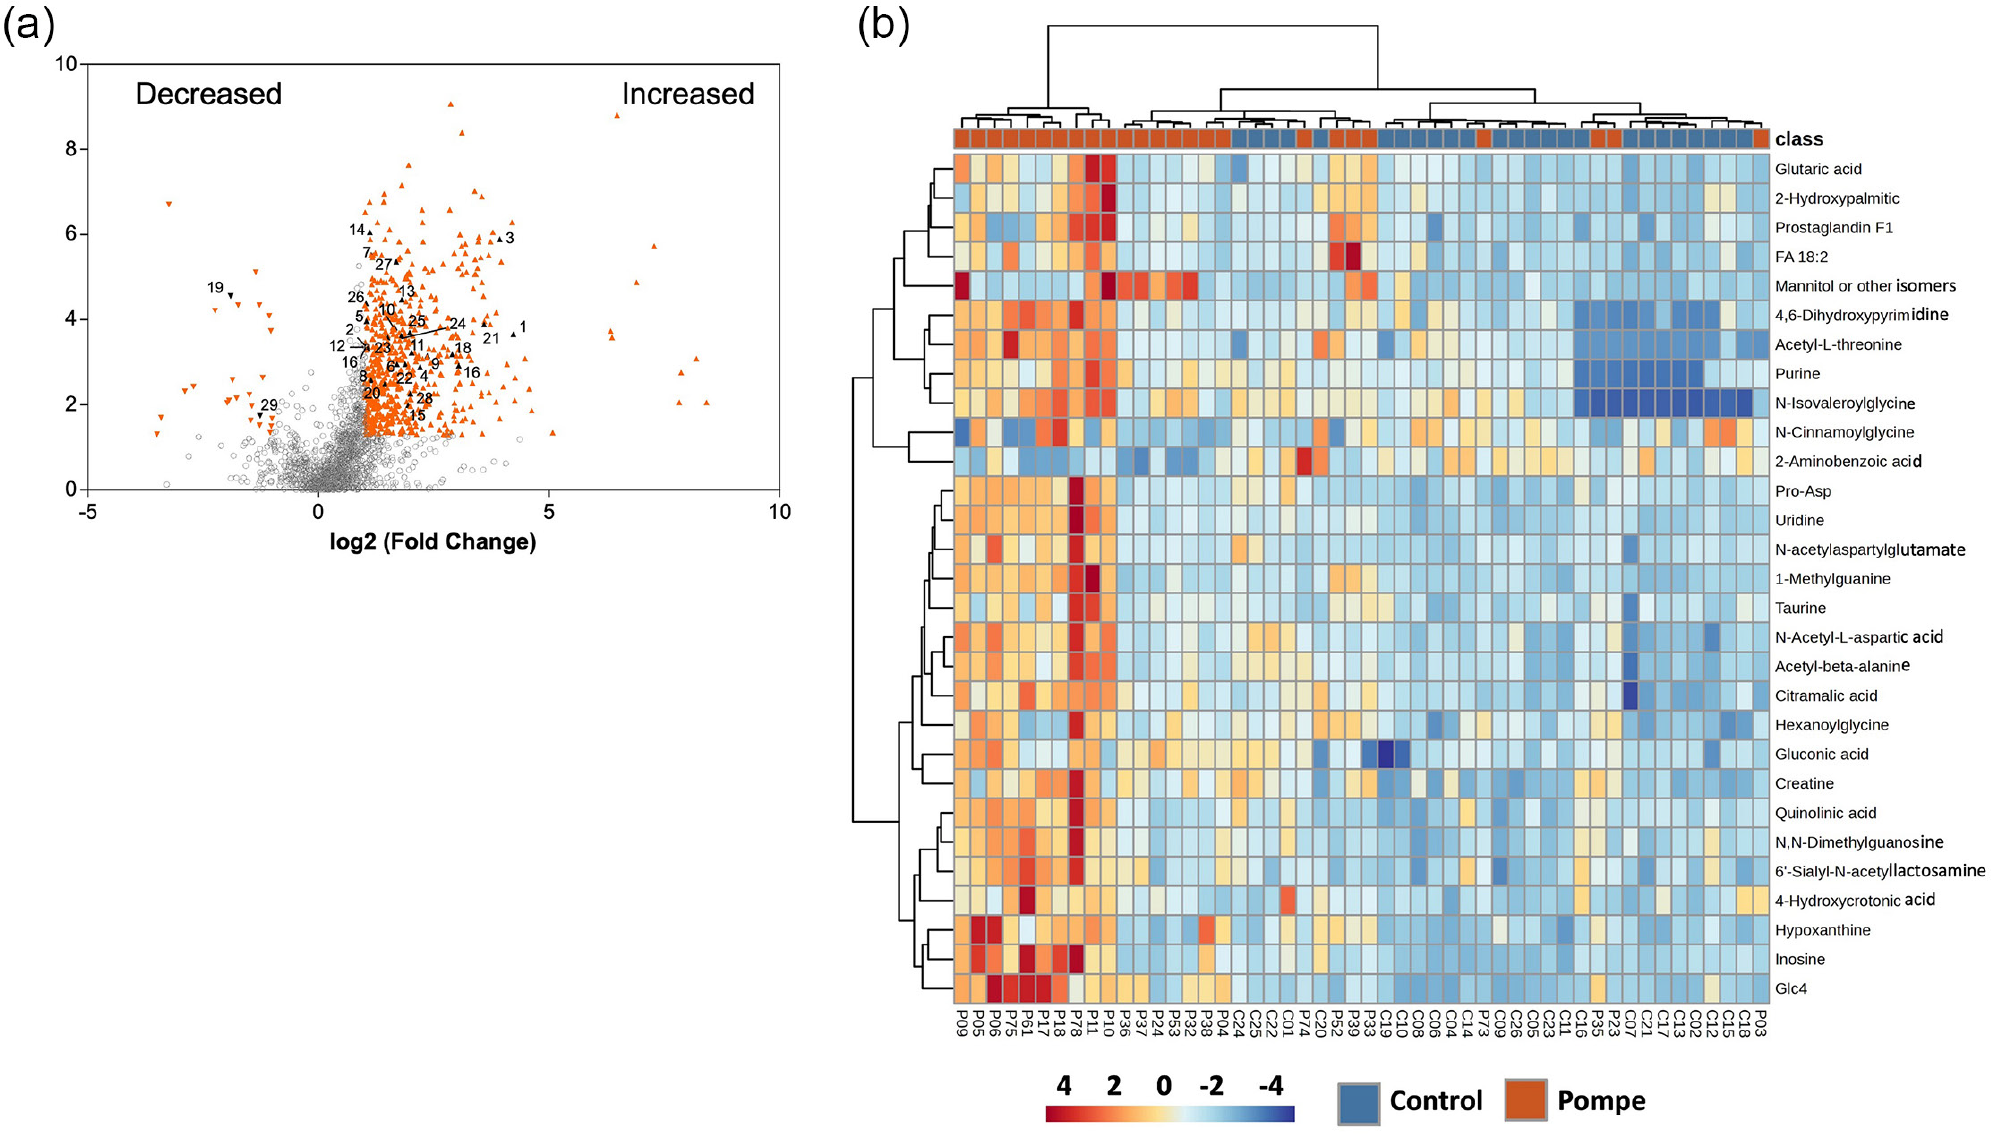
A volcano plot was generated as an alternative approach to evaluate the data for biomarker discovery, using a p-value < 0.05 and a fold change (FC) of 2.0. A dataset with 1934 molecular features, obtained after QC filtering and manual inspection of peak shapes, was used. The volcano plot analysis resulted in a list of 1233 altered variables. Twenty-five variables were decreased (red down-triangles), and 1208 were increased (red up-triangles) in the Pompe group. Of the 29 annotated metabolites selected by both classification algorithms, all were confirmed by the volcano scatter plot, represented in Figure 2a.
(a) Volcano scatter plot representing the increased and decreased variables with p-value < 0.05 and log2 (FC) < 1 and > 1, referring to the Pompe group. Red symbols represent the molecular features ranked by the partial least-squares discriminant analysis (PLS-DA) and random forest (RF) models; (b) heatmap with hierarchical clustering. Samples are shown in columns, and metabolites are listed in rows; Glc4: glucose tetrasaccharide; FA: fatty acid; Pro-Asp: prolyl-aspartic acid.
Finally, a heatmap was used to demonstrate the differences between the Pompe and the control groups regarding the relative abundances of the 29 metabolites revealed by PLS-DA and RF algorithm, and confirmed by the volcano plot. Figure 2b displays a heatmap with hierarchical clustering, constructed using the Ward method with Euclidean distance to group the rows (metabolite dendrogram) and the columns (sample dendrogram) based on their similarity. Twenty-seven metabolites showed increased levels in the Pompe group, as indicated by the dark brown pattern. Conversely, 2 metabolites in the Pompe group showed lower abundance. As shown in Figure 2b, a degree of heterogeneity can be observed among Pompe patients. The samples P09, P05, P06, P75, P61, P17, P18, P78, P11, P10, and P04 appear to cluster more tightly within the IOPD group, reflecting the more severe metabolic dysregulation characteristic of this phenotype and leading to a stronger deviation from the control metabolic profile. In contrast, the sample P03 did not cluster with the other IOPD samples. It had been under long-term enzyme replacement therapy, which may explain their partial shift toward the control group. A greater variability for the LOPD samples (P23, P24, P32, P33, P35, P36, P37, P38, P39, P52, P53, P73 and P74) was observed in their clustering. This dispersion is due to the milder nature of this phenotype and to inter-individual differences in disease progression, treatment response, or metabolic adaptation over time.
Consistency of urinary Pompe biomarkers in dried urine
In this study, 6 of the 29 annotated metabolites have been previously reported in studies using liquid urine from patients with Pompe disease.29 These include increased metabolites, such as Glc4, creatine, N-acetyl-L-aspartic acid, mannitol or related isomers, 1-methylguanine, as well as the decreased compound 2-aminobenzoic acid in the Pompe disease group. The detection of these metabolites in both matrices reinforces the analytical consistency of the approach and indicates that DUS preserves clinically relevant metabolic signatures associated with disease pathophysiology.
The presence of Glc4 (level 1 of identification) in DUS is consistent with its well-established role as a sensitive biomarker of incomplete lysosomal glycogen degradation.49 This metabolite is widely recognized in studies employing liquid urine, and its detection in filter paper samples demonstrates that the paper matrix does not hinder its recovery. Similarly, the increase in creatine levels (level 1 of identification) observed in DUS aligns with reports of muscle involvement in Pompe disease,50 indicating that filter paper collection maintains sufficient analytical integrity to capture alterations related to muscle damage and energy metabolism.
Additional metabolites found in both matrices, including N-acetyl-L-aspartic acid (level 1 of identification), mannitol or sorbitol (isomers not discriminated by MS/MS), as well as 1-methylguanine and 2-aminobenzoic acid (level 1 of identification), have also been reported in a previous investigation of Pompe disease.29 Their recurrence across different analytical matrices suggests that DUS effectively captures core elements of the systemic metabolic dysregulation characteristic of the disease. On the other hand, several metabolites identified in DUS (Table 1) have not yet been described in metabolomic studies of Pompe using liquid urine or other matrices, including plasma and tissues.51-53 These differences might result from biological variation among samples, including phenotypic diversity, age range, and enzyme-replacement therapy, as well as inherent features of each biological matrix and particular properties of the DUS matrix that could influence the stability or recovery of certain analytes.
Despite these considerations, the results demonstrate that DUS is a suitable matrix for LC-HRMS-based metabolomic studies in Pompe disease and that it preserves key metabolites of clinical relevance. The identification of classical biomarkers, along with potential new candidate metabolites, suggests that DUS may provide information that complements traditional liquid urine analyses. The practical advantages of DUS, including non-invasive collection, room-temperature storage, and simplified transport, are particularly valuable for multicenter studies and research involving rare diseases.
Conclusions
This study demonstrates the feasibility of using dried urine spot sampling for untargeted LC-HRMS-based metabolomics as a promising approach for investigating metabolic alterations in Pompe disease. A distinct urinary metabolic signature was identified, including both known markers like Glc4 and creatine, and additional metabolites associated with amino acid, nucleotide, lipid, and energy metabolism. Importantly, the recurrence of metabolites previously described in liquid urine in the DUS supports the analytical reliability of this alternative sampling matrix. Because this work was conducted as an exploratory metabolomics study, the biological interpretation of newly observed metabolites should be considered preliminary and will require further validation in independent and clinically stratified cohorts. Overall, our findings support DUS-based metabolomics as a non-invasive and practical analytical approach with strong potential for large-scale screening, longitudinal monitoring, and future metabolomics studies.
-
This publication is part of the special issue “Omics Sciences”
Supplementary Information
Supplementary data are available free of charge at http://jbcs.sbq.org.br as PDF file.
Supplementary material 1
Acknowledgments
Financial support of the Brazilian agency FAPERJ (project No. E-26/202.707/2018) is acknowledged by FFCM, and project No. E26/010.002501/2019 by RG. HMRS thanks CAPES Finance code 001 for the scholarship. The article was proofread with Grammarly for MS Office, version 2602 (build 19725.20126).
Data Availability Statement
Raw LC-HRMS data files are available upon request.
References
-
1 Zhang, X. W.; Li, Q. H.; Xu, Z. Di; Dou, J. J.; RSC Adv. 2020, 10, 3092. [Crossref]
» Crossref -
2 Wishart, D. S.; Physiol. Rev. 2019, 99, 1819. [Crossref]
» Crossref -
3 González-Peña, D.; Brennan, L.; Annu. Rev. Food Sci. Technol. 2019, 10, 479. [Crossref]
» Crossref -
4 Castelli, F. A.; Rosati, G.; Moguet, C.; Fuentes, C.; Marrugo Ramírez, J.; Lefebvre, T.; Volland, H.; Merkoçi, A.; Simon, S.; Fenaille, F.; Junot, C.; Anal. Bioanal. Chem. 2021, 414, 759. [Crossref]
» Crossref -
5 Yeung, P. K.; Metabolites 2018, 8, 11. [Crossref]
» Crossref -
6 Driesen, K.; Witters, P.; Metabolites 2022, 12, 398. [Crossref]
» Crossref -
7 Sandlers, Y.; Transl. Res. 2017, 189, 65. [Crossref]
» Crossref -
8 Frey, B. S.; Damon, D. E.; Badu-Tawiah, A. K.; Mass Spectrom. Rev. 2020, 39, 336. [Crossref]
» Crossref -
9 Lim, M. D.; Am. J. Trop. Med. Hyg. 2018, 99, 256. [Crossref]
» Crossref -
10 Niemiec, A.; Separations 2021, 8, 145. [Crossref]
» Crossref -
11 Zailani, N. N. B.; Ho, P. C. L.; Eur. J. Drug Metab. Pharmacokinet. 2023, 48, 467. [Crossref]
» Crossref -
12 Alotaibi, A. Z.; AlMalki, R. H.; Al Mogren, M.; Sebaa, R.; Alanazi, M.; Jacob, M.; Alodaib, A.; Alfares, A.; Abdel Rahman, A. M.; Int. J. Mol. Sci. 2024, 25, 5720. [Crossref]
» Crossref -
13 Zhuang, Y. J.; Mangwiro, Y.; Wake, M.; Saffery, R.; Greaves, R. F.; Clin. Chem. Lab. Med. 2022, 60, 1318. [Crossref]
» Crossref -
14 Li, K.; Naviaux, J. C.; Monk, J. M.; Wang, L.; Naviaux, R. K.; Metabolites 2020, 10, 82. [Crossref]
» Crossref -
15 Guo, X.; Zhou, L.; Wang, Y.; Suo, F.; Wang, C.; Zhou, W.; Gou, L.; Gu, M.; Xu, G.; J. Pharm. Biomed. Anal. 2023, 230, 115383. [Crossref]
» Crossref -
16 Guo, Y.; Chen, J.; Zhang, Z.; Liu, C.; Li, J.; Liu, Y.; Front. Pediatr. 2024, 12, 1. [Crossref]
» Crossref -
17 Koulman, A.; Prentice, P.; Wong, M. C. Y.; Matthews, L.; Bond, N. J.; Eiden, M.; Griffin, J. L.; Dunger, D. B.; Metabolomics 2014, 10, 1018. [Crossref]
» Crossref -
18 Drolet, J.; Tolstikov, V.; Williams, B. A.; Greenwood, B. P.; Hill, C.; Vishnudas, V. K.; Sarangarajan, R.; Narain, N. R.; Kiebish, M. A.; Metabolomics 2017, 7, 35. [Crossref]
» Crossref -
19 Seok, A. E.; Lee, J.; Lee, Y. R.; Lee, Y. J.; Kim, H. J.; Ihm, C.; Sung, H. J.; Hyun, S. H.; Kang, H. G.; Anal. Chem. 2018, 90, 12431. [Crossref]
» Crossref -
20 Menkovic, I.; Boutin, M.; Alayoubi, A.; Curado, F.; Bauer, P.; Mercier, F. E.; Auray-Blais, C.; Diagnostics 2022, 12, 1414. [Crossref]
» Crossref -
21 Martineau, T.; Maranda, B.; Auray-Blais, C.; Biomolecules 2024, 14, 1612. [Crossref]
» Crossref -
22 Auray-Blais, C.; Lavoie, P.; Zhang, H.; Gagnon, R.; Clarke, J. T. R.; Maranda, B.; Young, S. P.; An, Y.; Millington, D. S.; Clin. Chim. Acta 2012, 413, 771. [Crossref]
» Crossref -
23 Auray-Blais, C.; Collerette-Tremblay, J.; Lavoie, P.; Bioanalysis 2018, 10, 1181. [Crossref]
» Crossref -
24 Auray-Blais, C.; Lavoie, P.; Boutin, M.; Abaoui, M.; Curr. Protoc. Hum. Genet. 2017, 93, 17.26.1. [Crossref]
» Crossref -
25 Auray-Blais, C.; Maranda, B.; Lavoie, P.; Clin. Chim. Acta 2014, 436, 249. [Crossref]
» Crossref -
26 Semeraro, M.; Sacchetti, E.; Deodato, F.; Coşkun, T.; Lay, I.; Catesini, G.; Olivieri, G.; Rizzo, C.; Boenzi, S.; Dionisi-Vici, C.; Orphanet J. Rare Dis. 2021, 16, 24. [Crossref]
» Crossref -
27 Nagano, N.; Imaizumi, T.; Akimoto, T.; Hijikata, M.; Aoki, R.; Seimiya, A.; Okahashi, A.; Kawakami, K.; Komatsu, A.; Kawana, K.; Morioka, I.; Children 2021, 8, 561. [Crossref]
» Crossref -
28 De Souza, H. M. R.; Scalco, F. B.; Garrett, R.; Ferreira, F.; Marques, C.; Anal. Methods 2023, 15, 3932. [Crossref]
» Crossref -
29 de Moraes, M. B. M.; de Souza, H. M. R.; de Oliveira, M. L. C.; Peake, R. W. A.; Scalco, F. B.; Garrett, R.; Metabolomics 2023, 19, 1. [Crossref]
» Crossref -
30 Winkel, L. P. F.; Hagemans, M. L. C.; van Doorn, P. A.; Loonen, M. C. B.; Hop, W. J. C.; Reuser, A. J. J.; van der Ploeg, A. T.; J. Neurol. 2005, 252, 875. [Crossref]
» Crossref -
31 Bodamer, O. A.; Scott, C. R.; Giugliani, R.; Pediatrics 2017, 140, S4. [Crossref]
» Crossref -
32 Lim, J.-A.; Li, L.; Raben, N.; Front. Aging Neurosci. 2014, 6, 177. [Crossref]
» Crossref -
33 Oba-Shinjo, S. M.; da Silva, R.; Andrade, F. G.; Palmer, R. E.; Pomponio, R. J.; Ciociola, K. M.; Carvalho, M.; Gutierrez, P. S.; Porta, G.; Marrone, C. D.; Munoz, V.; Grzesiuk, A. K.; Llerena Jr., J. C.; Berditchevsky, C. R.; Sobreira, C.; Horovitz, D.; Hatem, T. P; Frota, E. R. C.; Pecchini, R.; Kouyoumdjian, J. A.; Werneck, L.; Amado, V. M.; Camelo Jr., J. S.; Mattaliano, R. J.; Mari, S. K. N.; J. Neurol. 2009, 256, 1881. [Crossref]
» Crossref -
34 Lippa, K. A.; Aristizabal-Henao, J. J.; Beger, R. D.; Bowden, J. A.; Broeckling, C.; Beecher, C.; Clay Davis, W.; Dunn, W. B.; Flores, R.; Goodacre, R.; Gouveia, G. J.; Harms, A. C.; Hartung, T.; Jones, C. M.; Lewis, M. R.; Ntai, I.; Percy, A. J.; Raftery, D.; Schock, T. B.; Sun, J.; Theodoridis, G.; Tayyari, F.; Torta, F.; Ulmer, C. Z.; Wilson, I.; Ubhi, B. K.; Metabolomics 2022, 18, 24. [Crossref]
» Crossref -
35 González-Domínguez, Á.; Estanyol-Torres, N.; Brunius, C.; Landberg, R.; González-Domínguez, R.; Anal. Chem. 2024, 96, 1064. [Crossref]
» Crossref -
36 Tsugawa, H.; Cajka, T.; Kind, T.; Ma, Y.; Higgins, B.; Ikeda, K.; Kanazawa, M.; VanderGheynst, J.; Fiehn, O.; Arita, M.; Nat. Methods 2015, 12, 523. [Crossref]
» Crossref -
37 Wishart, D. S.; Feunang, Y. D.; Marcu, A.; Guo, A. C.; Liang, K.; Vázquez-Fresno, R.; Sajed, T.; Johnson, D.; Li, C.; Karu, N.; Sayeeda, Z.; Lo, E.; Assempour, N.; Berjanskii, M.; Singhal, S.; Arndt, D.; Liang, Y.; Badran, H.; Grant, J.; Serra-Cayuela, A.; Liu, Y.; Mandal, R.; Neveu, V.; Pon, A.; Knox, C.; Wilson, M.; Manach, C.; Scalbert, A.; Nucleic Acids Res. 2018, 46, D608. [Crossref]
» Crossref -
38 Wang, Y.; Xiao, J.; Suzek, T. O.; Zhang, J.; Wang, J.; Bryant, S. H.; Nucleic Acids Res. 2009, 37, W623. [Crossref]
» Crossref -
39 Tautenhahn, R.; Cho, K.; Uritboonthai, W.; Zhu, Z.; Patti, G. J.; Siuzdak, G.; Nat. Biotechnol. 2012, 30, 826. [Crossref]
» Crossref -
40 Kanehisa, M.; Goto, S.; Hattori, M.; Aoki-Kinoshita, K. F.; Itoh, M.; Kawashima, S.; Katayama, T.; Araki, M.; Hirakawa, M.; Nucleic Acids Res. 2006, 34, D354. [Crossref]
» Crossref -
41 Tsugawa, H.; Kind, T.; Nakabayashi, R.; Yukihira, D.; Tanaka, W.; Cajka, T.; Saito, K.; Fiehn, O.; Arita, M.; Anal. Chem. 2016, 88, 7946. [Crossref]
» Crossref -
42 Sumner, L. W.; Amberg, A.; Barrett, D.; Beale, M. H.; Beger, R.; Daykin, C. A.; Fan, T. W. M.; Fiehn, O.; Goodacre, R.; Griffin, J. L.; Hankemeier, T.; Hardy, N.; Harnly, J.; Higashi, R.; Kopka, J.; Lane, A. N.; Lindon, J. C.; Marriott, P.; Nicholls, A. W.; Reily, M. D.; Thaden, J. J.; Viant, M. R.; Metabolomics 2007, 3, 211. [Crossref]
» Crossref -
43 Pang Z.; Zhou G.; Ewald J.; Chang L.; Hacariz O.; Basu N.; Xia J.; Nat. Protoc 2022 17, 1735. [Crossref]
» Crossref -
44 Dunn, W. B.; Broadhurst, D.; Begley, P.; Zelena, E.; Francis Mcintyre, S.; Anderson, N.; Brown, M.; Knowles, J. D.; Halsall, A.; Haselden, J. N.; Nicholls, A. W.; Wilson, I. D.; Kell, D. B.; Goodacre, R.; Nat. Protoc. 2011, 6, 1060. [Crossref]
» Crossref -
45 Akarachantachote, N.; Chadcham, S.; Saithanu, K.; Int. J. Pure Appl. Math. 2014, 94, 307. [Crossref]
» Crossref -
46 R Core Team, version 4.4.3; R Foundation for Statistical Computing, Vienna, Austria, 2021. [Crossref]
» Crossref -
47 Godzien, J.; Ciborowski, M.; Angulo, S.; Barbas, C.; Electrophoresis 2013, 34, 2812. [Crossref]
» Crossref -
48 Gromski, P. S.; Muhamadali, H.; Ellis, D. I.; Xu, Y.; Correa, E.; Turner, M. L.; Goodacre, R.; Anal. Chim. Acta 2015, 879, 10. [Crossref]
» Crossref -
49 An, Y.; Young, S. P.; Kishnani, P. S.; Millington, D. S.; Amalfitano, A.; Corz, D.; Chen, Y. T.; Mol. Genet. Metab. 2005, 85, 247. [Crossref]
» Crossref -
50 Kohler, L.; Puertollano, R.; Raben, N.; Neurotherapeutics 2018, 15, 928. [Crossref]
» Crossref -
51 Lu, Y.; Tian, J.; Deng, J.; Peng, Q.; Zhang, W.; Yuan, Y.; Yu, M.; Wang, Z.; Mol. Genet. Metab. 2025, 144, 109045. [Crossref]
» Crossref -
52 Sidorina, A.; Catesini, G.; Levi Mortera, S.; Marzano, V.; Putignani, L.; Boenzi, S.; Taurisano, R.; Garibaldi, M.; Deodato, F.; Dionisi-Vici, C.; J. Inherit. Metab. Dis. 2021, 44, 705. [Crossref]
» Crossref -
53 Gómez-Cebrián, N.; Gras-Colomer, E.; Poveda Andrés, J. L.; Pineda-Lucena, A.; Puchades-Carrasco, L.; Biology 2023, 12, 1159. [Crossref]
» Crossref
Edited by
-
Editor handled this article:
Andréa Rodrigues Chaves (Executive)