Abstracts
This paper demonstrates the possibility of simultaneously determining lead and copper in mineral, river and tap water by potentiometric stripping analysis using a low-cost lab-made potentiostat and a wavelet-based signal processing method. Pb(II) and Cu(II) concentrations were found to be in the range 3-7 µg L-1. Relative standard deviations were on average smaller than 3%, which is satisfactory in view of the trace concentration. For comparison, the determination was also carried out by using a high-end commercial equipment (μAutolab Type II, Eco Chemie). The average and standard deviation of the results were similar to those obtained with the lab-made potentiostat. No significant statistical difference was verified according to a paired t-test at a confidence level of 95%.
potentiometric stripping analysis; wavelet transform; lead; copper; water analysis
Este artigo demonstra a possibilidade de se realizar uma determinação simultânea de chumbo e cobre em água mineral, de rio e de torneira mediante análise por redissolução potenciométrica empregando um potenciostato lab-made de baixo custo e um método de processamento de sinais baseado em wavelets. As concentrações encontradas para Pb(II) e Cu(II) situaram-se na faixa 3-7 µg L-1. Os desvios padrão relativos foram em média menores que 3%, o que é satisfatório tendo em vista as baixas concentrações dos analitos. Para comparação, a determinação foi também realizada empregando um equipamento comercial de alto padrão (μAutolab Type II, Eco Chemie). As médias e desvios padrão dos resultados foram similares aos obtidos com o potenciostato lab-made. Não foi verificada diferença estatística significativa de acordo com um teste t pareado ao nível de confiança de 95%.
SHORT REPORT
Wavelet-Based determination of Cu and Pb in water samples using potentiometric stripping analysis with a Lab-Made potentiostat
Valdomiro L. MartinsI; Roberto K. Harrop GalvãoII; Mário César U. de AraújoI,* * e-mail: laqa@quimica.ufpb.br ; Edvaldo da Nóbrega GaiãoIII
IDepartamento de Química, Universidade Federal da Paraíba, CP 5093, 58051-970 João Pessoa-PB, Brazil
IIDivisão de Engenharia Eletrônica, Instituto Tecnológico de Aeronáutica, 12228-900 São José dos Campos-SP, Brazil
IIIUnidade Acadêmica de Serra Talhada, Universidade Federal Rural de Pernambuco, 56900-000 Serra Talhada-PE, Brazil
ABSTRACT
This paper demonstrates the possibility of simultaneously determining lead and copper in mineral, river and tap water by potentiometric stripping analysis using a low-cost lab-made potentiostat and a wavelet-based signal processing method. Pb(II) and Cu(II) concentrations were found to be in the range 3-7 µg L-1. Relative standard deviations were on average smaller than 3%, which is satisfactory in view of the trace concentration. For comparison, the determination was also carried out by using a high-end commercial equipment (μAutolab Type II, Eco Chemie). The average and standard deviation of the results were similar to those obtained with the lab-made potentiostat. No significant statistical difference was verified according to a paired t-test at a confidence level of 95%.
Keywords: potentiometric stripping analysis, wavelet transform, lead, copper, water analysis
RESUMO
Este artigo demonstra a possibilidade de se realizar uma determinação simultânea de chumbo e cobre em água mineral, de rio e de torneira mediante análise por redissolução potenciométrica empregando um potenciostato lab-made de baixo custo e um método de processamento de sinais baseado em wavelets. As concentrações encontradas para Pb(II) e Cu(II) situaram-se na faixa 3-7 µg L-1. Os desvios padrão relativos foram em média menores que 3%, o que é satisfatório tendo em vista as baixas concentrações dos analitos. Para comparação, a determinação foi também realizada empregando um equipamento comercial de alto padrão (μAutolab Type II, Eco Chemie). As médias e desvios padrão dos resultados foram similares aos obtidos com o potenciostato lab-made. Não foi verificada diferença estatística significativa de acordo com um teste t pareado ao nível de confiança de 95%.
Introduction
Since it was introduced by Jagner and Graneli, in 1976, potentiometric stripping analysis (PSA) has gained widespread application.1 PSA is particularly useful for determination of trace and ultra-trace concentration levels of heavy metals in a variety of matrices such as food, sediments and water, as well as in biological samples.2-4 As compared to voltammetric stripping analysis (VSA), PSA has several advantages, such as smaller dependence on the electrode surface reproducibility, robustness with respect to the presence of some electroactive organic species, applicability to the analysis of solutions with low ionic strength, no need for deoxygenation of the sample, lower background contributions.5,6 In addition, PSA can be carried out with a simple and inexpensive instrumentation, which can be easily automated. In fact, the only physical parameters that need to be measured are potential and time.
PSA fundamentals are well-established in the literature. In brief, PSA comprises two steps.2 Firstly, electrolysis is carried out at a controlled potential in order to pre-concentrate the target metallic ions in another phase (a mercury film, for example). Secondly, the potentiostatic circuit is opened and the ions are reoxidized by chemical oxidation (PSA) or constant current (CCPSA). During reoxidation of the analyte, the potential of the working electrode (E) is monitored as a function of time (t). The resulting E × t curve exhibits a stripping plateau at a different potential level for each analyte. The time duration of the plateau is proportional to the bulk analyte concentration.
The measurement of plateau duration is a critical procedure in PSA, which directly affects the accuracy and precision of the results. Such a measurement may not be straightforward, as the plateau endpoints correspond to inflections which may not be clearly localized in the presence of noise. Among the different approaches that have been proposed to address this problem, two well-known techniques are the derivative potentiometric stripping analysis (dPSA) and the differential potentiometric stripping analysis (DPSA). In dPSA, curves dE/dt × t are employed and the analytical signal is obtained as the distance between two consecutive maxima.6 DPSA exploits the dt/dE × E curve, which exhibits a peak for each analyte. In this case, the height or the area of each peak are used as analytical parameters.7 In both dPSA and DPSA, signal processing methods, such as Fourier Transform, Savitzky-Golay and Moving Average, are usually employed to de-noise the curve prior to the derivative calculation.8,9
As an alternative to dPSA and DPSA, our research group developed a method for localization of inflection points which exploits the multiscale processing features of the Wavelet Transform (WT) and avoids the need for explicit signal differentiation.10 In that paper, the proposed WT-PSA strategy was validated by means of numerical simulations, and was applied in a case study involving Pb and Cd determination (at the level of 25 μg L-1) in synthetic water samples. However, the efficiency of this approach for analysis of real samples remained to be demonstrated. This gap is addressed in the present work, which investigates the use of WT-PSA for simultaneous determination of Pb and Cu naturally found in mineral, river, and tap water.
Accurate determination of lead in environmental and food samples is of importance because of its high toxicity for humans. Lead is rapidly transported to bone tissues, where it undergoes bioaccumulation. The half-life of lead in human bones is estimated to be around 20 years.11 According to Brazilian legislation (Resolution 274, 22 September 2005, ANVISA) the maximum allowed level for Pb in natural and mineral waters is 10 μg L-1. In contrast, copper is not usually a major source of concern in the analysis of water samples (the maximum level allowed by ANVISA is 1 mg L-1). However, it is included in the present investigation to assess the ability of WT-PSA to localize subtle inflection points near the end of the working range of potentials. Such a problem was not addressed in our previous work.10 In fact, the inflections associated to Pb and Cd are more apparent as compared to Cu.10
In order to emphasize the efficiency of WT-PSA to deal with noisy signals, a low-cost lab-made potentiostat is adopted in the present work. The results are compared to those obtained by using a high-end commercial equipment.
Experimental
Standards, reagents and samples
Deionized water purified with a Milli-Q Plus system (Millipore) and high purity reagents were used. The 1000 mg L-1 Hg(II) stock solution was prepared from Hg(II) chloride salt (Merck, Germany) in 0.1 mol L-1 HCl. The 1000 mg L-1 Cu(II) and Pb(II) stock solutions were prepared from their Titrisol (Merck, Germany) ampoules in 0.1 mol L-1 HCl. The working standard addition solution, containing Pb(II) and Cu(II) with equal concentrations (10.0 mg L-1) was prepared by diluting stock solutions in 0.1 mol L-1 HCl.
Mineral water samples of four different commercial brands (A, B, C, D) were acquired in the city of João Pessoa, Paraíba, Brazil. Water was also collected from the Mossoró river (sample E) in the city of Mossoró, Rio Grande do Norte, Brazil, as well as from taps in our laboratory (sample F). All samples were acidified with hydrochloric acid to pH 1.0. For determination of Pb and Cu, 10 mL of water, 100 μL of Hg(II) 1000 mg L-1 and 90 μL of 37% v/v HCl (Merck suprapur), were placed in the cell and the analysis was carried out with pre-concentration time of 10 min, as described bellow.
Apparatus
The PSA measurements were performed with a lab-made potentiostat described elsewhere.12 For comparison, CCPSA measurements were carried out using a modular electrochemical system µAutolab Type II (Eco Chemie), driven by the GPES 4.9 software. In both cases the potentiostat was connected to a Metrohm model 663 VA stand for polarographic and voltammetric analysis and to a personal computer.
The following configuration was employed in the electrochemical system: (i) rotating glassy carbon disk (Metrohm, 2 mm diameter) coated with mercury film as working electrode, (ii) Ag/AgCl/KCl (3 mol L-1) as reference electrode, and (iii) platinum rod as auxiliary electrode. All experiments were carried out at room temperature in non-deaerated solutions. Constant rotation at 1500 rpm was applied to the working electrode.
Before analysis, the working electrode was polished with alumina 3 μm, cleaned with 95% v/v ethanol and finally rinsed with deionized water.
Analytical procedure
All measurements were performed in acidic medium, in presence of dissolved oxygen. Mercury film and analyte deposition on the surface of the working electrode were simultaneously carried out by keeping the potential at -1.0 V during 10 min. Subsequently, the potentiogram was recorded (in open circuit) from -1.0 V to -0.02 V. This process was also performed for three increasing levels of standard addition. The stripping measurements were always carried out in triplicate.
Software
The μAutolab measurements were automatically processed by the software supplied with the equipment, which employs the DPSA technique. The potentiograms acquired with the lab-made potentiostat were subjected to the WT-PSA technique, which was implemented in the Borland Delphi 2007 software platform.
Results and Discussion
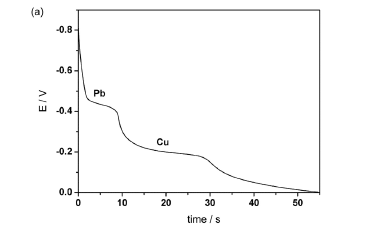
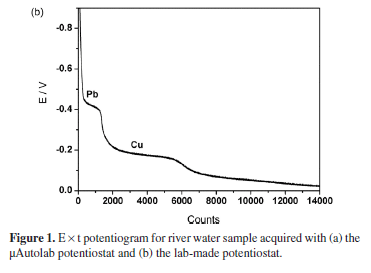
Stripping potentiograms obtained with river water (sample E) by using the μAutolab and the lab-made potentiostats are shown in Figures 1a and 1b, respectively. The plateaus around -0.4 and -0.2 V are associated to Pb (II) and Cu (II), respectively. As expected, the noise level is considerably larger for the potentiogram acquired with the lab-made potentiostat.
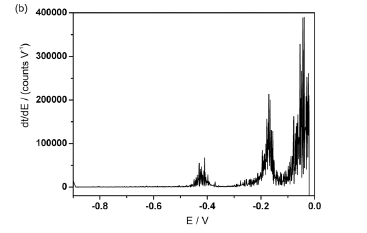
The DPSA curve generated from the μAutolab potentiogram is presented in Figure 2a. The two peaks observed in this graph correspond to Pb (II) and Cu (II). In this case, the peak heights (vertical dashed lines in Figure 2a) are used as analytical parameters. For comparison, the DPSA curve associated to the potentiogram acquired with the lab-made potentiostat is presented in Figure 2b. As can be seen, the DPSA curve obtained in this case is considerably degraded by noise, which compromises the measurement of peak heights. Such a problem justifies the adoption of WT-PSA.10
In WT-PSA, the plateau duration is determined from the distance between consecutive zero crossings of the Mexican Hat wavelet transform of the potentiogram, as illustrated in Figure 2c.10 For better time resolution, small wavelet scales should be employed. However, the effect of noise tends to increase as the wavelet scale is reduced.13 Therefore, an extrapolation procedure is employed to obtain the zero crossing positions for small wavelet scales, as detailed elsewhere.10
The results obtained with WT-PSA (lab-made potentiostat) and DPSA (µAutolab) are reported in Table 1. As can be seen, a close agreement between the two methods was obtained for all water samples. In fact, no significant statistical difference was verified according to a paired t-test at a confidence level of 95%. The standard deviations for WT-PSA (lab-made potentiostat) and DPSA (µAutolab) ranged from 0.1 to 0.3 µg L-1, with the exception of Cu in sample B for WT-PSA (lab-made potentiostat) and Pb in sample C for DPSA (µAutolab). These results can be deemed satisfactory, considering the range of concentrations (3-7 µg L-1) found in the determinations.
Conclusions
The WT-PSA strategy was applied in a study involving the determination of Pb and Cu with µg L-1 concentration levels in mineral, river and tap water samples. The results obtained by using a low-cost lab-made potentiostat were compared to those provided by a high-end commercial system (µAutolab). The results of the two analytical methods were found to be in close agreement. Moreover, the repeatability was satisfactory, with relative standard deviations smaller than 3% on average for concentration levels ranging from 3 to 7 µg L-1. It is worth noting that the concentration levels are smaller than those obtained in a previous study10 (25-50 µg L-1) and meet the limit established by Brazilian legislation (10 µg L-1 for Pb and 1 mg L-1 for Cu).
These results corroborate our previous findings, which were obtained for synthetic samples, and indicate that the WT-PSA strategy can be considered a valid tool for determination of plateau durations in potentiograms.10
Acknowledgments
The authors acknowledge the support of the Brazilian agencies CNPq (research fellowships and doctorate scholarship) and CAPES (PROCAD Grant 0081/05-1).
Received: January 20, 2009
Web Release Date: August 28, 2009
FAPESP helped in meeting the publication costs of this article.
- 1. Jagner, D.; Graneli, A.; Anal. Chim. Acta 1976, 83, 19.
- 2. Estela, J. M.; Tomás, C.; Cladera, A.; Cerdà, V.; Crit. Rev. Anal. Chem. 1995, 25, 91.
- 3. Munoz, R. A. A.; Kolbe, M.; Siloto, R. C.; Oliveira, P. V.; Angnes, L.; J. Braz. Chem. Soc. 2007, 18, 410.
- 4. Stankovic, S.; Čičkarić, D.; Marković, J.; Desalination 2007, 213, 282.
- 5. Nobre, A. L. R; Mazo, L. H.; Quim. Nova 1996, 20, 412.
- 6. Jagner, D.; Aren, K.; Anal. Chim. Acta 1978, 100, 375.
- 7. Kryger, L.; Anal. Chim. Acta 1980, 120, 19.
- 8. Beebe, K. R.; Pell, R. J.; Seasholtz, M. B.; Chemometrics: A Practical Guide, Wiley: New York, 1998.
- 9. Chau, F. T.; Liang, Y. Z.; Gao, J.; Shao, X. G.; Chemometrics: From Basics to Wavelet Transform, Wiley: New York, 2004.
- 10. Martins, V. L.; Almeida, L. F.; Castro, S. L.; Galvão, R. K. H.; Araújo, M. C. U.; Silva, E. C.; J. Chem. Inf. Comput. Sci. 2003, 43, 1725.
- 11. Manahan, S. E.; Toxicological Chemistry and Biochemistry, 3rd ed., Lewis Publishers: 2002, p. 221.
- 12. Martins, V. L.; Almeida, L. F.; Moreira, P. N. T.; Gaião, E. N.; Silva, E. C.; Angnes, L.; Araújo, M. C. U.; Control & Instrum. 2002, 74, 80.
- 13. Galvão, R. K. H.; Araújo, M. C. U.; Saldanha, T. C. B.; Visani, V.; Pimentel, M. F.; Quim. Nova 2001, 24, 874.
Publication Dates
-
Publication in this collection
30 Oct 2009 -
Date of issue
2009
History
-
Accepted
28 Aug 2009 -
Received
20 Jan 2009


