Energy, Fatty Acid, and Cytokine (TNF-α and IL-10) Content in Mature Human Milk: Comparison between Foremilk, Middle Milk, and Hindmilk Breastfeeding Intervals
Abstract
Human milk is a dynamic biological fluid whose composition varies throughout lactation, adapting to meet the physiological needs of the newborn. This study investigated how the breastfeeding time (foremilk, middle milk, hindmilk) affects energy, fatty acid, and tumor necrosis factor-alpha (TNF-α) and interleukin-10 (IL-10) contents in mature human milk from five distinct donors (M1-M5), using creamatocrit, gas chromatography, and enzyme-linked immunosorbent assays, respectively. The results progressively increased in energy values, with the highest values in hindmilk. Fatty acid composition exhibited distinct individual profiles, with palmitic acid predominating in M1 and M5, and oleic acid more prominent in M2, M3, and M4. The duration of breastfeeding significantly influences the caloric and lipid composition of mature human milk. Principal component analysis (PCA) accounted for 59.6% of the variance, indicating the clustering of fatty acid profiles according to collection times from the same donor. No consistent pattern was observed for the immunological factors throughout the lactation. TNF-α was undetectable in some samples, possibly due to its low concentration in mature human milk, while IL-10 was consistently detected. These findings suggest that individual factors such as maternal diet, body composition, and lifestyle may influence the nutritional and immunological composition of human milk.
Keywords:
human milk; lactation; creamatocrit; GC-FID; ELISA; breastfeeding
Introduction
According to the World Health Organization (WHO) and the United Nations Children’s Fund (UNICEF), breastfeeding should begin within the first hour after birth and continue exclusively for the first six months to support optimal child development.1 Human milk is a complex, dynamic, and highly adaptable biological fluid, rich in nutrients, bioactive compounds, and immunological factors essential for infant growth and protection.2,3
The composition of human milk varies between mothers, lactation phases, and throughout the same breastfeeding, with three phases defining the composition of human milk. Foremilk, expressed at the beginning of the breastfeeding, has a high water, carbohydrate, and protein content; middle milk presents a progressive increase in lipids; and hindmilk, expressed at the end of the breastfeeding, is significantly richer in fat and calories.4,5
In the first months, human milk lipids provide between 40 and 60% of the energy content and are mainly in the form of triacylglycerols.6 Several factors, such as maternal diet, body mass index (BMI), stage of lactation, time of day, and frequency of breastfeedings can influence the nutritional quality of fatty acids.7,8 In addition, human milk contains cytokines that play a crucial role in modulating the immune response. Interleukin-10 (IL-10), which has anti-inflammatory action, and tumor necrosis factor-alpha (TNF-α), which is associated with inflammatory processes, stand out.9 Evidence suggests a possible association between human milk lipid profiles and levels of these cytokines, reflecting the close relationship between nutrition and immunity.10
Given the scarcity of studies that integratively examined the impact of different breastfeeding phases on nutritional and immunological parameters, this study aimed to investigate variations in energy content, fatty acid profiles, and levels of the cytokines IL-10 and TNF-α in mature human milk. For this purpose, samples of the foremilk, middle milk, and hindmilk of five lactating women were studied.
Experimental
Reagents
The reagents used in the study were all of analytical grade, with chloroform, n-heptane, methanol, and sodium chloride obtained from Synth (São Paulo, Brazil), and potassium hydroxide from Dinâmica (São Paulo, Brazil).
Sampling
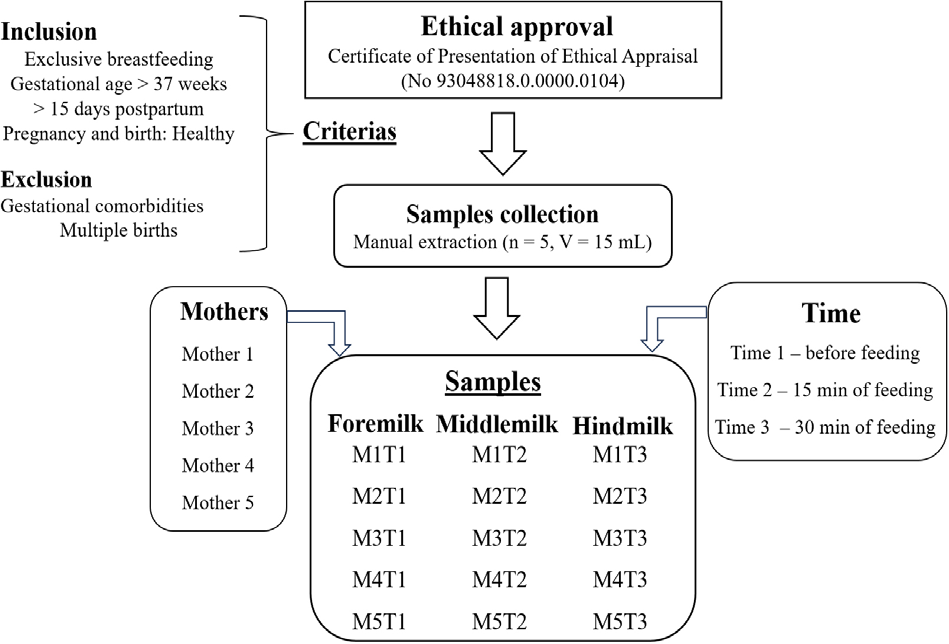
The study was approved by the Research Ethics Committee (No. 3.098.157/2018) of the State University of Maringá (UEM, Maringá, Brazil). This study is characterized as a quantitative approach of a descriptive analysis of a case series, involving five donors, identified as mother 1 (M1), mother 2 (M2), mother 3 (M3), mother 4 (M4) and mother 5 (M5).
Mature human milk samples (more than 15 days postpartum) were collected from lactating women who maintained exclusive breastfeeding. These were selected by convenience and monitored by the Gynecology and Obstetrics Department of the Regional University Hospital of Maringá. Inclusion criteria were gestational age over 37 weeks, healthy pregnancy and delivery, regardless of the type of delivery and number of previous pregnancies, and residence in the region. Exclusion criteria included lactating women with gestational comorbidities (hypertension, diabetes, among others) or those who had multiple births.
Human milk was collected by hand expression at three intervals during breastfeeding: T1 (start of breastfeeding, foremilk), T2 (15 min, middle milk), and T3 (30 min, hindmilk), with 15 mL obtained at each interval, stored in test tubes, and kept at 4 °C in a cooler. All collections were standardized to occur in the morning period, between 8 am and 10 am, to minimize circadian variations in milk composition and ensure greater constancy in maternal metabolism. In total, 15 samples (3 periods × 5 donors) were studied for caloric content, fatty acid profile, and concentrations of the cytokines IL-10 and TNF-α. Figure 1 illustrates the collection scheme adopted.
Creamatocrit
The caloric content of human milk was determined by the creamatocrit method.11 A 1 mL aliquot of previously homogenized human milk was transferred to a test tube and heated at 40 °C for 15 min. Then, a 75 μL aliquot was collected in a microcapillary, sealed at one end, and centrifuged for 15 min to separate into cream and serum. The cream percentage was defined by measuring the length of the cream layer based on the total height of the sample. The energy content (kcal per liter) of milk was estimated using equation 1:
Fatty acid composition
Lipids were extracted from the samples following the technique of Folch et al.,12 using 1 mL of sample in a 1:20 ratio with chloroform and methanol (2:1, v/v). The extracted lipids were methylated according to the International Organization for Standardization (ISO 12966:2017),13 forming fatty acid methyl esters (FAMEs). The upper phase was collected and analyzed in a gas chromatograph (GC, Trace Ultra 3300, Waltham, USA) with a flame ionization detector (FID). The separation occurred in a CP-7420 capillary column (100 m × 0.25 mm, 0.25 µm cyanopropyl film) with an injector in 1:40 split mode using an injection volume of 2.0 µL.
The equipment was programmed with a detector temperature of 250 °C and an injector at 230 °C. The GC FID oven started a gradient at 65 °C for 4 min, followed by a heating to 185 °C (15 °C min-1) with maintenance for 12 min, and a second heating to 235 °C (20 °C min-1) maintained for 14 min. The gas flows were 1.4 mL min-1 for the carrier gas (H2), 30 mL min-1 for the makeup gas (N2), and 30 and 300 mL min-1 for the H2 and synthetic air flames, respectively. The chromatographic peak areas were analyzed using ChromQuest™ 5.0 software, with the identification of fatty acid methyl esters (FAMEs) performed by comparison with the retention times of an analytical standard (FAME C4-C24 mixture, Sigma-Aldrich, USA). The results were expressed as relative area percentages.
Nutritional index of fatty acids
Considering the determined fatty acid composition, eight indexes were calculated to evaluate the lipid nutritional quality of the fatty acids (equations 2 to 9).
where ∑PUFA is the total of polyunsaturated fatty acids, ∑SFA is the total of saturated acids, ∑n-6 is the total of omega-6 fatty acid group, ∑n-3 is the total of omega-3 fatty acid group, EPA is eicosapentaenoic acid (20:5n-3), DHA is docosahexaenoic acid (22:6n-3), LA is linoleic acid (18:2n-6), ALA is α-linolenic acid (18:3n-3), H/H is hypocholesterolemic/hypercholesterolemic, AI is atherogenicity index, TI is thrombogenicity index, HPI is health promotion index.
Analysis of IL-10 and TNF-α cytokines
Interleukin-10 (IL-10) measurement was performed using the Human Custom Procartaplex 9-plex kit (Invitrogen™, Thermo Fisher Scientific, Inc., Burlington, Canada), following the manufacturer’s instructions. Fluorescence reading was performed using a Luminex® 100/200™ flow cytometer.
Tumor necrosis factor alpha (TNF-α) levels were measured by enzyme-linked immunosorbent assay (ELISA) using the HumanTNF alpha ELISA kit (Invitrogen™, Thermo Fisher Scientific, Inc., Burlington, Canada), according to the manufacturer’s instructions. Absorbance was recorded using an ASYS™ microplate reader (EXPERT PLUS model, Holliston, USA). Samples were analyzed without dilution.
Statistical analysis
The data obtained in triplicate were subjected to analysis of variance (ANOVA), and the means were compared by the Tukey’s test (p < 0.05) in the Statistica software version 7.0.14 The fatty acid composition was also evaluated by principal component analysis (PCA) using the Factor Extra and FactoMineR data packages of the R software with the graphical interface RStudio.15
Results and Discussion
Energy content (kcal per liter)
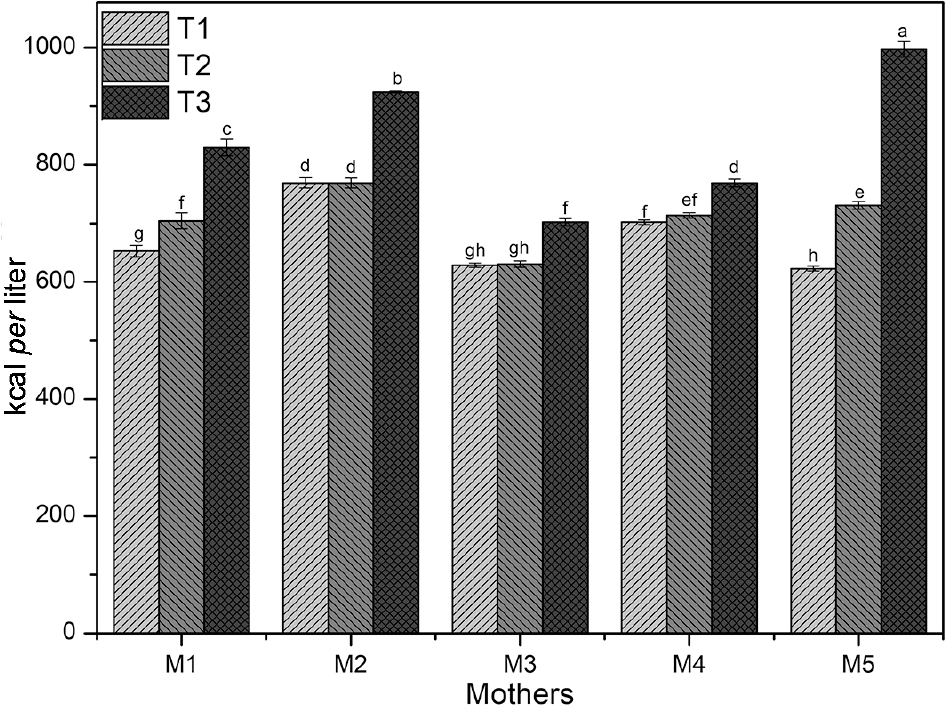
Creamatocrit is a technique routinely used in Human Milk Banks in Brazil to estimate the energy content of human milk. The method is based on a mathematical relationship that considers the proportion between the lipid (cream) and water-soluble (serum) fractions, obtained by centrifugation.11,16,17 In the present study, the energy content of mature human milk expressed in three different periods of breastfeeding from five lactating women was evaluated (Figure 2).
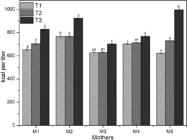
Influence of breastfeeding duration on the energy content (kcal per liter) of mature human milk obtained from individual mothers (T1: foremilk, T2: middle milk, T3: hindmilk, M1: mother 1, M2: mother 2, M3: mother 3, M4: mother 4 and M5: mother 5). Lower-case letters refer to statistically significant differences (p < 0.05) by Tukey’s test.
The results revealed a variable and progressive increase in the energy content of human milk throughout breastfeeding. The highest values were recorded at T3 when compared to T1 and T2. According to Moraes et al.,18 the caloric content of human milk is categorized as hypocaloric (< 580 kcal per liter), caloric (580-711 kcal per liter), or hypercaloric (> 711 kcal per liter). In this study, all T1 samples were classified as caloric, except for M2T1, which remained hypercaloric at all time points. At T2 and T3, the hypercaloric classification predominated, except M1T2 (704.20 ± 13.57), M3T2 (630.12 ± 5.37), and M3T3 (701.92 ± 6.51), which remained within the caloric range.
The findings are consistent with previous reports of mature human milk exhibiting energy values around 700 kcal L-1. Given that the recommended daily energy intake for full-term infants ranges from 72 to 108 kcal kg 1,19 the observed values support the nutritional adequacy of human milk in meeting infant energy demands. Moreover, the increase in caloric density throughout breastfeeding may reflect the physiological transition from foremilk to hindmilk, which is richer in lipids. The literature7 highlights that several factors can contribute to the energy content of human milk, including maternal age and diet, BMI, stage of lactation, time of day, frequency and duration of breastfeeding.
The energy content between T1 and T2 was accentuated individually at M5, which increased by 17.38% in this interval. The other variations in this interval were 0.25 to 7.86%, while M2 remained stable. More pronounced increases were noted between T2 and T3, ranging from 7.77% in M4 to 36.38% in M5. The most significant changes, however, occurred between T1 and T3, particularly in M5 (60.11%) and M1 (27.07%). Similarly, Ross et al.20 reported an approximately two-fold increase in caloric content between the beginning and end of a feed. Other studies also indicate up to a 29% fluctuation in the energy value of human milk over a day.19,21
Foremilk is naturally richer in carbohydrates and proteins, supporting the initial hydration and nutrition of the baby, while hindmilk contains a higher fat concentration, increasing its caloric value.4,22 Fat content progressively increases during breastfeeding due to stimulation of the mammary glands, which triggers the release of lipid globules adhered to the alveoli. During breast emptying, changes in lactocytes facilitate the removal of fat accumulated in the alveoli and ducts.23 Muktamath et al.4 recommend feedings of 15 to 20 min to stimulate ongoing milk production and ensure an adequate nutrient supply. Breastfeeding very short (less than 10 min) may reduce fat intake and compromise human milk production. This highlights the importance of complete breast emptying to ensure both the volume and nutritional quality of human milk.
Fatty acids
Considering that approximately 40 to 60% of the total energy provided by human milk comes from lipids,6,20 it is essential to understand the dynamics of fatty acids throughout the breastfeeding period. In this study, 27 fatty acids were identified in mature human milk samples (Table 1), allowing the evaluation of changes in the lipid profile and supply to the infant.
Fatty acid composition (relative area percentage) during different breastfeeding intervals of mature human milk from individual mothers
The highest concentrations of fatty acids found in samples M2T1, M2T2, M2T3, M3T1, M3T2, M3T3, M4T1, M4T2, M4T3 were specifically assigned to oleic acid (18:1n-9), while in samples M1T1, M1T2, M1T3 and M5T1, M5T2, M5T3 were palmitic acid (16:0), therefore distinct lipid profiles were observed. These two fatty acids, together with linoleic acid (18:2n-6), represent the main lipid components of human milk, contributing significantly to the fractions of saturated (ΣSFA), monounsaturated (ΣMUFA), and polyunsaturated (ΣPUFA) fatty acids.24 Differences may reflect variations in maternal diet or endogenous fatty acid synthesis, underscoring the importance of personalized approaches in nutritional assessments.5
The most abundant SFA was 16:0, with variations between 19.776 ± 0.023 (M4T3) and 28.685 ± 0.158 (M1T2). In human milk, 16:0 is found in the central position of the triglyceride molecule (Sn-2),25 while in human tissues, vegetable oils, and infant formulas, it is located at the Sn-1 and Sn-3 extremities. The specific structure of human milk contributes to the absorption of minerals such as calcium and magnesium, in addition to promoting intestinal health.26 The 18:1n-9, the main MUFA identified, demonstrated differences between samples (p < 0.05) ranging from 21.751 ± 0.004 (M5T1) and 29.155 ± 0.162 (M2T2). Generally positioned in the Sn-1 and Sn-3 positions of human milk triglycerides,25 it acts in the organization, transport, and metabolism of fat globules, performing functions as an energy source, brain structuring, and in the absorption of fats in the small intestine.8,27 The PUFA with the highest concentration was 18:2n-6, presenting significant differences (p < 0.05) between breastfeeding times (T1, T2, and T3) in the samples, except M1. This fatty acid provides approximately 10% of the calories derived from the lipid fraction.28 The sum of the fatty acids 16:0, 18:1n-9, and 18:2n-6 represents approximately 70% of the lipid profile of human milk,29 agreeing with the results obtained in this study.
Furthermore, other important fatty acids have been found in human milk, including alpha-linolenic acid (18:3n 3), arachidonic acid (ARA, 20:4n-6), eicosapentaenoic acid (EPA, 20:5n-3), and docosahexaenoic acid (DHA, 22:6n 3). These are recognized for their essential role in infant growth, brain development, immune function, and cognitive performance.5,30
The 18:3n-3 presented the highest percentage in the M4T1 (1.603 ± 0.022) and M4T2 (1.591 ± 0.002) samples, indicating that in this interval the sample did not present a significant difference (p > 0.05). In contrast, the lowest values were observed in M1T1 (0.548 ± 0.003), M1T2 (0.549 ± 0.006), and M1T3 (0.545 ± 0.002) regardless of the feeding time, with no significant differences (p > 0.05), which indicates that the 30 min milking duration did not interfere in its concentration. For ARA, the highest concentration was observed in the M5T2 sample (0.547 ± 0.026), with a statistically significant difference (p < 0.05) to the others. Samples such as M2T2 and M3T2 presented intermediate and statistically similar values (p > 0.05), reflecting interindividual variations.
Regarding EPA, the highest value was found in M3T3, with a content approximately ten times higher than that of samples M1 and M2. DHA was more abundant in sample M4, with a concentration approximately seven times higher than that observed in M1. These variations reflect, above all, the influence of maternal diet on the lipid composition of human milk. Diets rich in fish and foods that are sources of omega-3 times higher concentrations of DHA and EPA, while restrictive eating habits, such as vegan diets, can significantly reduce these levels in human milk.31,32 Concomitantly, Ding et al.33 report that these distinctions can be attributed to differences in the diets of the nursing mothers investigated.
Furthermore, there were variations in the total fatty acid content for ∑SFA, ∑MUFA, and ∑PUFA, where no conclusive observations of changes in the lipid profile were demonstrated during breastfeeding. For ∑SFA, a range was obtained between 44.862 ± 0.167 (M4T2), and 56.740 ± 0.237 (M5T3), while for ∑MUFA, values between 25.375 ± 0.044 (M5T1) to 33.923 ± 0.342 (M2T2), and for ∑PUFA, percentages between 11.617 ± 0.150 (M1T2) to 25.703 ± 0.043 (M4T1). Milk fat concentration increases at the end of the feed due to breast emptying,23 which affects the fatty acid profile. This variation suggests a physiological strategy of adjusting lipid composition throughout the feed, potentially to meet the metabolic and neurological needs of the infant.34,35 In addition, factors such as maternal diet, age, and health status are also important determinants of the individual lipid profile, as suggested by Covaciu et al.34 and Valencia-Naranjo et al.,35 which reinforces the need for a personalized approach in the assessment of human milk.
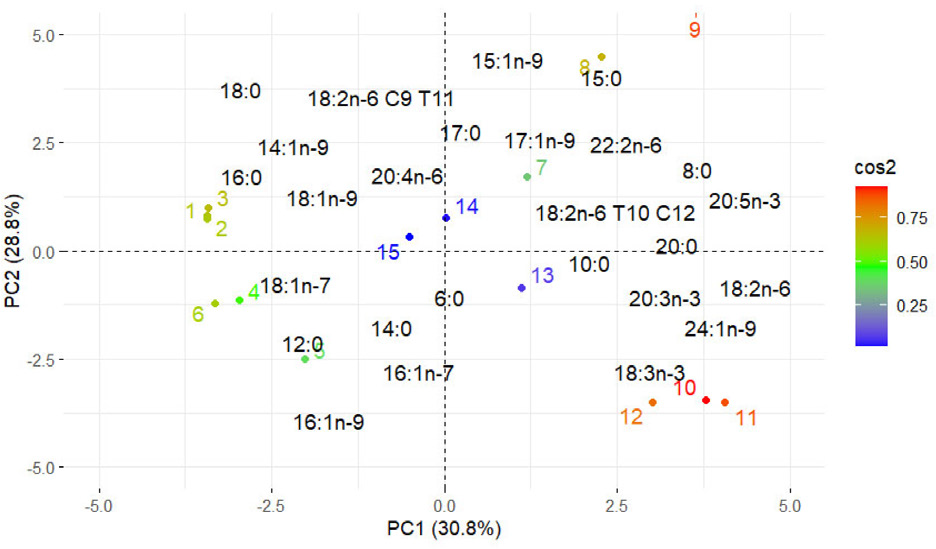
The fatty acid composition was also assessed by multivariate exploration of principal component analysis (PCA) (Figure 3). PC1 (30.8%) and PC2 (28.8%) accounted for 59.6% of the overall variance of the fatty acid results. The quality of representation of each variable in the principal components was estimated by the cos2 values, with values close to 1 indicating a strong association of the variable with the principal axes. In the graph, such values are visually highlighted by a color gradient that helps in the interpretation of the individual contribution of each variable. High cos2 values are highlighted in red, while the lowest tend to appear in blue. In this sense, it was observed that the samples (scores) from the same lactating woman tended to group in the same quadrant of the PCA, indicating consistency in the lipid composition between the different sample collection times.
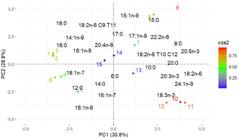
PCA biplot with cos2 scale of fatty acid composition M1T1 (1), M1T2 (2), M1T3 (3), M2T1 (4), M2T2 (5), M2T3 (6), M3T1 (7), M3T2 (8), M3T3 (9), M4T1 (10), M4T2 (11), M4T3 (12), M5T1 (13), M5T2 (14), M5T3 (15).
In this sense, samples M4T1, M4T2, and M4T3 (scores 10, 11, and 12) stood out with high representation in the PCA (cos2 > 0.75), strongly associated with fatty acids (loadings) including PUFAs 18:3n-3, 24:1n-9, 20:3n-3 and 18:2n-6. These findings corroborate the greater association with ∑PUFAs in M4. In contrast, samples M5T1, M5T2, and M5T3 (scores 13, 14, and 15) showed low significance (cos2 < 0.25) for the variables, since they were placed close to the center of the axes, suggesting a little changed composition. Samples M1T1, M1T2, and M1T3 (scores 1, 2, and 3) were grouped in the quadrant between negative PC1 and positive PC2, reflecting intermediate stability in the lipid profile of 16:0, 18:0, 14:1n-9 and CLA c9t11 at different collection times. Samples M2T1, M2T2, and M2T3 (scores 4, 5, and 6) were closely related, indicated for fatty acids 6:0, 12:0, 14:0, 16:1n-7. Furthermore, it is worth highlighting that the samples M3T1, M3T2, and M3T3 (scores 7, 8, and 9) showed progressive variations throughout the breastfeeding time, with increasing contribution for the fatty acids 20:5n-3, 18:2n-6 T10c12 and 22:2n-6, reflecting lower significance in T1 and higher in T3.
The literature indicates that breast stimulation throughout breastfeeding promotes a progressive increase in fat concentration, due to the release of accumulated lipid globules into the mammary alveoli.23 Like this, the findings reinforce the heterogeneity in the fatty acid composition among lactating women, showing that the lipid composition of human milk is influenced by multiple factors, especially maternal dietary habits and individual physiological characteristics. Furthermore, the composition of human milk is naturally personalized, being biologically adapted by each mother to meet the individual nutritional needs of her newborn.2,3
Nutritional quality of fatty acids
The analysis of the lipid composition of human milk throughout the different periods of breastfeeding is essential to identify changes in its composition. To determine the lipid nutritional value, the relationships between individual fatty acids or their groups are indicated.25 Thus, Table 2 presents the results of the related lipid nutritional values between the different breastfeeding periods.
Nutritional quality of fatty acids during different intervals of breastfeeding of mature human milk from individual mothers
To ensure a more accurate understanding of the impact of the diet of lactating mothers on infant health, it is important to continually deepen the definition of lipid nutritional quality. In this study, eight nutritional indexes were established, providing a more comprehensive view of the influence of these indexes on cardiovascular health.36
The ∑PUFA/SFA index is used to evaluate the effect of PUFAs relative to SFAs on low-density lipoprotein (LDL) levels. PUFAs tend to reduce LDL levels and, consequently, plasma cholesterol, whereas SFAs generally increase these levels. In the present study, ∑PUFA/SFA values ranged from 0.211 ± 0.001 (M1T1) to 0.581 ± 0.004 (M4T3), with significant differences (p < 0.05). It was observed that, except for mother M3, which showed an increase from 0.411 ± 0.001 (M3T1) to 0.450 ± 0.004 (M3T3), there was no continuous increase in ∑PUFA/SFA throughout the breastfeeding period. According to Maheshwari,28 PUFAs in human milk can derive from the maternal diet, body stores, or endogenous synthesis from their precursors promoted in the liver, mammary gland, and other tissues. However, it is important to note that the ∑PUFA/SFA ratio does not account for the fact that some SFAs do not raise plasma cholesterol, nor does it consider the physiological effects of MUFAs in organisms.37,38 Therefore, new equations have been proposed to assess better the impact of fatty acid composition on cholesterol levels.25
The ∑n-6/n-3 index reflects the proportion of n-6 and n-3 series fatty acids, which compete for the same metabolic pathways and share desaturase and elongase enzymes.25 Through ∑n-6/n-3, possible imbalances in the concentration of essential fatty acids resulting from endogenous synthesis are indicated, reflecting as a response to maternal diet and an important predictor of infant health.39 n-6 fatty acids are associated with inflammatory processes, while n-3 fatty acids have anti-inflammatory properties.40 In the present study, ∑n-6/n-3 values ranged from 5.613 ± 0.148 (M1T3) to 7.978 ± 0.248 (M3T2). Typically, ∑n-6/n-3 values between 5:1 and 10:1 are recommended to promote a healthy balance and adapt inflammatory responses. However, recommendations for n-6 and n-3 fatty acid intake should consider the interaction between them, since high levels of n-6 increase the need for n-3.41,42
The linoleic/α-linolenic index (LA/ALA, 18:2n-6/18:3n-3) is a guide associated with the diet of strictly essential fatty acids, which are precursors of essential fatty acids (ARA, EPA, DHA), fundamental for immune function and neurodevelopment under normal conditions. The results obtained ranged from 11.868 ± 0.047 (M5T1) to 24.321 ± 0.993 (M3T2), with significant differences (p < 0.05). The CODEX Alimentarius recommends a ratio between 5:1 and 15:1 for the consumption of infant formulas.43 Given this, only mothers M4 and M5 were within the recommended range (LA/ALA < 15) in T1 and T2, except M5T3. It is highlighted in Table 1 that M4 and M5 presented significantly higher concentrations of ALA, which may have contributed to the balance of the index. However, in the study by Toro-Ramos et al.,44 a LA/ALA ratio of 23:1 was identified, elucidating the competition of these fatty acids for the same enzymes during metabolism.
EPA+DHA assesses lipid nutritional quality, reflecting the combination of these essential n-3 fatty acids for human health. EPA and DHA play crucial roles in the development and proper functioning of the brain and retina, and also in modulating the inflammatory response.5 The sum of EPA and DHA ensures that the nutritional requirements of these essential fatty acids are adequately met. The fatty acid 18:3n-3 is the precursor responsible for the synthesis of EPA (20:5n-3), which subsequently converts into DHA (22:6n-3).45 In the present study, the values obtained for EPA+DHA ranged from 0.092 ± 0.042 (M1T2) to 0.624 ± 0.029 (M3T3), with significant differences. Furthermore, no significant variations were observed between samples M1, M2 and M4. It is worth noting that M3T3 had the highest content of EPA and DHA fatty acids among all samples, according to Table 1.
The hypocholesterolemic/hypercholesterolemic (H/H) index assesses the specific effects of fatty acids on cholesterol metabolism, reflecting the ability of fatty acids to influence low-density lipoprotein (LDL) levels, which are associated with the development of cardiovascular diseases. High H/H values indicate a predominance of fatty acids with hypocholesterolemic properties, i.e., which reduce LDL levels and promote cardiovascular health. In the present study, H/H values ranged from 0.851 ± 0.006 (M5T3) to 1.361 ± 0.010 (M4T3), with significant differences. These results align with Ientz et al.,37 who analyzed the H/H index in human milk colostrum. Higher H/H values, as observed in M4T3, suggest a higher concentration of fatty acids beneficial to health, showing advantages for preventing cardiovascular diseases. However, the interpretation of these values should consider the relationship between hypocholesterolemic and hypercholesterolemic fatty acids, the dietary context, and the individual factors that may influence lipid metabolism.
The atherogenicity (AI) and thrombogenicity (TI) indexes are crucial for health cardiovascular since they address the fatty acids that influence the blockage of arteries. The AI relates the action of pro-atherogenic fatty acids (12:0, 14:0, and 16:0) on the adhesion of lipids to the cells of the circulatory system, while antiatherogenic fatty acids (unsaturated fatty acids) inhibit this adhesion and reduce the concentration of cholesterol and esterified fatty acids in the blood.46 The TI index represents the tendency to form clots in blood vessels, assigning prothrombotic properties to fatty acids 14:0, 16:0, and 18:0, and antithrombotic effects to MUFAs of the n-3 and n-6 series.47 The AI values ranged from 1.102 ± 0.004 (M3T3) to 1.866 ± 0.006 (M5T1), indicating different levels of cardiovascular risk between samples. M1, M4, M3T1/M3T2, and M2T1/M2T3 showed stability in AI throughout the intervals. TI values ranged from 0.950 ± 0.008 (M4T3) to 1.713 ± 0.019 (M1T2), with stability in M1, M4, M3T1/M3T2 and M5T1/M5T2 until mid-milk, followed by a reduction in the hindmilk of M3 and an increase in that of M5. The other samples showed significant variations in AI and TI over time, evidencing changes in the lipid profile.
The health promotion index (HPI) assesses the protective effect of fatty acid composition against cardiovascular diseases.47 The HPI is usually calculated as the inverse of AI, with higher values indicating greater benefit to human health. The values indicated for dairy products range from 0.16 to 0.68.40,48 The results obtained for the HPI ranged from 0.536 ± 0.001 (M5T1) to 0.907 ± 0.008 (M3T3), with significant differences between samples. Thus, the results suggest a potential benefit, with values tending towards the upper recommended range. Although the highest HPI value was observed in M3T3, with a significant increase, values for M3T1 and M3T2 remained constant, suggesting an improvement in the late phase of lipid quality. Notably, HPI remained stable across all intervals in M1 and M4, mirroring the behavior observed for IA and IT. Furthermore, the HPI of M2T1 was similar to M2T3, indicating stability between the beginning and end of breastfeeding.
IL-10 and TNF-α content
Human milk contains a variety of cytokines that play crucial roles in the development of the immature immune system of the newborn. Among these, TNF-α and IL-10 are particularly noteworthy.9 In this study, the concentrations of TNF-α and IL-10 were measured at different intervals of human milk expression from individual lactating women. The results are summarized in Table 3.
Concentration of cytokines tumor necrosis factor alpha (TNF-α) and interleukin-10 (IL-10) during different intervals of breastfeeding of mature human milk from individual mothers
The cytokines found in human milk are essential for newborns, who have limited endogenous production of immune mediators.9 These cytokines play a key role in activating the immune system and regulating inflammatory processes. TNF-α has a pro-inflammatory function, while IL-10 acts as an anti-inflammatory agent, helping to balance the immune response.5
In the present study, TNF-α was below the limit of detection in samples M2T3, M4T1, M4T2, M4T3, and M5T1. On the other hand, sample M2T2 presented a high value (11.020 ± 0.050), compared with the initial value of M2T1 (0.695 ± 0.039), which demonstrates changes associated with breastfeeding time and possibly mammary gland stimulation. Trend et al.49 reported that TNF-α detection is more common in colostrum than in transitional or mature human milk samples, which may explain the lack of detection in some of the samples studied. Furthermore, factors such as the stage of lactation, the health status of the lactating mother, and external aspects such as inflammatory diet and stress may directly influence cytokine concentrations in human milk. The literature indicates that maternal obesity is associated with increased systemic inflammatory activity, since adipose tissue stimulates the production and release of pro-inflammatory cytokines, such as TNF-α, through the activation of immune cells.9 Szyller et al.22 reported mean TNF-α concentrations of around 10.2 pg L-1 in mature human milk from mothers with BMI > 25 kg m-2, while mothers with BMI ≤ 25 kg m-2 showed variations between 9.9 and 10.6 pg mL-1. Similar values were observed in the M2T2 (11.020 ± 0.050) and M5T2 (10.190 ± 0.010) samples, suggesting that these lactating women could present physiological characteristics compatible with the described profiles, such as higher body mass index.
Regarding IL-10, the cytokine was detected in all samples analyzed, with concentrations ranging from 1.382 ± 0.244 (M4T2) to 24.269 ± 0.091 (M2T2). The high levels of IL-10 and TNF-α simultaneously observed in the M2T2 sample may reflect a more active immune response in that breastfeeding interval, possibly due to greater glandular stimulation or the specific physiological condition of the lactating mother. On the other hand, the M4 lactating mother presented low concentrations of IL-10 at all times evaluated, in line with the absence of TNF-α, suggesting lower local immune activation. The other samples presented intermediate values between 8.184 ± 0.056 to 9.532 ± 0.156 in M1T1 and M1T3, 3.173 ± 0.148 to 4.777 ± 0.148 pg mL-1 in M3T1 and M3T2, 1.382 ± 0.244 and 3.566 ± 0.089 pg mL-1 in M4T2 and M4T1, respectively. Froń and Orczyk-Pawiłowicz9 overweight mothers presented higher mean concentrations of IL-10 (11.3 pg mL-1) compared to eutrophic mothers (8.8 pg mL-1), highlighting the role of nutritional status in cytokine modulation. Other findings correspond to the low IL-10 values in M3 and M4, elucidating the PUFA-rich composition originated from the maternal diet, as described in the PCA analysis. Although nutritional assessment of lactating women was not performed in this study, it is recognized that factors such as diet, body composition, and lifestyle directly influence the immunological profile of human milk.
Despite the relevant findings, this study had limitations, including the small sample size and the absence of maternal dietary records. These factors limit the ability to fully identify what influences breast milk composition. Future studies should include a larger cohort of lactating mothers, incorporate longitudinal assessments, and consider physiological data, such as maternal diet and body composition, to provide a more comprehensive understanding.
Conclusions
The findings of this study show that breastfeeding duration significantly influences the composition of human milk, especially its energy content and lipid profile. A progressive increase in the caloric value of human milk was observed throughout the breastfeeding period, with marked variations among lactating women, suggesting the influence of factors such as diet, lifestyle, and mammary gland stimulation. The fatty acid composition showed distinct profiles among lactating women. M2, M3, and M4 stood out with a predominance of oleic acid (18:1n 9), while in M1 and M5T1, palmitic acid (16:0) was more prevalent. PCA analysis revealed a progressive increase in fatty acids throughout the breastfeeding period in M3, a higher concentration of PUFAs in M4, and stability in the lipid profile in M1, M2, and M5. Such variations suggest that the nutritional quality of fatty acids may reflect both the mother’s body stores. Regarding immunological markers, TNF-α and IL-10 did not show a clear pattern throughout the breastfeeding period, but showed variability among lactating women, indicating the influence of individual factors. Continuous breast stimulation promotes a gradual increase in the concentration of fat and calories, due to the release of lipid globules accumulated in the mammary alveoli. Thus, breastfeeding time, maternal health, and nutritional status demonstrate a fundamental role in modulating the composition of human milk, which is strongly influenced by endogenous reserves and individual characteristics.
Data Availability Statement
Data will be made available on request.
Acknowledgments
The authors are grateful to the Coordenação de Aperfeiçoamento de Pessoal de Nível Superior (CAPES), the Conselho Nacional de Desenvolvimento Científico e Tecnológico (CNPq) (No. 316123/2023-4-Oscar Oliveira Santos, No. 306514/2023-0-Jesui Vergilio Visentainer), the Fundação Araucária de Apoio ao Desenvolvimento Científico, the Fundação Cargill, and the Programa Pesquisa para o SUS (PPSUS) for their financial support. They also thank the APLE-A/CNPq research group and the Human Milk Bank of the University Hospital of Maringá for their partnership and donation of human milk samples.
References
-
1 World Health Organization (WHO); Exclusively Breastfeed for 6 Months; Geneva: WHO, 2025. [Link] accessed in June 2025
» Link -
2 Thakkar, S. K.; Giuffrida, F.; Cristina, C.; De Castro, C. A.; Mukherjee, R.; Tran, L.; Steenhout, P.; Lee, L. Y.; Destaillats, F.; Am. J. Hum. Biol. 2013, 25, 770. [Crossref]
» Crossref -
3 Samuel, T. M.; Zhou, Q.; Giuffrida, F.; Munblit, D.; Verhasselt, V.; Thakkar, S. K.; Front. Nutr. 2020, 7, 576133. [Crossref]
» Crossref -
4 Muktamath, V.; Sunitha, N. H.; Ravi, Y.; R. Hegde, P.; Biradar, S.; Saptagiri, T. V.; Ilager, S. In Clinical Guidance in Breastfeeding - Physiology, Success, and Challenge; Say, B. L., ed.; IntechOpen, 2025. [Crossref]
» Crossref -
5 Castro, M. C.; Oliveira, F. S.; Alves, E. S.; Zacarias, J. M. V.; Alencar, J. B.; da Silva, J. M.; Visentainer, J. E. L.; Santos, O. O.; Visentainer, J. V.; Ichisato, S. M. T.; J. Braz. Chem. Soc. 2022, 34, 201. [Crossref]
» Crossref -
6 Marques, M. C.; Perina, N. P.; Mosquera, E. M. B.; Tomé, T. M.; Lazarini, T.; Mariutti, L. R. B.; Food Res. Int. 2021, 149, 110698. [Crossref]
» Crossref -
7 Fusch, G.; Rochow, N.; Choi, A.; Fusch, S.; Poeschl, S.; Ubah, A. O.; Lee, S.-Y.; Raja, P.; Fusch, C.; Clin. Nutr. 2015, 34, 465. [Crossref]
» Crossref -
8 Alves, E.; Castro, M. C.; Saqueti, B. H. F.; Manin, L. P.; da Silveira, R.; Souza, P. M.; Santos, O. O.; Visentainer, J. V.; J. Braz. Chem. Soc. 2021, 32, 1884. [Crossref]
» Crossref -
9 Froń, A.; Orczyk-Pawiłowicz, M.; Nutrients 2023, 15, 5016. [Crossref]
» Crossref -
10 Hawkes, J. S.; Bryan, D.-L.; James, M. J.; Gibson, R. A.; Pediatr. Res. 1999, 46, 194. [Crossref]
» Crossref -
11 Agência Nacional de Vigilância Sanitária (ANVISA); Banco de leite Humano: Funcionamento, Prevenção e Controle de Riscos; Brasília: Anvisa, 2008. [Link] accessed in June 2025
» Link -
12 Folch, J.; Lees, M.; Stanley, G. H. S.; J. Biol. Chem. 1957, 226, 497. [Crossref]
» Crossref -
13 ISO 12966:2/2017: Animal and Vegetable Fats and Oils - Gas Chromatography of Fatty Acid Methyl Esters - Part 2: Preparation of Methyl Esters of Fatty Acids; ISO: Geneva, 2017. [Link] accessed in June 2025
» Link - 14 Statistica, version 7.0; Statsoft Inc. Statsorft, Tulsa, OK, USA, 2004.
- 15 RStudio, version 2023.09.1+494; RStudio, Boston, MA, USA, 2023.
-
16 Lucas, A.; Gibbs, J. A.; Lyster, R. L.; Baum, J. D.; BMJ 1978, 1, 1018. [Crossref]
» Crossref -
17 Rydlewski, A. A.; Pizzo, J. S.; Manin, L. P.; Zappielo, C. D.; Galuch, M. B.; Santos, O. O.; Visentainer, J. V.; Rev. Virtual Quim. 2020, 12, 155. [Crossref]
» Crossref -
18 de Moraes, P. S.; de Oliveira, M. M. B.; Dalmas, J. C.; Rev. Paul. Pediatr. 2013, 31, 46. [Crossref]
» Crossref -
19 Merlino Barr, S.; Groh-Wargo, S.; Semin. Fetal Neonatal Med. 2022, 27, 101392. [Crossref]
» Crossref -
20 Ross, M. G.; Kavasery, M. P.; Cervantes, M. K.; Han, G.; Horta, B.; Coca, K. P.; Costa, S. O.; Desai, M.; Children 2024, 11, 141. [Crossref]
» Crossref -
21 Stellwagen, L. M.; Vaucher, Y. E.; Chan, C. S.; Montminy, T. D.; Kim, J. H.; Breastfeed. Med. 2013, 8, 205. [Crossref]
» Crossref -
22 Szyller, H.; Antosz, K.; Batko, J.; Mytych, A.; Dziedziak, M.; Wrześniewska, M.; Braksator, J.; Pytrus, T.; Nutrients 2024, 16, 1487. [Crossref]
» Crossref -
23 Mizuno, K.; Nishida, Y.; Taki, M.; Murase, M.; Mukai, Y.; Itabashi, K.; Debari, K.; Iiyama, A.; Int. Breastfeed. J. 2009, 4, 7. [Crossref]
» Crossref -
24 Rydlewski, A. A.; Manin, L. P.; Pizzo, J. S.; Silva, P. D.; da Silveira, R.; Tavares, C. B. G.; de Paula, M.; Pereira, O.; Santos, O. O.; Visentainer, J. V.; J. Food Compos. Anal. 2021, 100, 103797. [Crossref]
» Crossref -
25 Alves, E. S.; Castro, M. C.; Saqueti, B. H. F.; Manin, L. P.; Alencar, J. B.; Zacarias, J. M. V.; Bruni, A. R. S.; Madrona, G. S.; Visentainer, J. E. L.; Cristianini, M.; Santos, O. O.; Visentainer, J. V.; J. Braz. Chem. Soc. 2024, 35, e20230102. [Crossref]
» Crossref -
26 Ojo-Okunola, A.; Cacciatore, S.; Nicol, M. P.; du Toit, E.; Metabolites 2020, 10, 77. [Crossref]
» Crossref -
27 Devaraj, S.; Giuffrida, F.; Hartweg, M.; Estorninos, E. M.; Buluran, K. B.; Lawenko, R. B.; Thakkar, S. K.; Samuel, T. M.; Prostaglandins, Leukotrienes Essent. Fatty Acids 2023, 190, 102543. [Crossref]
» Crossref -
28 Maheshwari, A.; Newborn 2022, 1, 384. [Crossref]
» Crossref -
29 Zhang, Z.; Wang, Y.; Yang, X.; Cheng, Y.; Zhang, H.; Xu, X.; Zhou, J.; Chen, H.; Su, M.; Yang, Y.; Su, Y.; Adv. Nutr. 2022, 13, 2519. [Crossref]
» Crossref -
30 Nguyen, M. T. T.; Kim, J.; Seo, N.; Lee, A. H.; Kim, Y.-K.; Jung, J. A.; Li, D.; To, X. H. M.; Huynh, K. T. N.; Van Le, T.; Israr, B.; Nazir, A.; Seo, J.-A.; Lee, D.; An, H. J.; Kim, J.; J. Dairy Sci. 2021, 104, 6496. [Crossref]
» Crossref -
31 Cimatti, A. G.; Martini, S.; Munarini, A.; Zioutas, M.; Vitali, F.; Aceti, A.; Mantovani, V.; Faldella, G.; Corvaglia, L.; Front. Pediatr. 2018, 6, 407. [Crossref]
» Crossref -
32 von Schacky, C.; Nutrients 2020, 12, 898. [Crossref]
» Crossref -
33 Ding, Z.; Liu, G.-L.; Li, X.; Chen, X.-Y.; Wu, Y.-X.; Cui, C. C.; Zhang, X.; Yang, G.; Xie, L.; Prostaglandins, Leukotrienes Essent. Fatty Acids 2016, 109, 66. [Crossref]
» Crossref -
34 Covaciu, F. D.; Feher, I.; Molnar, C.; Floare-Avram, V.; Dehelean, A.; Anal. Lett. 2023, 56, 344. [Crossref]
» Crossref -
35 Valencia-Naranjo, A.; Manjarres-Correa, L. M.; Bermúdez Cardona, J.; Curr. Res. Food Sci. 2022, 5, 789. [Crossref]
» Crossref -
36 Caicedo-Paz, A. V.; Mediavilla, M.; Farías, C.; Valenzuela, R.; Mussagy, C. U.; Martinez-Galan, J. P.; Process Biochem. 2024, 144, 160. [Crossref]
» Crossref -
37 Ientz, G. A. S.; Alves, E. S.; Castro, M. C.; Frigo, G.; Tavares, C. B. G.; Visentainer, J. E. L.; Santos, O. O.; Visentainer, J. V.; J. Braz. Chem. Soc. 2023, 34, 1887. [Crossref]
» Crossref -
38 Neia, V. J. C.; Landi Masquio, D. C.; Claudino, P. A.; Duso, P.; Tadano, D. K.; Bolognese, M. A.; Magalhães de Souza, P.; Santos, O. O.; Visentainer, J. V.; Molin Netto, B. D.; Clin. Nutr. ESPEN 2023, 57, 288. [Crossref]
» Crossref -
39 Srinivas, V.; Varma, S.; Kona, S. R.; Ibrahim, A.; Duttaroy, A. K.; Basak, S.; Prostaglandins, Leukotrienes Essent. Fatty Acids 2023, 191, 102566. [Crossref]
» Crossref -
40 Chen, J.; Liu, H.; Int. J. Mol. Sci. 2020, 21, 5695. [Crossref]
» Crossref -
41 Novak, E. M.: Dietary Omega-3 and Omega-6 Fatty Acids and Neonatal Liver Metabolism; PhD Thesis, University of British Columbia, Vancouver, Canada, 2011. [Link] accessed in June 2025
» Link -
42 Institute of Medicine the National Academies Press; Dietary Reference Intakes for Energy, Carbohydrate, Fiber, Fat, Fatty Acids, Cholesterol, Protein, and Amino Acids; National Academies of Sciences, Engineering, and Medicine: Washington, USA, 2005. [Link] accessed in June 2025
» Link -
43 Codex Alimentarius; Standard for Infant Formula and Formulas for Special Medical Purposes Intended for Infants; Codex: International Food Standard, 1981-2023. [Link] accessed in June 2025
» Link -
44 Toro-Ramos, T.; Méio, M. D. B. B.; Morsch, D. S.; Moreira, M. E. L.; do Carmo, M. G. T.; Sichieri, R.; Hoffman, D. J.; J. Hum. Growth Dev. 2013, 23, 270. [Crossref]
» Crossref -
45 Shah, R.; Sabir, S.; Alhawaj, A. F. In Physiology, Breast Milk; StatPearls: Treasure Island, USA, 2020. [Link] accessed in June 2025
» Link -
46 Farková, V.; Křížová, L.; Dadáková, K.; Farka, Z.; Mascrez, S.; Eggermont, D.; Purcaro, G.; Kašparovský, T.; Food Chem. 2024, 448, 139042. [Crossref]
» Crossref -
47 El Kourchi, C.; Belhoussaıne, O.; Elhrech, H.; Harhar, H.; Ullah, R.; Bari, A.; Maggi, F.; Caprioli, G.; Bouyahya, A.; Tabyaouı, M.; J. Agric. Food Res. 2024, 16, 101197. [Crossref]
» Crossref -
48 Liao, G.; Han, H.; Wang, T.; Li, H.; Qian, Y.; Zhu, M.; Jia, Q.; Qiu, J.; Food Chem. 2024, 460, 140427. [Crossref]
» Crossref -
49 Trend, S.; Strunk, T.; Lloyd, M. L.; Kok, C. H.; Metcalfe, J.; Geddes, D. T.; Lai, C. T.; Richmond, P.; Doherty, D. A.; Simmer, K.; Currie, A.; Br. J. Nutr. 2016, 115, 1178. [Crossref]
» Crossref
Edited by
-
Editor handled this article:
Andrea R. Chaves (Executive)