Bioprospecting Ultrasound-Assisted Phenolic Extracts from Psidium guineense: Antioxidant, Antimicrobial and UV Protection Potential
Abstract
Araçá (Psidium guineense Sw.) fruits were collected in Belém and freeze-dried for 72 h. An ultrasound-assisted extraction method was optimized using a central composite design (23) to evaluate the effects of ethanol concentration, solid-liquid ratio (SLR), and extraction time on total phenolics content (TPC) and antioxidant activity (2,2-diphenyl-1-picrylhydrazyl (DPPH) percentage of radical inhibition). A predictive polynomial model established at a 95% confidence level indicated optimal parameters of 25% ethanol, a 1:5 SLR, and a 10 min extraction time, yielding 304.6 ± 7.7 mg gallic acid equivalent (GAE) g-1 of TPC and 59.5 ± 1.7% DPPH inhibition. The optimized extract also inhibited β-carotene lipid peroxidation with an IC50 value (half maximal inhibitory concentration) of 20.9 µg mL-1 and presented a sun protection factor of 16.0 ± 1.0. It contained substantial amounts of total flavonoids and carotenoids: 309.2 ± 17.7 mg quercetin equivalent (QE) g-1 and 108.2 ± 11.1 µg g-1, respectively. Liquid chromatography-electrospray ionization ion trap mass spectrometry (LC-MS/MS) analysis annotated key bioactive compounds, including quinic acid, ellagic acid, valoneic acid dilactone, and caffeoyl-quinic acid, these compounds are responsible for the antioxidant potential. Additionally, the extract demonstrated a bactericidal effect against Staphylococcus aureus, highlighting its potential use as an antiseptic. The bioprospecting of extract supports the potential for new industrial applications of P. guineense fruits, particularly within the cosmetic sector.
Keywords:
experimental design; response surface; ellagic acid; Myrtaceae
Introduction
The Myrtaceae family is a vast and diverse group of plants, with the neotropical genus Psidium being one of the most economically significant. This genus includes approximately 112 species, of which 60 are found in Brazil. These species are distributed across all biomes and various phytogeographic domains, showcasing a high level of diversification.1,2 Many Psidium species are commonly known as “araçás” and recognized as valuable genetic resources for breeding programs and medicinal purposes due to their reported pharmacological properties. These properties include analgesic, anthelminthic, and antihyperglycemic effects, among others, for different species.3
Psidium guineense Sw., commonly known as “araçá”, produces yellow fruits when ripening and is widely found in the Brazilian Amazon region, despite not being endemic there.2 In the Amazon, “araçá”, plays a significant role in the local economy, where it is both consumed fresh and used in traditional medicine for its healing properties.4 It is recognized for its anti-inflammatory effects and its potential in preventing chronic diseases such as hypertension and diabetes, among others.5
The medicinal plants contain many bioactive compounds, including carotenoids, phenolic acids, and flavonoids.6,7 These compounds exhibit several beneficial activities, such as antioxidant,8 photoprotective,9 and antimicrobial properties that can be useful to protect both the food and physiological systems against oxidation.10 In physiological systems, such as skin tissue and antioxidant compounds are crucial in combating free radicals and mitigating their harmful oxidative effects.11 As free radicals are commonly generated during the skin aging process through chemical and enzymatic oxidation, they are responsible for oxidative damage, which lead to cellular damage and tissue degeneration.12 In this framework, the overproduction of free radicals can be exacerbated by external factors, such as prolonged and unprotected exposure to ultraviolet rays.13
In recent years, there has been an increase in the search for cosmetics with natural ingredients and free synthetic substances that present a certain degree of toxicity.14,15 However, studies reported the difficulty of incorporating natural extracts into cosmetic products due to the amount of solvent used and energy expended. Thus, the industrial processes require more productive stages, generating products with high added value, considering cost, quality, and consumer market.16,17
The choice of extraction techniques for bioactive compounds present in plant material is essential to define the efficiency of the process and whether it can be scaled for industrial applications. Previous studies18 in Myrtaceae species point to ultrasound-assisted extraction (UAE) as the most efficient technique, with enhanced compound preservation, sustainable and viable for large-scale production. The technique consists of the cavitation phenomenon in which ultrasound waves induce the rupture of the plant cell wall and release the bioactive compounds into the medium. Combining the UAE technique with the optimization of factors influencing extraction allows maximizing the yield and quality of the extract obtained.18,19
Considering the current need for searching natural products that are efficient to protect physiological systems against oxidative damage, this study focused on investigating the optimization of the ultrasound-assisted extraction of phenolic compounds from P. guineense fruits to provide viability of their industrial application. Furthermore, the antioxidant and antimicrobial properties along with the determination of sun protection factor were carried out for the extract aiming future applications against skin aging and exposure to solar radiation.
Experimental
Psidium guineense fruits: collection and processing
Fruits of Psidium guineense Swartz were collected in October 2021 on the municipality of Maracanã, state of Pará, Brazil (0°45’57.4”S 47°27’18.9”W). The botanical identification was performed by comparison with an authentic specimen, and a voucher (MG 243650; EMVFA-127) was incorporated into the Herbarium of Museu Paraense Emílio Goeldi. The registration of access to the genetic heritage in Sistema Nacional de Gestão do Patrimônio Genético (SisGen) was carried out under the number A87FCB3. The ripe fruits were taken to the Bioprospecting and Technological Innovation of Natural Products of the Amazon laboratory - BITPNA/ICB-UFPA, where the whole fruits were sanitized, cut and frozen before freeze-drying for 72 h. The freeze-dried fruits were crushed and stored under refrigeration (4 °C) until use.
Ultrasound-assisted extraction (UAE) of phenolic compounds from Psidium guineense fruits
Optimization of UAE
The UAE conditions for the extraction of phenolic compounds from P. guineense fruits were optimized by the response surface methodology (RSM) using a central composite factorial design with 3 independent variables (23), at 2 levels (-1 and +1), with 3 repetitions at the central point, totaling 11 runs.20 The independent variables were percentage of ethanol in water (EtOH, 25 75%), solid/liquid ratio (SLR, 1:5-1:15, m/v) and extraction time (t, 10-30 min), while the dependent variables were the contents of total phenolic compounds (TPC) and scavenging capacity against 2,2-diphenyl-1 picrylhydrazyl radical (DPPH).
The runs for the optimization of the UAE were carried out in vials (125 mL) in an ultrasonic bath at fixed frequency at 40 kHz, X 100 potency (7Lab, model, Brazil), at room temperature (ca. 25 °C), using 0.5 g of freeze-dried fruits added to the solvent in variable percentages of ethanol, solid-liquid ratio, and experimental times. After each selected time, the liquid supernatants were collected to compose the P. guineense extract and directed to the total phenolic compounds and antioxidant capacity assays.
Determination of total phenolic compounds (TPC)
TPCs were determined according to the Folin-Ciocalteu colorimetric method.21 The extracts were diluted in water and 500 µL were reacted with 250 µL of 2 M Folin Ciocalteau solution, followed by the addition of 1250 µL of 7.5% (m v-1) sodium carbonate (Na2CO3) solution. After incubation for 30 min in the dark and room temperature, the absorbance was read at 760 nm using a spectrophotometer (Ultrospec 5300 Pro, Amersham Biosciences, United Kingdom). TPC were determined by analytical curves of gallic acid (2 to 40 mg mL-1, coefficient of determination (R2) = 0.9972) and TPC were expressed as milligrams of gallic acid equivalent per gram of extract (mg GAE g-1).22
In vitro scavenging capacity by DPPH assay
The DPPH free radical scavenging assay was conducted to assess the antioxidant capacity of hydroalcoholic extracts diluted 20 times in methanol. A 50 µL aliquot of the extracts was combined with 1950 µL of a 60 µM DPPH solution and incubated in the dark for 30 min before measuring absorbance at 517 nm. The percentage of DPPH radical inhibition was calculated for each extract (see equation 1), contributing to the experimental planning matrix for optimizing the extract. The IC50 value (half maximal inhibitory concentration) of the concentrated optimized extract was determined using linear regression, and results were expressed as μg per mL based on a standard curve (0.6 to 125 μg mL-1, R2 = 0.9964).23
where Abscontrol is the absorbance of the experiment in the absence of antioxidant, Abssample is the absorbance of the experiment with antioxidant.
Bioactive compounds characterization and biological properties of the concentrated optimized extract
The freeze-dried P. guineense fruits were subjected to the optimized UAE conditions and the liquid supernatant was concentrated in a rotary evaporator at 50 °C to obtain the concentrated extract and stored under refrigeration (4 °C). The extraction yield (%) was calculated by the ratio between the final weight of the concentrated extract and the initial weight of the dried fruit.
Total flavonoids
The total flavonoid content was measured using the aluminum chloride complexation method.24 A methanolic aluminum chloride solution 5% (750 μL) was mixed with a concentrated extract diluted in methanol (250 μL). After a 15-min reaction in the dark, absorbance was measured at 420 nm. The total flavonoid content was calculated using external analytical curves of quercetin (3.125 to 100 µg mL 1, R2 = 0.9973), with results expressed as milligrams of quercetin equivalent per gram of extract (mg QE g-1).
Total carotenoids
The contents of total carotenoids were determined by solubilizing the concentrated extracts in ethanol at 1 mg mL-1. The absorbances of the samples were read at 470, 648 and 664 nm using the spectrophotometer, using ethanol as blank. The pigment contents (chlorophyll a, b and carotenoids) were calculated using equations 2, 3 and 4, and the total carotenoid contents were expressed as µg carotenoids per mg of extract (µg mg-1).25
where Clfa: chlorophyll a concentration; Clfb: chlorophyll b concentration; Cartotal: concentration of total carotenoids; Abs664: absorbance at 664 nm; Abs648: absorbance at 648 nm; Abs470: absorbance at 470 nm.
Phenolic compounds composition by liquid chromatography - mass spectrometry (LC-MS/MS)
Chemical characterization was performed by liquid chromatography-electrospray ionization ion trap mass spectrometry (LC-MS/MS) with a spectrometer (amazon SL Bruker Daltonics®, Massachusetts, USA). The chromatographic analysis was performed on a Luna 5 µm C18 100 Å column (250 × 4.6 mm, Phenomenex, Torrance, USA). The binary gradient mobile phase consisted of 0.1% formic acid (Sigma-Aldrich, St. Louis, Missouri, USA) in water (solvent A) and 0.1% formic acid in methanol (Sigma-Aldrich, St. Louis, Missouri, USA) (solvent B). Compounds were eluted from the analytical column with a 50 min gradient ranging from 5 to 100% solvent B at a constant 1 mL min-1 flow rate. Column compartment temperature set to 40 °C. Data acquisition was performed in negative ionization mode, with fragmentation in multiple stages (MS2 and MS3), according to the following parameters: nebulization gas pressure, 50.0 psi; capillary temperature, 300 °C; transfer capillary input voltage, 4500 V; desolvation gas, nitrogen (N2), flow 10 L min-1; collision gas, helium (He); range acquisition, m/z 50-1200. Raw data were analyzed using Data Analysis 4.3 software (Bruker, Massachusetts, USA).
In vitro antioxidant capacity by lipid peroxidation in β-carotene/linoleic acid system
The lipid peroxidation in the β-carotene/linoleic acid system method was carried out in a 96-well microplate reader (Loccus LRM 96l, Brazil).25,26 The reagent emulsion was composed of β-carotene (1 mg), 5 mL of chloroform, linoleic acid (110 µL), and Tween-20 (1000 µL). To 1 mL of this oily residue obtained after chloroform evaporation, 30 mL of oxygen-rich distilled water were added with vigorous stirring of the emulsion. The decolorization reaction combined 50 μL of the extract (1 mg mL-1 ethanol) and 250 μL of the reagent emulsion. The microplate was incubated at 40 °C with shaking for 120 min, and the percentage of oxidation inhibition was calculated using equation 5. Trolox and butylated hydroxytoluene (BHT) were positive controls in standard curves (37.5 800 μg mL 1) to obtain the IC50.27,28
Antimicrobial activity
The minimum inhibitory concentration (MIC) was verified in the test, according to the M07-A10 standard described by the Clinical and Laboratory Standards Institute.29 Certified strains of the bacteria Bacillus subtilis (ATCC 6633), Escherichia coli (ATCC 25922), Salmonella typhimurium (ATCC 140228) and Staphylococcus aureus (ATCC 25923) were used, provided by the Instituto Evandro Chagas (IEC). In 96-well Elisa plates were added 100 μL of BHI broth and 100 μL of the sample dissolved in dimethyl sulfoxide (DMSO): Brain Heart Infusion (BHI) (1:9 v/v) at concentrations of 250 to 3.9 μg mL-1. Subsequently, 5 μL of the bacterial suspension (1.0 × 10⁶ colony-forming units (CFU) mL-1) were added and incubated at 37 ºC for 24 h. The MIC reading was taken with the addition of 10 μL of 2% aqueous solution of 2,3,5-triphenyltetrazolium chloride (TTC). The antibiotics tetramycin and amoxicillin were used as positive control standards.
In vitro sun protection factor (SPF)
To determine the absorption spectrum at the UV range, the concentrated P. guineense extracts were solubilized in DMSO at 1 mg mL-1. The absorption spectrum in the UV region was determined using the spectrophotometer (UV scanning) with a wavelength range between 200 to 400 nm. Then, the sun protection factor (SPF) was calculated according to equation 6 and Table 1.10-28
Normalized product function (EE × I) at each wavelength used to determine the sun protection factor
where FC = correction factor (= 10); EE (λ) = erythe-matogenous effect of solar radiation at each wavelength (λ); I (λ) = intensity of solar radiation at each wavelength (λ); Abs(λ) = absorbance reading obtained from the sample at each wavelength (λ).
Statistical analysis
All the experiments were carried out in triplicate, and the results were expressed as mean ± standard deviation (SD). The Statistic 7.0® software (StatSoft, Inc., Tulsa, Oklahoma, USA) was applied for the regression and graphical analysis of the optimization procedure by RSM. The analysis of variance (ANOVA) was carried out with 95% confidence (Fisher test). The Tukey’s test was carried out to verify the statistical difference among the means using the Prism 5 Graphpad, Inc. (Harvey Motulsky, USA, 2007) software. The Pearson correlation was carried out using the JAMOVI version 2.3 software (The jamovi Project, Sydney, Australia). The optimized conditions were validated by determining the relative error.31
Results and Discussion
Optimization of the ultrasound-assisted extraction of phenolic compounds from P. guineense fruits
The study presents TPC values and DPPH inhibition percentages from central composite design (CCD) experiments. TPC values ranged from 79.63 to 304.56 mg GAE g-1, with the highest values correlating with greater DPPH inhibition (34.03 to 74.42%). The most effective UAE conditions were found in run 5, using 75% ethanol, a solid/liquid ratio of 1:5, and time of 30 min (Table 2). The extraction process showed low variation in total phenolic compounds (relative standard deviation (RSD) = 13%) and DPPH inhibition percentages (RSD = 3%), indicating good repeatability for the extraction of freeze-dried P. guineense fruits.
Levels of independent variables (EtOH, SLR, time) used in the central composite design (CCD) to optimize the ultrasound-assisted extraction of phenolic compounds from P. guineense fruits and experimental and predicted values of total phenolic compound (TPC mg GAE g-1) contents and antioxidant capacity against DPPH radicals
According to the Pareto charts (Supplementary Information (SI) section, Figure S1), the solid-liquid ratio was the only variable that significantly (p < 0.05) affected the UAE of phenolic compounds and the associated antioxidant capacity, with negative values, being the higher the solid-liquid ratio the lower the contents of TPC and percentage of inhibition of DPPH radical. For the scavenging capacity against DPPH radical, the other non-significant variables (p > 0.05) also presented negative values, which indicated a decrease in the antioxidant capacity as both the percentage of ethanol in water and the extraction time increased. Conversely, for the TPC extraction, the other non-significant variables (p > 0.05) presented positive values, suggesting a tendency to increase the TPC contents as both the percentage of ethanol in water and the extraction time increased.
Studies32 have shown that solvent polarity significantly affects the extracts yield and antioxidant activity of phenolic compounds in plant materials due to their different chemical structures and polarities. Thus, the extraction of antioxidant compounds can be maximized by selecting the optimal organic solvent.33 According to our experiments, the polarity of ethanol contributed to the protection of phenolic products because its structural characteristics confer a high solvent layer, which presents a polar (-OH) and apolar (-CH2CH3) region.34,35
The variation of the ethanol concentration did not significantly affect the extraction of P. guineense fruits, likely due to the solubility of its compounds related to their polarity.36 Since many phenolic antioxidants are polar, this indicates that the compounds of the fruits also possess a polar character. Research has shown that polar organic solvents like ethanol yield higher concentrations of phenolic antioxidants from plant materials.35,36
Through the comprehensive analysis of the Pearson correlations, we can effectively determine the influence, significance, and proportionality of the independent and dependent variables and explain why the parameters of the run 6 (Table 2) achieved the best result. Based on the Pearson correlation (Table S1, SI section), the dependent variables TPC and DPPH radical inhibition were highly positively correlated (Pearson correlation coefficient (r) = 0.847) as the influence of the concentration of phenolic compounds on the antioxidant property is expected since such compounds are known to act as scavengers of DPPH radicals.23
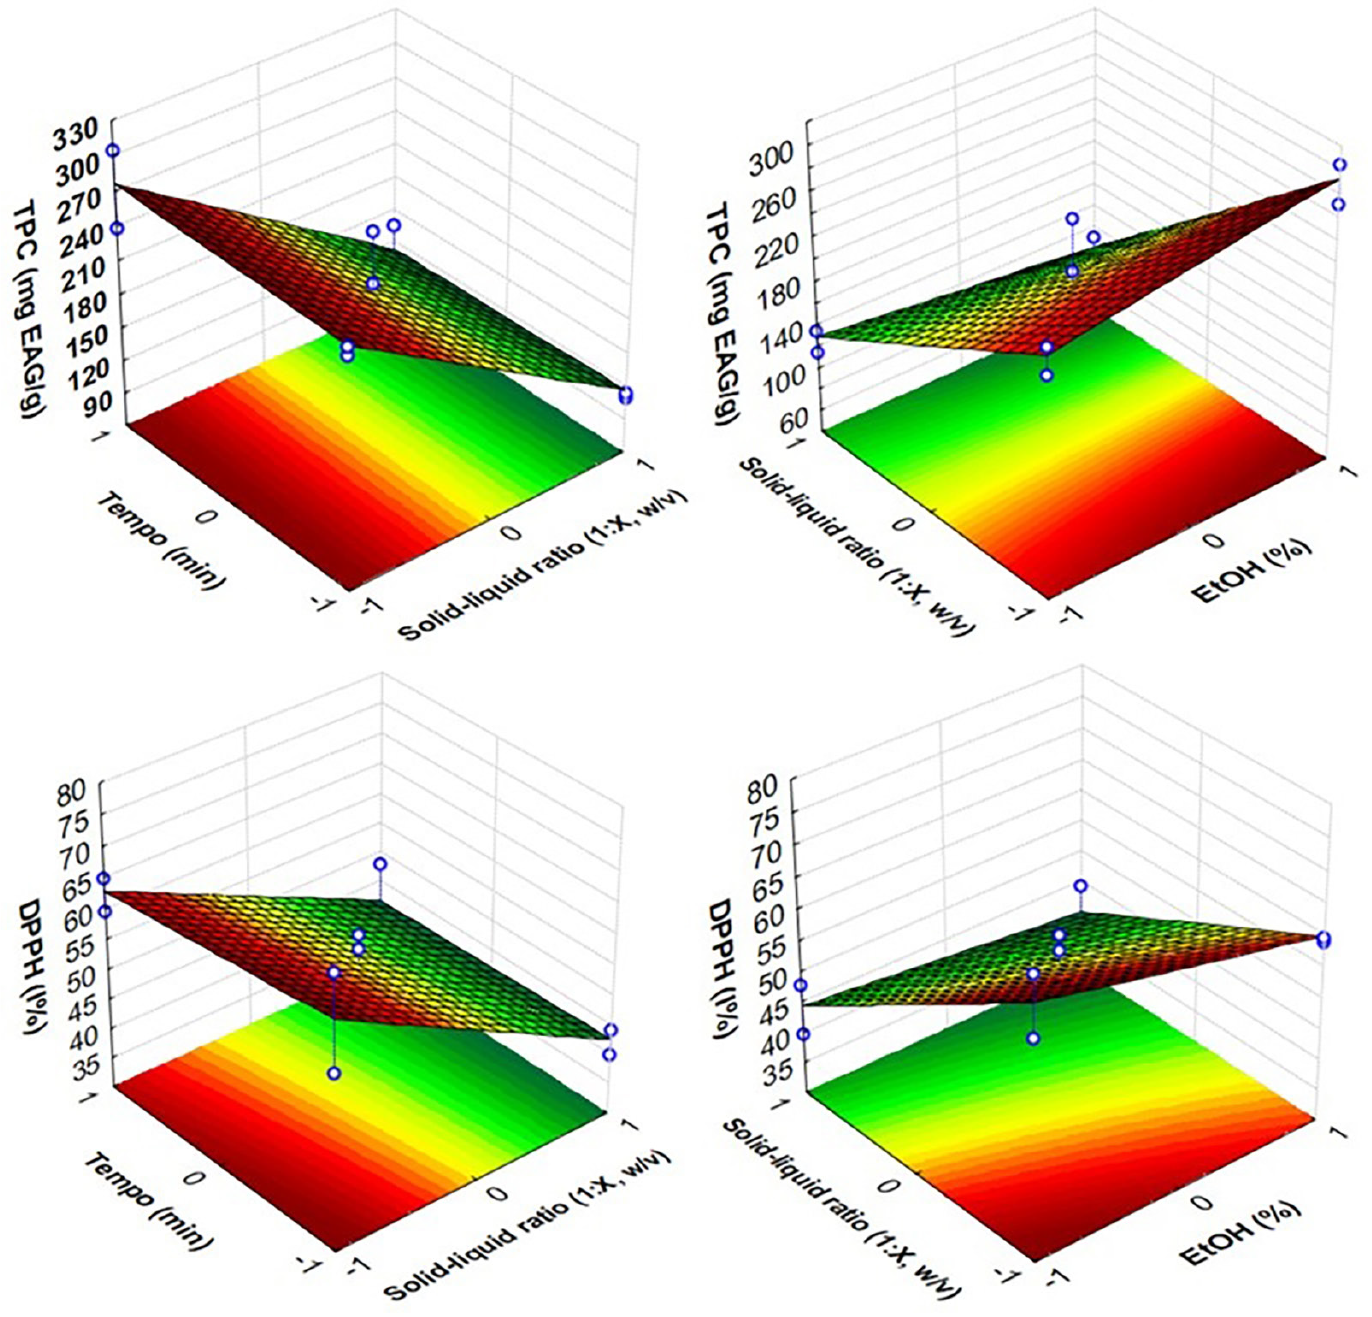
The solid-liquid ratio presented negative correlations with TPC (r = -0.937), and DPPH inhibition (r = -0.888), showing to be inversely proportional, as also observed in the Pareto charts (Figure S1, SI section), indicating that the lowest the solid-liquid ratio levels, the higher the TPC contents and DPPH radical inhibition. As expected at this point, the extraction time and percentage of EtOH in water showed very low correlation with the response variables. This behavior was also observed in the response surface graphs (Figure 1), in which varying the levels did not influence the response values. In the ultrasound-assisted extraction technique, cavitation occurs with the rupture of particles and increased contact between the solvent and solute.33-36 Consequently, the process is accelerated, which may have minimized the influence of time.37,38
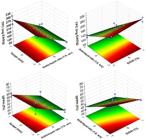
Response surface plots to illustrate the contents of total phenolic compounds (TPC, mg gallic acid equivalent (GAE) g-1), and the antioxidant capacity (DPPH) of Psidium guineense fruit extracts obtained in each DOE experiment, as observed for the ultrasound-assisted extraction optimization.
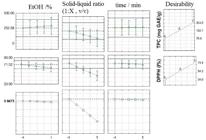
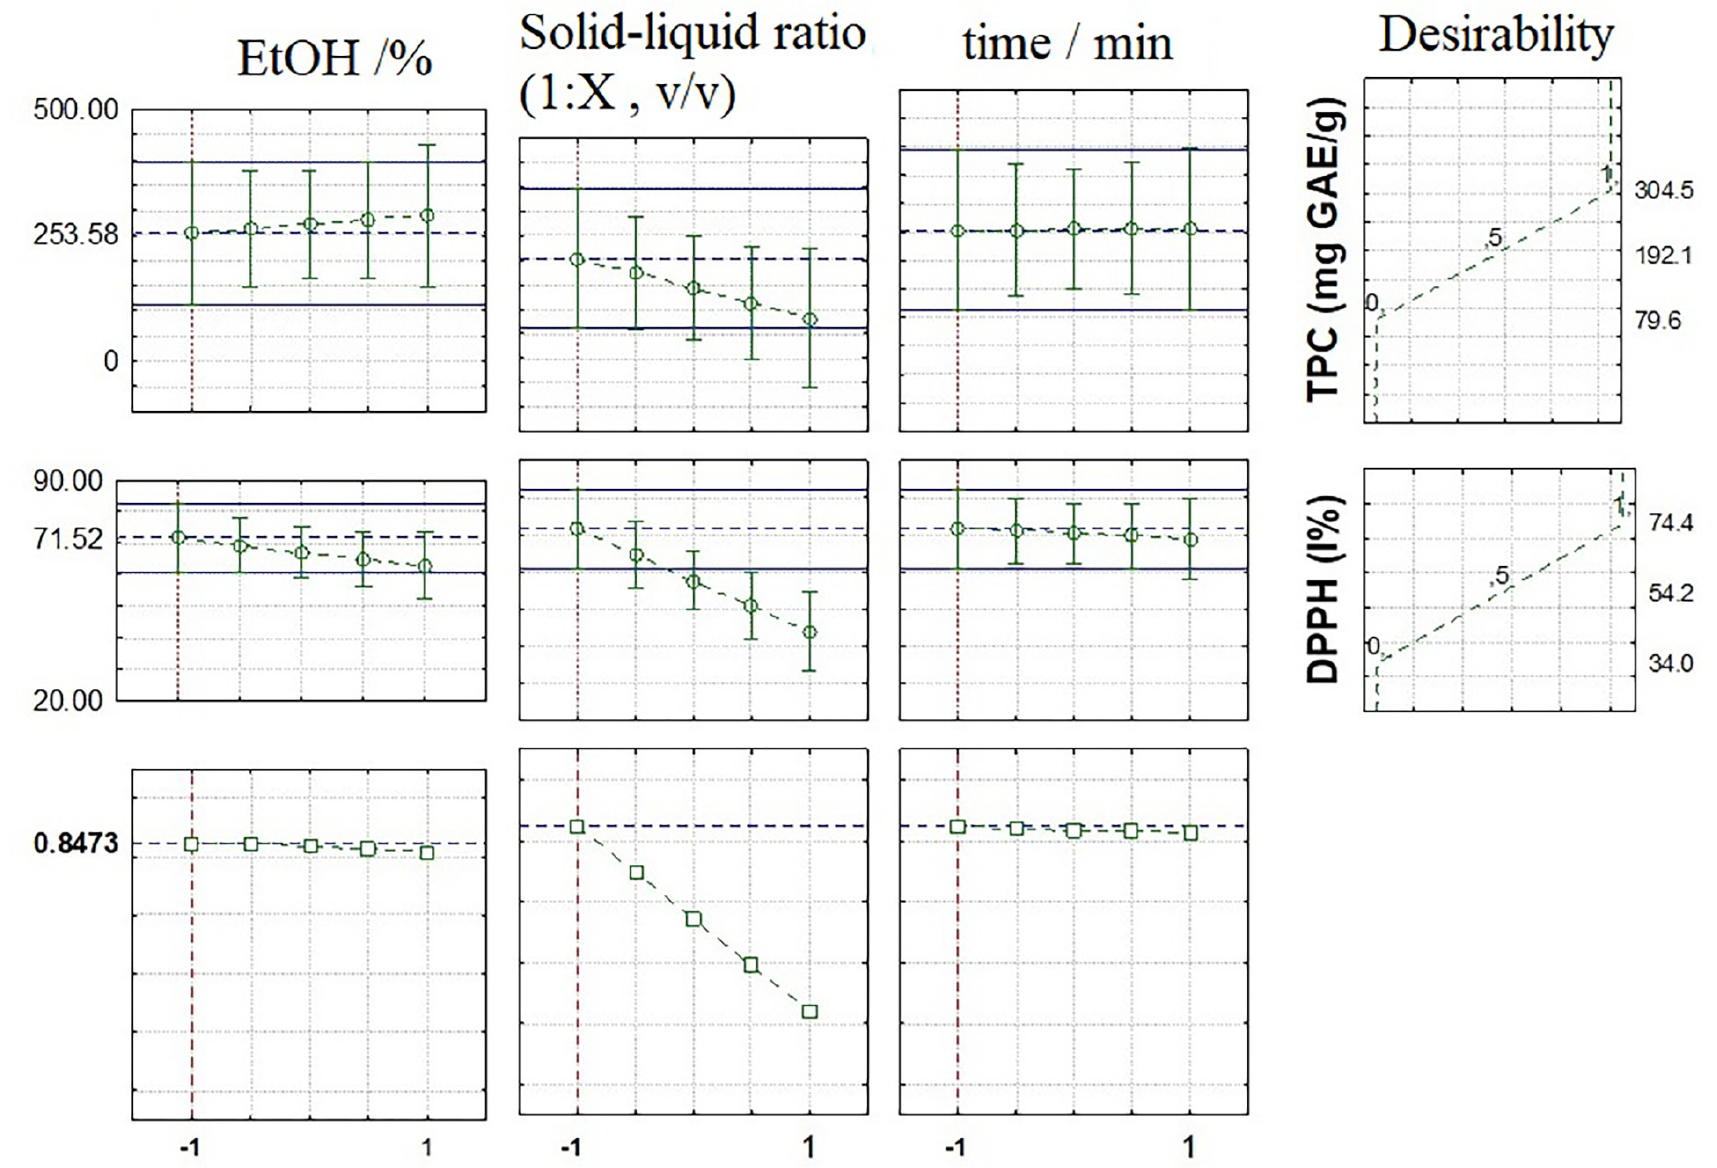
Global desirability statistic tool showing the predicted values for the total phenolic compound contents and inhibition of DPPH radicals (%) as results of the selected optimal conditions for the ultrasound-assisted extraction of phenolic compounds from Psidium guineense fruits. EtOH factor levels 25 (-1), 50 (0), 75 (+1); SLR 1:5 (-1), 1:10 (0), 1:15 (+1); T 10 (-1), 20 (0), 30 (+1).
After performing ANOVA (95% confidence level) (Table S2, SI section) for the UAE conditions, the linear models proposed (equations 7 and 8) were considered both predictive and significant by the Fisher test, and they are able to efficiently predict the contents of TPC (R2 = 0.9176) and the scavenging capacity against DPPH radical (R2 = 0.9070). The adjusted R2 values of 0.7940 (TPC) and 0.7634 (DPPH) shown in Table S2 indicate that the models explained the major portion of the variability in the responses values and are considered satisfactory given the nature of the biological matrix and the linear nature of the models. Although the models are linear and lack quadratic terms, the ANOVA results confirmed their statistical significance and adequacy within the experimental range. In addition, the lack of fit for both the responses was not significant (p > 0.05) (Table S2, SI section), indicating that the proposed models, with all their linear terms and interactions, are efficient to describe the relation between the dependent and independent variables, even considering the non-significant effects (percentage of ethanol concentration in water and extraction time). Within the tested variable range, the fitted linear model did not indicate significant curvature; however, this conclusion is limited by the absence of axial points in the experimental design, and thus, curvature effects beyond the studied range cannot be discarded and should be further investigated in another set of experiments.
Based on the proposed models, the fitted response surface plots were generated to show the behavior of the UAE procedure for the contents of TPC and antioxidant capacity against DPPH radical (Figure 1). According to Figure 1, the highest TPC contents and percentage of DPPH inhibition were achieved at the lowest solid-liquid ratio (-1 = 1:5, m/v), regardless of the percentage of ethanol in water (%) and the extraction time. As the extraction time and ethanol percentage did not significantly impact the responses, the lowest levels (-1) were selected as the optimal conditions, proposing a faster procedure, less time-consuming and reduced equipment use, and with lower cost due to the low ethanol addition in water. Thus, the optimized conditions selected for the UAE of phenolic compounds from P. guineense fruits were 25% ethanol, solid-liquid ratio of 1:5 (m/v), during 10 min of extraction.
Prediction and desirability
Subsequently, a simulation was conducted using statistical software to determine the best parameters for extracting P. guineense fruits. The solid-liquid ratio (SLR) was kept at 1:5, while the ethanol percentage and time values were decreased to see how they affected the outcome. A desirability function was used to assess the accuracy and quality of the predictions of the model (Figure 2). Through the desirability function (d), it is possible to analyze the efficiency of minimizing the parameters to obtain a maximized response value; the closer the desirability is to 1, the more acceptable the response value will be.39
The ANOVA F test was conducted on the mathematical model to assess its significance and predictability. Using response surface methodology and the desirability approach, the optimal conditions for ultrasound-assisted extraction of phenolic compounds from freeze-dried fruits of P. guineense were determined: a 25% ethanol solution in water, a solid-liquid ratio of 1:5 (m v-1), and an extraction time of 10 min. This combination yielded a desirability score of 0.847 (Figure 2), indicating that the results fall within an acceptable range. To validate the accuracy of these findings, the predicted values and parameters were checked. The predicted value from the mathematical model served as a reference in the calculations (see Table 3), and the relative error was found to be acceptable at a 95% confidence level.
Validation of optimized parameters (EtOH 25%, solid-liquid ratio (SLR) 1:5, time 10 min) in the experimental design. Predicted TPC and 2,2-diphenyl-1-picrylhydrazyl (DPPH) I% values were obtained from the desirability function (Figure 2) and statistically compared with experimental values
Antioxidant activity and chemical profile of phenolic of optimized extract of P. guineense fruits DPPH inhibition, phenolic compounds, flavonoid, and carotenoid content
The optimized extract concentrated was obtained through the experimental design with optimized parameters, yielding 29.88% of the mass, which showed antioxidant activity, probably due to the presence of antioxidant compounds, such as phenolic compounds and carotenoids. The scavenging of DPPH radicals exhibited an IC50 of 37.75 ± 1.87 µg mL-1 around ten times less than Trolox (IC50 = 3.83 µg mL-1) and inhibited lipid peroxidation, with an IC50 of 20.95 µg mL-1, which were about 12 times less efficient than BHT (IC50 = 1.77 µg mL-1), as determined by the β-carotene/linoleic acid method. The contents of total phenolic compounds (TPC) determined for the concentrated optimized extract was 530.40 ± 24.71 mg GAE g-1, while the total flavonoids were 309.19 ± 17.65 mg QE g-1 and the total carotenoids were 108.18 ± 11.11 µg g-1, which was equivalent to 3245.4 µg 100 g-1 of freeze-dried fruits.
Phenolic compounds can be found in various plant tissues in different concentrations, contribute to biochemical reactions, and influence the active potential of fruits.35 The TPC value of the concentrated optimized extract of P. guineense fruits was higher to that observed for the methanolic extract of fruits (316.5 mg GAE g-1) collected in rural areas of Antioquia and Nariño, Colombia.13 Furthermore, the contents of TPC for the P. guineense concentrated extract in our study were about 70 times higher than the aqueous extract of fruits collected in Pará (Brazil) (7.54 mg GAE g-1, dry matter).40
The percentage of DPPH inhibition observed in this study for the P. guineense extract was higher than that reported for the ethanolic extract of the same fruits collected in Minas Gerais (Brazil), which inhibited only 13.47% at a concentration of 200 µg mL-1.41 Additionally, several studies report the potential of Psidium species extracts to scavenging DPPH radicals.6,7 The extract of P. guajava fruit collected in São Paulo (Brazil) presented an IC50 of 19.8 µg mL-1.42 P. acutangulum fruits showed antioxidant activity in DPPH tests corresponding to 90.6 mg of vitamin C 100 g-1 of fresh fruit.4
Various methods are commonly used to assess the antioxidant activity of fruits through different mechanisms, typically based on the capture of radicals (such as the DPPH method) and the products formed in lipid peroxidation (β-carotene method).43 Therefore, the phenolic compounds found in the fruit of P. guineense have a significant antioxidant effect according to both methods.44
Flavonoids and carotenoids may be responsible for fruit coloration and contribute to antioxidant activity.45 The total flavonoid content quantified in our study was 309.19 mg QE g-1 of extract, showing similarity to that found in the hydroalcoholic extract of P. guineense collected in Paraná, Brazil (91.43 ± 4.32 mg CTE 100 g-1 fw total catechin equivalente gram of fresh weight).46 In addition, studies show that fruits of the Psidium genus contain carotenoids, the main ones being all-trans-lycopene, all-trans-β-carotene and all-trans-β-cryptoxanthin.47,48 In our study, the total carotenoid content of P. guineense (3245.4 µg 100 g-1 of dry fruits) was higher than that reported for P. cattleyanum fruits (2443.3 µg 100 g-1 of dry fruits) and lower compared to P. guajava (883.2 µg 100 g-1 of dry mass) collected in Brazil and Costa Rica, respectively.43-46
Chemical annotation of phenolic compounds of optimized extract by LC-MS/MS
The chemical profile P. guineense fruits was annotated from the data obtained by LC-MS/MS (m/z 100-1000 Da) and the fragmentation data recorded are shown in Table 4. The main compounds annotated were phenolic acids with absorbance between 200-400 nm (chromatogram in Figure S2 and mass spectra in Figures S3-S6, SI section).
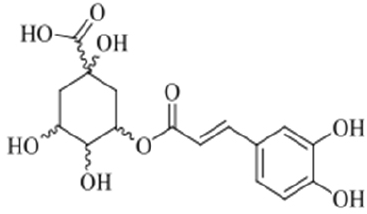
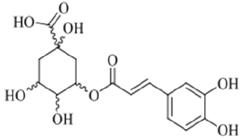
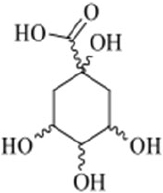
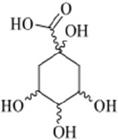
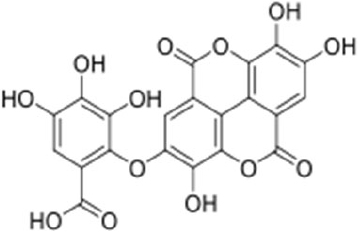
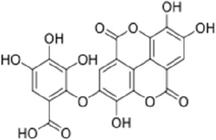
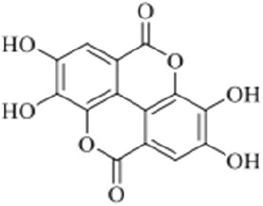
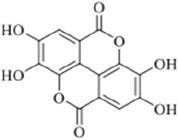
Fragments, chemical structure, and reference of the compounds identified in the optimized extract of Psidium guineense
Compound 1, known as caffeoylquinic acid, presented a protonated precursor ion peak [2M + Na]+ with a mass value of m/z 731 and a retention time (tR) of 2.5 min. The ion at m/z 359 indicates the loss of 372 Da, corresponding to the caffeoyl quinic portion and more adduct sodium.49 Compound 2, tR of 2.6 min, exhibited absorption bands at wavelengths of 254 and 330 nm. In the mass spectrum, it showed a deprotonated molecule at m/z 383 [2M - H]- and four MS2 fragments at m/z 191, 173, 129, and 111, consistent with the structure of quinic acid.50 Compound 3, tR of 8.2 min, displayed a deprotonated molecule at m/z 469 [M - H]- and three fragments at m/z 301 (base peak), 300, and 271, consistent with the structure of valoneic acid dilactone, a water-soluble tannin and polyphenol.51
Compound 4, tR of 17.0 min, was characterized by a protonated peak in positive ion mode at m/z 303 [M + H]+, accompanied by six fragmentation ions at m/z 285, 275, 257 (base peak), 247, 229, and 201. These fragments are consistent with the structure of ellagic acid, a naturally occurring polyphenolic compound. Ellagic acid is a dimeric derivative of gallic acid and exhibits significant antioxidant properties due to its conjugated ring system and multiple hydroxyl groups, which contribute to its reactivity and biological activity. The fragmentation pattern observed is typical for this compound, reflecting the sequential loss of functional groups and cleavage of the core structure under MS2 conditions.52
The literature reports the presence of ellagic acid and quinic acid in several Myrtaceae fruit extracts with antioxidant action and other biological proprieties.53-57 Eighteen polyphenolic compounds have already been identified in the pulp and peel of P. guineense fruits, including gallic acid, and others from the ellagitannin and gallotannin classes.54 In the leaf extract of the P. guineense, 15 phenolic compounds associated with antioxidant activity have already been identified, including ellagic acid and caffeic acid.55 The ethanolic extract of P. brownianum has a ferric ion reduction and antioxidant activity measurement using the ferric reducing antioxidant power (FRAP) method and showed in its chemical composition ellagic acid and quinic acid.56
The P. guajava hydroethanolic extract presented ellagic acid at concentration of 7 µg mL-1 and an IC50 value of 19.80 µg mL-1 in the DPPH method.40-53 This compound also was identified and quantified (dry matter) in the peel and pulp ethanolic extracts of P. cattleianum (2213-3818 μg g-1 extracts).58 The ethyl acetate fraction of aqueous extract of P. friedrichsthalianum displayed a high antioxidant activity against 2,2’-azino-bis(3 ethylbenzothiazoline-6-sulfonic acid) (ABTS) radicals attributed to presence of ellagic acid and other 22 phenolic compounds.59 In addition, P. acutangulum extracts, extraction with ethanol content formic acid 0.1%, collected in Instituto Nacional de Pesquisas da Amazônia (INPA), Manaus, AM, Brazil showed antioxidant activities by DPPH and ABTS assays.4
Antimicrobial activity
The P. guineense optimized fruit extract demonstrated activity against Gram-positive (Staphylococcus aureus and Bacillus subtilis) and Gram-negative strains (Escherichia coli and Salmonella typhimurium). The presence of ellagic acid identified in the extract may have contributed to the observed activity, as its mechanism of action may involve disrupting cell walls and interrupting metabolic processes, thus inhibiting enzymatic activity.60Table 5 shows the extract was bacteriostatic against Bacillus subtilis, Escherichia coli, and Salmonella typhimurium at 250 µg mL-1. Notably, it exhibited a high-activity bactericidal (MIC, 250 µg mL-1) and bacteriostatic (MIC, 125 µg mL-1) against Staphylococcus aureus, less than standard amoxicillin only four times and twice, respectively, underscoring its potential as a viable alternative.
Antimicrobial activity of optimized extract of Psidium guineense evaluated by microdilution through minimum inhibitory concentration (MIC)
Compounds with antimicrobial activity can inhibit proliferation or permanently damage the microorganism. To be more effective and selective, they must be biocompatible and more bactericidal than bacteriostatic, interfering in the functions of the microorganisms and inducing cell apoptosis.61 Studies report that compounds inhibit bacteria through different mechanisms of action.62 Consequently, the presence of phenolic compounds in the extract of P. guineense fruits promotes the blocking of the multiplication and proliferation of the tested strains.
The extract from P. guineense showed bacteriostatic activity against Escherichia coli and Salmonella typhimurium at the tested concentrations. Escherichia coli is known for causing infections and diarrhea due to its pathogenic nature,63 while S. typhimurium is responsible for human foodborne enteric infections.64 Additionally, the methanolic extract of Eugenia umbeliflora fruits demonstrated bactericidal effects against both E. coli and Salmonella typhimurium, with a minimum inhibitory concentration (MIC) value of 900 µg mL-1.63 Furthermore, when combined with antibiotics, this extract displayed activity against E. coli.63 Notably, Bacillus subtilis was the only strain tested that exhibited resistance to both the P. guineense extract and the antibiotics used as positive controls, showing bacteriostatic activity at a concentration of 250 µg mL-1. This resistance underscores the need for further investigation into the mechanism of action of the P. guineense extract.
Previous studies65,66 reported the antimicrobial activity of aqueous extract of P. guineense against twelve strains of Staphylococcus aureus by microdilution method. In addition, when combinate to antimicrobials agents (ampicillin, amoxicillin/clavulanic acid, cefoxitin, ciprofloxacin, and meropenem) resulted in an eight-fold reduction in the MIC of these agents. These results demonstrated that the aqueous extract of P. guineense combined with beta lactamics antimicrobials, fluoroquinolones, and carbapenems, acts synergistically by inhibiting methicillin-resistant Staphylococcus aureus strains.
Different mechanisms of action of the main compounds identified in P. guineense against S. aureus have been reported by in vitro and in silico models. A study67 demonstrates that ellagic acid inhibits the growth, N-acetyltransferase (NAT) activity, and NAT messenger ribonucleic acid (mRNA) gene expression in S. aureus in a dose-dependent manner. The antibacterial activity of ellagic acid was studied against bacterial receptors using in silico docking methods. The highest binding affinity of ellagic acid was against S. aureus tyrosyl-tRNA synthetase among the S. aureus receptor proteins.68 Meanwhile, the inhibitory mechanism of quinic acid was investigated by combined transcriptomic and metabolomic analyses. Bioinformatic analysis revealed that quinic acid disturbed the oxidative phosphorylation pathway and changed glycerophospholipids and fatty acids levels to interfere with the membrane fluidity. After penetrating the cell membrane, quinic acid influences the ribosome functions and aminoacyl-tRNA synthesis, thus disturbing protein synthesis such as the synthesis of L-lysine and peptidoglycan to inhibit cell wall synthesis and cell division.69 Furthermore, a study70 illustrated that quinic acid is a potent antibacterial agent on S. aureus that damages the cell membrane, promotes hyperpolarization and decreases membrane fluidity. The interaction of quinic acid with phosphorylation residue in the membrane protein was revealed by fluorescence quenching.
Sun protection factor (SPF) determination
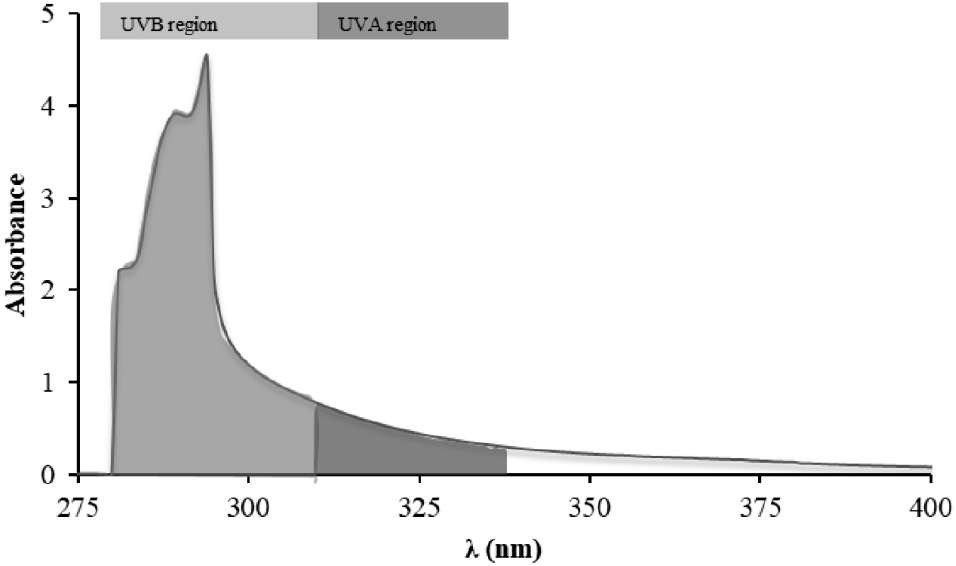
The analysis of P. guineense fruit extract showed the absorbance of ultraviolet rays in the UV-B spectrum region, which makes it a potential candidate for sun protection. The extract showed absorption in the 278 to 410 nm wavelength range, covering both UVA (315-400) and UVB (280-315) zones (Figure 3). The peak absorption was found at 294 nm, which falls within the UVB range, and the SPF of the extract was calculated to be 16.0 ± 1.04 at a concentration of 1 mg mL-1, making it a promising natural sunscreen ingredient.
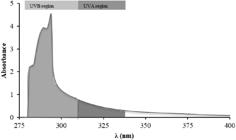
Absorption scanning spectrum (275 to 400 nm) of the optimized extract of Psidium guineense fruits with identified UVA and UVB areas.
The Food and Drug Administration (FDA) recommends that sunscreens be broad-spectrum with SPF 15 or higher.71 Therefore, the extract presented acceptable SPF according to FDA regulations, as it absorbs in the UVA and UVB bands and can be considered broad-spectrum, but substance to be more effective. In Brazil, the Agência Nacional de Vigilância Sanitária (ANVISA)72 that classifies sunscreens and the indication for skin type, the extract in this study is classified as medium protection (15.0-29.9), indicated for skin with moderate sensitivity to sunburn.
The ability to absorb electromagnetic radiation is due to the presence of conjugated bonds in the structure of phenolic compounds, which can absorb it at various wavelengths.10 Thus, the ethanolic extract of P. guineense fruits can be used to minimize the damage caused by sun exposure to the skin. Flavonoids exhibit an absorption band between 240-290 nm, and when conjugates between the rings, it presents an extra band at 300-550 nm.11 The presence of such phenolic compounds in the extract provided absorption of UV light, enabling the use of this extract for incorporation into sunscreen formulations.9
The photoprotective action of P. guajava fruit extracts was evaluated using a topical emulsion combined with ethylhexyl methoxycinnamate, a synthetic sunscreen. The results showed a 17% increase in the efficiency of the formulation, which presented a SPF of 22.3, proving the synergistic effect.42 Due to the toxicity of synthetic substances used in sunscreens, supplementation with extracts is considered an alternative. Mota et al.10 reported a 78% reduction in synthetic photoprotectors when using P. guajava fruit extract, reducing costs by up to 65%. Based on these results, a combination of P. guineense extract and synthetic photoprotectors is suggested to improve photoprotective action.
Conclusions
The study showed that the solid-liquid ratio was the only variable significantly affecting the extraction conditions of the phenolic compounds and the antioxidant activity of the P. guineense fruits by UAE. The mathematical models developed in the study can effectively predict the extraction procedure, which can be seen as a promising advantage for industrial applications. The optimal conditions for the extraction of phenolic compounds from freeze-dried fruits of P. guineense were 25% ethanol solution in water, a solid-liquid ratio of 1:5 (m v-1), and an extraction time of 10 min. It is important to highlight that the reproducibility of extraction methods can be affected by different characteristics of matrix such as maturation stage, geographic origin, and environmental conditions.
The chemical analysis of the extract identified the presence of phenolic compounds, such as ellagic acid, a bioactive compound, well documented in the literature. The extract, with its high concentration of TPC and excellent antioxidant activity, demonstrates significant potential for application in the cosmetic sector. Therefore, combined with other photoprotectors and antimicrobials, whether natural or synthetic, the extract of phenolic compounds from freeze-dried fruits of P. guineense can offer potential economic benefits and improved formulation conservation, along with reduced risks of toxicity and irritation frequently associated with synthetic excipients. However, the need for additional in vivo assays to validate the activity observed in vitro is highlighted.
Supplementary Information
Supplementary Information
Supplementary information about the optimization process such as Pareto charts for the main effects, Pearson Correlation Matrix for the ultrasound-assisted extraction of phenolic compounds in the central composite design experiments and ANOVA F-test are available free of charge at https://jbcs.sbq.org.br/ as a PDF file.
-
Acknowledgments
The authors would like to acknowledge the support of the Federal University of Pará for providing research infrastructure. The authors thank CNPq for financial support (process 443973/2024-5).
Data Availability Statement
All data are available in the text.
References
-
1 Beltrame, B. M.; Klein-Junior, L. C.; Schwanz, M.; Henriques, A. T.; Phytother. Res. 2021, 35, 4795. [Crossref]
» Crossref -
2 Flora e Funga do Brasil: Psidium [Link] accessed in January 2026
» Link -
3 Silva, M. A.; Soares, F. A. F.; Clarindo, W. R.; Mendes, L. A.; Alves, L. B.; Ferreira, A.; Ferreira, M. F. S.; Sci. Rep. 2023, 13, 1385. [Crossref]
» Crossref -
4 Ramos, A. S.; Souza, R. O. S.; Boleti, A. P. D. A.; Bruginski, E. R. D.; Lima, E. S.; Campos, F. R.; Machado, M. B.; Food Res. Inter. 2015, 75, 315. [Crossref]
» Crossref -
5 e Silva, R. C. E.; da Costa, J. S. D.; de Figueiredo, R. O. D.; Setzer, W. N.; Silva, J. K. R. D.; Maia, J. G. S.; Figueiredo, P. L. B.; Molecules 2021, 26, 965. [Crossref]
» Crossref -
6 Macedo, J. G. F.; Santos, M. O.; Nonato, C. F. A.; Salazar, G. J. T.; Rodrigues, F. F. G.; Almeida-Bezerra, J. W.; de Miranda Freitas, Â. M.; Proenca, C. E. B.; da Costa, J. G. M.; de Almeida Souza, M. M.; Biocatal. Agric. Biotechnol. 2022, 42, 102363. [Crossref]
» Crossref -
7 Bailão, E. F. L. C.; Devilla, I. A.; da Conceição, E. C.; Borges, L. L.; Int. J. Mol. Sci. 2015, 16, 23760. [Crossref]
» Crossref -
8 Jerônimo, L. B.; Da Costa, J. S.; Pinto, L. C.; Montenegro, R. C.; Setzer, W. N.; Mourão, R. H. V.; da Silva, J. K. R.; Maia, J. G. S.; Figueiredo, P. L. B.; Nat. Prod. Commu 2021, 16, 1934578X21996156. [Crossref]
» Crossref -
9 Gomes, E. S. S.; Sampaio, J. S.; Silva, A. L. S.; Costa, S. C. C.; Reis, I. M. A.; REM 2022, 3, 3. [Crossref]
» Crossref -
10 Mota, M. D.; Costa, R. Y. S.; Guedes, A. A. S.; Silva, L. C. R. C. E.; Chinalia, F. A.; J. Photochem. Photobiol., B 2019, 201, 111639. [Crossref]
» Crossref -
11 He, H.; Li, A.; Li, S.; Tang, J.; Li, L.; Xiong, L.; Biomed. Pharmacother. 2021, 134, 111161. [Crossref]
» Crossref -
12 Hachem, K.; Bokov, D.; Mahdavian, L.; Polycyclic Aromat. Compd. 2023, 43, 2770. [Crossref]
» Crossref -
13 Bravo, K.; Alzate, F.; Osorio, E.; Ind. Crops Prod. 2016, 85, 341. [Crossref]
» Crossref -
14 Lima, L. R. D.; Costa, J. R. L.; Bena, M. G. P.; Gomes, M. T. H. C. D. A. B.; Sousa, J. D. A. B.; Bacelar, S. N. D. A.; Paz, B. K. B.; Mascarenhas, M. T. M.; Braz. J. Develop. 2021, 7, 4322. [Crossref]
» Crossref -
15 Bilal, M.; Mehmood, S.; Iqbal, H. M. N.; Cosmetics 2020, 7, 13. [Crossref]
» Crossref -
16 Bom, S.; Jorge, J.; Ribeiro, H. M.; Marto, J.; J. Cleaner Prod. 2019, 225, 270. [Crossref]
» Crossref -
17 Rodrigues, F.; Cádiz-Gurrea, M. L.; Nunes, M. A.; Pinto, D.; Vinha, A. F.; Linares, I. B.; Carreto, A. S. In Polyphenols: Properties, Recovery, and Applications; Galanakis, C. M., eds.; Woodhead, Elsevier, 2018. [Crossref]
» Crossref - 18 Barbosa, F. G.; Silva, G. F.; de Oliveira, V. L. P.; Kubijan, L. A. C.; Costa, L. G.; de Melo, A. M.; Teófilo, M. N. G.; Morgado, C. M. A.; de Campos, A. J.; Peixoto, J. C.; Borges, L. L.; e Silva Neto, C. M.; Santana, E. S.; de Paula, J. A. M.; Molecules 2025, 30, 1115. [Crossref]
-
19 de Melo, A. M.; Ribeiro, G. S.; dos Santos, B. O. B.; Costa, L. G.; Morgado, C. M. A.; de Campos, A. J.; Borges, L. L.; Peixoto, J. C.; de Paula, J. A. M.; Sustainable Chem. Pharm. 2025, 46, 102109. [Crossref]
» Crossref -
20 Box, G. E. P.; Hunter, J. S.; Hunter, W. G.; Statistics for Experimenters: Design, Innovation and Discovery, 2nd ed.; Wiley: New York, 2005. [Crossref]
» Crossref -
21 Singleton, V. L.; Orthofer, R.; Lamuela-Raventós, R. M. In Methods in Enzymology, vol. 299; Elsevier, 1999, p. 152-178. [Crossref]
» Crossref -
22 da Silva, J. K. R.; Andrade, E. H. A.; Kato, M. J.; Carreira, L. M. M.; Guimarães, E. F.; Maia, J. G. S.; Nat. Prod. Commun. 2011, 6, 1934578X1100600936. [Crossref]
» Crossref -
23 Girardelo, J. R.; Munari, E. L.; Dallorsoleta, J. C. S.; Cechinel, G.; Goetten, A. L. F.; Sales, L. R.; Reginatto, F. H.; Chaves, V. C.; Smaniotto, F. A.; Somacal, S.; Emanuelli, T.; Benech, J. C.; Soldi, C.; Winter, E.; Conterato, G. M. M.; Food Res. Int. 2020, 137, 109615. [Crossref]
» Crossref -
24 Chang, C. C.; Yang, M. H.; Wen, H. M.; Chern, J. C.; J. Food Drug Analysis 2002, 10, 178. [Crossref]
» Crossref -
25 Lichtenthaler, H. K.; Buschmann, C.; Curr. Protoc. Food Anal. Chem. 2001, 1 [Crossref]
» Crossref -
26 Prieto, M. A.; Rodríguez-Amado, I.; Vázquez, J. A.; Murado, M. A.; J. Agric. Food Chem. 2012, 60, 8983. [Crossref]
» Crossref - 27 Miller, H. E.; J. Am. Oil Chem. Soc. 1971, 48, 91. [Crossref]
-
28 Dawidowicz, A. L.; Olszowy, M.; Eur. Food Res. Technol. 2011, 232, 837. [Crossref]
» Crossref -
29 Clinical and Laboratory Standards Institute (CLSI); CLSI M07, Methods for Dilution Antimicrobial Susceptibility Tests for Bacteria That Grow Aerobically. [Link] accessed in January 2026
» Link -
30 Sayre, R. M.; Agin, P. P.; LeVee, G. J.; Marlowe, E.; Photoch. Photobiol. 1979, 29, 559. [Crossref]
» Crossref -
31 Sürücü, L.; Maslakçi, A.; BMIJ 2020, 8, 2694. [Crossref]
» Crossref -
32 Nawaz, H.; Shad, M. A.; Rehman, N.; Andaleeb, H.; Ullah, N.; Braz. J. Pharm. Sci. 2020, 56, e17129. [Crossref]
» Crossref -
33 Ghaffar, N.; Perveen, A.; N. Z. J. Bot. 2025, 63, 627. [Crossref]
» Crossref -
34 Belwal, T.; Ezzat, S. M.; Rastrelli, L.; Bhatt, I. D.; Daglia, M.; Baldi, A.; Devkota, H. P.; Orhan, I. E.; Patra, J. K.; Das, G.; Anandharamakrishnan, C.; Gomez-Gomez, L.; Nabavi, S. F.; Nabavi, S. M.; Atanasov, A. G.; TrAC, Trends Anal. Chem 2018, 100, 82. [Crossref]
» Crossref -
35 de Freitas, T. S. M.; de Rodrigues, G. M.; Fakhouri, F. M.; da Silva, C.; Cardoso, C. A. L.; Velasco, J.; Filgueiras, C. T.; Garcia, V. A. S.; J. Food Process. Preserv. 2021, 45 [Crossref]
» Crossref -
36 Farooq, S.; Abdullah; Zhang, H.; Weiss, J.; Comp. Rev. Food Sci. Food Safe. 2021, 20, 4250. [Crossref]
» Crossref -
37 Ballesteros, L. F.; Teixeira, J. A.; Mussatto, S. I.; Food Bioprocess Technol 2014, 7, 1322. [Crossref]
» Crossref -
38 Weremfo, A.; Abassah-Oppong, S.; Adulley, F.; Dabie, K.; Seidu-Larry, S.; J. Sci. Food Agric. 2023, 103, 26. [Crossref]
» Crossref -
39 Han, H. H.: Utilização da Função Desirability na Otimização do Processo de Usinagem da Superliga NIMONIC 80A; TCC, Universidade Estadual Paulista, Guaratinguetá, 2015. [Link] accessed in January 2026
» Link -
40 Gordon, A.; Jungfer, E.; da Silva, B. A.; Maia, J. G. S.; Marx, F.; J. Agric. Food Chem. 2011, 59, 7688. [Crossref]
» Crossref -
41 Damiani, C.; da Silva, F. A.; Asquieri, E. R.; Lage, M. E.; Vilas Boas, E. V. D. B.; Pesq. Agropec. Trop. 2012, 42, 90. [Crossref]
» Crossref -
42 Milani, L. P. G.; Garcia, N. O. S.; Morais, M. C.; Dias, A. L. S.; Oliveira, N. L.; Conceição, E. C.; Rev. Bras. Farmacogn. 2018, 28, 692. [Crossref]
» Crossref -
43 Schiassi, M. C. E. V.; de Souza, V. R. D.; Lago, A. M. T.; Campos, L. G.; Queiroz, F.; Food Chem. 2018, 245, 305. [Crossref]
» Crossref -
44 do Nascimento, K. F.; Moreira, F. M. F.; Alencar Santos, J.; Kassuya, C. A. L.; Croda, J. H. R.; Cardoso, C. A. L.; Vieira, M. D. C.; Góis Ruiz, A. L. T.; Ann Foglio, M.; de Carvalho, J. E.; Formagio, A. S. N.; J. Ethnopharmacol. 2018, 210, 351. [Crossref]
» Crossref -
45 Nora, C. D.; Müller, C. D.-R.; de Bona, G. S.; Rios, A. D. O.; Hertz, P. F.; Jablonski, A.; de Jong, E. V.; Flôres, S. H.; J. Food Composit. Analysis 2014, 34, 18. [Crossref]
» Crossref -
46 Stafussa, A. P.; Maciel, G. M.; Rampazzo, V.; Bona, E.; Makara, C. N.; Demczuk Jr., B. D.; Haminiuk, C. W. I.; Inter. J. Food Propert. 2018, 21, 106. [Crossref]
» Crossref -
47 Rojas-Garbanzo, C.; Food Sci. 2018, 2 [Crossref]
» Crossref -
48 Rojas-Garbanzo, C.; Gleichenhagen, M.; Heller, A.; Esquivel, P.; Schulze-Kaysers, N.; Schieber, A.; J. Agric. Food Chem. 2017, 65, 3737. [Crossref]
» Crossref -
49 Gobbo-Neto, L.; Guaratini, T.; Pessoa, C.; de Moraes, M. O.; Costa-Lotufo, L. V.; Vieira, R. F.; Colepicolo, P.; Lopes, N. P.; J. Braz. Chem. Soc. 2010, 21, 750. [Crossref]
» Crossref -
50 Llorent-Martínez, E. J.; Gouveia, S.; Castilho, P. C.; Ind. Crops Prod. 2015, 64, 135. [Crossref]
» Crossref -
51 da Silva, F. M. A.; Hanna, A. C. S.; de Souza, A. A.; da Silva Filho, F. A.; Canhoto, O. M. F.; Magalhães, A.; Benevides, P. J. C.; de Azevedo, M. B. M.; Siani, A. C.; Pohlit, A. M.; de Souza, A. D. L.; Koolen, H. H. F.; J. Braz. Chem. Soc. 2018, 30, 830. [Crossref]
» Crossref -
52 Mena, P.; Calani, L.; Dall’Asta, C.; Galaverna, G.; García Viguera, C.; Bruni, R.; Crozier, A.; Del Rio, D.; Molecules 2012, 17, 14821. [Crossref]
» Crossref -
53 Nicácio, A. E.; Rotta, E. M.; Boeing, J. S.; Barizão, É. O.; Kimura, E.; Visentainer, J. V.; Maldaner, L.; Food Anal. Methods 2017, 10, 2718. [Crossref]
» Crossref -
54 Gordon, A.; Jungfer, E.; da Silva, B. A.; Maia, J. G. S.; Marx, F.; J. Agric. Food Chem. 2011, 59, 7688. [Crossref]
» Crossref -
55 Senanayake, C. M.; Hapugaswatta, H.; Jayathilaka, N.; Seneviratne, K. N.; J. Food Biochem. 2018, 42, e12632. [Crossref]
» Crossref -
56 Sobral-Souza, C. E.; Silva, A. R. P.; Leite, N. F.; Costa, J. G. M.; Menezes, I. R. A.; Cunha, F. A. B.; Rolim, L. A.; Coutinho, H. D. M.; J. Hazard. Mater. 2019, 370, 54. [Crossref]
» Crossref -
57 Moreno, J. A. J.; Ferreira, V. C.; Ampese, L. C.; de Freitas Marinho, L.; Rostagno, M. A.; Carneiro, T. F.; Eur. Food. Res. Technol. 2024, 250, 859. [Crossref]
» Crossref -
58 Ribeiro, A. B.; Chisté, R. C.; Freitas, M.; da Silva, A. F.; Visentainer, J. V.; Fernandes, E.; Food Chem. 2014, 165, 140. [Crossref]
» Crossref -
59 Cuadrado-Silva, C.; Pozo-Bayón, M.; Osorio, C.; Molecules 2016, 22, 11. [Crossref]
» Crossref -
60 Davidova, S.; Galabov, A. S.; Satchanska, G.; Microorganisms 2024, 12, 2502. [Crossref]
» Crossref -
61 Souza, J. F.; Dias, R. F.; Alvim, F. G. O.; Revista JRG de Estudos Acadêmicos 2022, 281. [Crossref]
» Crossref -
62 Zheng, D.; Huang, C.; Huang, H.; Zhao, Y.; Khan, M. R. U.; Zhao, H.; Huang, L.; Chem. Biodiversity 2020, 17, e2000171. [Crossref]
» Crossref -
63 de Souza, A. M.; de Oliveira, C. F.; de Oliveira, V. B.; Betim, F.; Miguel, O. G.; Miguel, M. D.; Planta Med. 2018, 84, 1232. [Crossref]
» Crossref - 64 Roth, J. R. In Brenner’s Encyclopedia of Genetics, vol. 6, 2nd ed.; Maloy, S.; Hughes, K., eds.; Academic Press, 2013.
-
65 Fernandes, T. G.; de Mesquita, A. R. C.; Randau, K. P.; Franchitti, A. A.; Ximenes, E. A.; Sci. World J. 2012, 2012, 1. [Crossref]
» Crossref -
66 da Fonsêca, B. M. B.;Costa, W. K.; Silva, V. B. G.; Ferreira, M. R. A.; Soares, L. A. L.; de Oliveira, A. M.; Correia, M. T. S.; da Silva, M. V.; S. Afr. J. Bot. 2024, 174, 850. [Crossref]
» Crossref -
67 Lu, H.-F.; Tsou, M.-F.; Lin, J.-G.; Ho, C.-C.; Liu, J.-Y.; Chuang, J.-Y.; Chung, J.-G.; In Vivo 2005, 19, 195. [Crossref]
» Crossref -
68 Sumanth, B.; Uzma, F.; Konappa, N.; Ali, D.; Alarifi, S.; Srinivas, C.; Jogaiah, S.; Biomass Conv. Bioref. 2024, 14, 24867. [Crossref]
» Crossref -
69 Bai, J.; Wu, Y.; Bu, Q.; Zhong, K.; Gao, H.; LWT 2022, 153, 112441. [Crossref]
» Crossref -
70 Bai, J.; Wu, Y.; Wang, X.; Liu, X.; Zhong, K.; Huang, Y.; Chen, Y.; Gao, H.; J. Food Safety 2018, 38, e12416. [Crossref]
» Crossref -
71 Food and Drug Administration (FDA); Sunscreen: How to Help Protect Your Skin from the Sun [Link] accessed in January 2026
» Link -
72 Agência Nacional de Vigilância Sanitária (Anvisa); Resolução (RDC) No. 30, de 1o de junho de 2012; Aprova o Regulamento Técnico Mercosul sobre Protetores Solares em Cosméticos e dá outras Providência; 2012. [Link] accessed in January 2026
» Link
Edited by
-
Editor handled this article:
Hector Henrique F. Koolen (Associate)