Zebrafish Lipidomics via HPLC-MS and Chemometrics: Diet and Exercise-Associated Lipid Alterations
Abstract
This study aimed to elucidate lipid changes in zebrafish (Danio rerio) samples, providing insights into alterations related to different diets and exercise. Zebrafish subjects were categorized into four groups based on their diet and exercise. In this regard, high performance liquid chromatography coupled to mass spectrometry (HPLC-MS) and chemometric methods were employed for lipid extracts from zebrafish bodies. Partial least squares discriminant analysis (PLS-DA) with ordered predictors selection for discriminant analysis (OPSDA) successfully classified each sample with 100% accuracy. Volcano plots were utilized alongside multivariate analyses to identify variables that were statistically significant. This integrative approach enhances the robustness of our findings, ensuring that the variables selected for interpretation exhibit significance in both multivariate contexts and individual analyses. The most important lipids for classification of each zebrafish group were putatively annotated, providing insights about lipid metabolism changes in different diet and exercise. Findings reveal distinct lipid metabolic responses between sedentary and exercised groups under high-fat diets, highlighting the role of specific lipid classes in obesity-associated pathways and offering insights into potential metabolic targets for obesity management.
Keywords:
obesity-related regimens; liquid-liquid microextraction; untargeted lipidomics; high performance liquid chromatography-mass spectrometry; chemometric methods
Introduction
Since the 1980s, obesity has arisen as a worldwide concern posing a threat to human health due to its implications in the development of various clinical conditions, including hypertension, diabetes, cancer, sleep disorders and cardiovascular diseases.1-3 According to the World Health Organization (WHO), overweight and obesity can be defined as abnormal or excessive fat accumulation that may impair health, and its growth is attributed to an imbalance in caloric consumption caused by an increased intake of energy-dense foods and the rise of sedentary behavior.3-5 Furthermore, the World Obesity Atlas 2024 report exhibits alarming numbers which demonstrate that over 1.7 billion people across the world would present obese conditions by 2035.3,4
Obesity can lead to the development of insulin resistance, elevation on triglyceride and low-density lipoproteins (LDL) cholesterol levels, lipid deposition in liver which prompt various diseases.6 Moreover, obesity can contribute to cardiovascular problems, as heart failure and atherosclerotic diseases.7 A broad consensus exists acknowledging obesity as an intricate disease influenced by various factors such as genetics, environment, lifestyle, and socioeconomic conditions.7,8 Consequently, understanding the mechanism of each factor is essential for mitigating the disease impacts.7,8 Thus, the comprehension of changes at molecular levels in metabolism can aid in the prevention of various diseases that may be caused by obesity and overweight.9 In this regard, metabolomics assays provide a comprehensive study of small molecules in biological samples that demonstrate the capability to unveil pathophysiological alterations in living organisms through a metabolic lens.10
Among metabolites, lipids can provide great insights regarding metabolic alterations, once these molecules perform many biological processes, such as formation of cellular membranes, intra and extracellular second messenger and energy storage for cellular metabolism.11 Thus, lipidomics has arisen as a field that is dedicated to investigating lipid structures, the prevalence of unique molecular species, cell functions, and interactions, delineating the biochemical mechanisms that underline lipid-related disease processes.12-14 To study changes in lipid profiles caused by adversities, such as obesity and overweight cases, an emerging study model is the use of zebrafish (Danio rerio).15,16 Zebrafish has been widely used as model due to its genetic similarities with humans, presenting desirable features such as its small size, cost-effective maintenance, fewer legal restrictions, easy breeding, short life cycle, and high fecundity.16,17 Recent studies conducted by Zhang et al.18 highlighted the excellency of zebrafish models in investigating the stereoselective effects of ibuprofen on lipid metabolism in adult zebrafish, revealing that racemic products differentially impacted various lipid classes and biomarkers. Smolińska et al.19 evaluated the effects of high-fat diet (HFD) on zebrafish model with visceral obesity. The authors reported that HFD significantly affects intestinal morphology and inflammatory response.19
Analytical methods for lipidomics studies have been developed based on high performance liquid chromatography coupled to mass spectrometry (HPLC MS) due to its high sensitivity and capability for lipid identification.20,21 Chromatographic separation is essential for lipid analysis due to matrix complexity, enhancing lipid detection, and providing data based on analyte retention.20,21 The literature reports the shotgun lipidomics as the direct infusion of lipid extracts into the mass spectrometer, but it lacks regarding ion suppression, matrix effects, reduced sensitivity, significant sample consumption, and limitations in resolving isomeric and isobaric masses.22 The integration of separation methods with MS is essential for achieving enhanced results.23,24 Ergo, this study investigated lipid alterations in four groups of zebrafish, exercising and sedentary fish with normal-fat diet and high-fat diet. The analyses were performed via HPLC MS analysis and chemometric methods. So, this study opens new avenues for employing zebrafish models in metabolomic research, utilizing HPLC-MS analyses in conjunction with chemometric approaches.
Experimental
Chemicals and materials
Methanol, 2-propanol and acetonitrile HPLC-grade (> 99.9%) were purchased from Tedia Company (Fairfield, USA). Chloroform (99.8%) was purchase from Synth Company (São Paulo, Brazil). Formic acid (≥ 98.0%), ammonium acetate (≥ 98.0%) and ammonium hydroxide solution (30.0%) were purchased from Sigma-Aldrich (St. Louis, USA).
All procedures involving live animals in this study were approved by the Ethics Committee for Animal Experimentation of the Federal University of Lavras (protocol No. 042/2019) and conducted in accordance with Brazilian legislation on the use of animals in research (laws No. 11.794/2008 and No. 6.899/2009, and CONCEA (Conselho Nacional de Controle de Experimentação Animal) Normative Resolution No. 51, May 19th, 2021).25
Samples
Experiments were performed using zebrafish (Danio rerio) 5 months after fertilization with an average weight about 0.207 ± 0.01 g and standard length about 21.25 ± 1.61 mm provided by the Animal Care facilities of the Federal University of Lavras (Lavras, Brazil). The animals were purchased from a local supplier and acclimatized for 10 days in a 500 L tank before obesity induction. During the acclimatization period, the animals were fed with commercial flake food containing 43% crude protein and 6.5% crude fat (Egg Vit, Chorzów, Poland). The photoperiod was maintained at 12 by 12 h and water quality parameters, such as temperature and pH, were monitored and maintained within the ideal range for the species.26
The animals were randomly divided into four groups: normal-fat diet (NFD), normal-fat diet submitted to exercise (NFD-E), high-fat diet (HFD), and high-fat diet submitted to exercise (HFD-E). The fish were fed for 8 weeks with their respective diets until apparent satiety, divided into four daily meals (8 am, 11 am, 2 pm, and 5 pm). In the second phase of the experiment, a physical exercise protocol was introduced in animals from the NFD-E and HFD-E groups for 20 days. The previous diet set for each group was maintained.
Diet zebrafish
The two diets used in this study were semi-purified with different levels of fat (Table S1 in the Supplementary Information (SI) section)) and formulated using the SuperCrac 6.1 software (TD Software, Viçosa-MG, Brasil).27 The ingredients were mixed and moistened with water about 40%. The mixture was sent to a grinder to produce pellets, which were then dried in an oven at 55 °C for 24 h. After drying, the pellets were crushed and standardized to an average particle size of approximately 0.5 mm. Diets composition followed the Association of Official Agricultural Chemists (2005) methods for determining crude protein (method 984.13), extracts (method No. 920.39), moisture (method 930.15), and ash (method 942.05).28 Crude energy was determined using a calorimeter (model IKA C5000).
Exercising protocol
In the second phase of the experiment, a physical exercise protocol was introduced to the animals from NFD-E and HFD-E groups for 20 days. The respective diet for each group applied during the first phase of the study was maintained. A swim tunnel adapted from Palstra et al.29 was used for the physical exercise protocol. The system comprised a translucent tube immersed in a 40 L water-filled aquarium with a mechanical stirrer generating a flow of 30 cm s-1. Plastic straws induced right after the stirrer provided a laminar flow, and a net prevented the animal escape (Figure S1 in the SI section).
On the first day, the animals were placed in the swim tunnel and acclimated to a low flow rate (10 cm s-1) for 30 min. After acclimation, the animals allocated to the NFD-E and HFD-E groups underwent the physical exercise protocol, which involved sustained swimming in a laminar flow of 30 cm s-1 for 1 h per day, continuously for 20 days. The NFD and HFD groups underwent the same procedure as the exercise group, except that the mechanical stirrer was turned off, thus not generating flow in the tunnel. At the end of the experiment, all animals were anesthetized by immersion in benzocaine (250 mg L-1) and euthanized.30
Bligh and dyer extraction
For each group, three samples were collected and subjected to lipidomic studies (n = 12). Each animal (biological replicate) was submitted to the total lipid extraction protocol, and the extracts were analyzed in triplicate, generating the technical replicates (n = 36). The lipid extraction from zebrafish bodies was performed using a liquid-liquid microextraction adapted from the bligh and dyer protocol.31,32 This extraction protocol is well established in the literature for lipidomic studies, as generates an organic phase rich in mediumto low-polarity compounds, such as lipids.33-35
A homogenate was prepared by grinding fish body in methanol (100 mg mL-1) with the aid of an Ultra Turrax homogenizer T25 (IKA, Campinas, Brazil). Briefly, 250 μL of chloroform, 200 μL of water and 250 μL of zebrafish homogenate were vortexed for 1 min. Then, 250 μL of chloroform, 250 μL of methanol and 250 μL of water were added to the mixed solution. The resulting solution was vortexed for 1 min and centrifuged at 15000 rpm and 4 °C in a Mikro 200-Hettich centrifuge (Tuttlingen, Germany) for 15 min. Finally, a three-phase solution was formed consisting of an aqueous phase, a protein pellet and an organic phase composed mainly of lipids in chloroform.35 The organic phase (500 μL) was collected, and the remaining solution was submitted for re-extraction by adding 500 μL of chloroform. The re-extraction solution was vortexed and centrifuged as described above. The second organic phase was collected and mixed with the first organic phase. The extracts were evaporated in a SpeedVac concentrator (Savant SPD131DDA, Thermo Scientific, Massachusetts, USA) and dried extracts were resuspended in 1 mL of methanol prior to the HPLC-MS analyses.
HPLC-MS analysis
The HPLC-MS method was adapted from Kauhanen et al.36 The analyses were conducted on a LC-20AD (Shimadzu, Kyoto, Japan) coupled to a mass spectrometer micrOTOF-Q III (Bruker, Bremen, Germany). Chromatographic separation was performed using a C18 column (2.1 × 50 mm, 2.0 µm) at 60 ºC, with the injection of 5 µL of the sample at a mobile phase flow rate of 0.300 mL min-1 in gradient elution mode (Table 1). MS analyzes were conducted in both positive and negative ion mode using electrospray ion source with the same elution gradient program. To ensure accurate mass calibration, the MS instrument was calibrated using a tuning mix solution (Bruker Daltoniks, Bremen, Germany) prior to HPLC-MS analysis and upon each polarity switch. The calibration achieved a score of up to 99% with a standard deviation below 1 ppm.
The samples were randomized in batch during the analysis, and blank samples were analyzed after every three real samples to evaluate the background or carryover effects. The spectra were processed using the Data Analysis software version 5.0 (Bruker Daltoniks, Bremen, Germany) with mass error for peak attribution lower than 25 ppm. MS/MS data was acquired for selected m/z with a precursor selection window of 1 Da.
Chemometric analysis
HPLC-MS data from thirty-six samples (nine samples for each group, NFD, NFD-E, HFD, and HFD-E) were converted from .d files to .ASCII using the Data Analysis software. Subsequently, the data were imported into MATLAB R2024a (Math Works, Natick, MA, USA) for further analysis. A 3% relative intensity threshold was applied for data reduction/noise subtraction.
Data preparation for chemometric analysis began with a transformation step aimed at generating a single representative mass spectrum for each sample. In this step, all mass spectra acquired along the chromatographic dimension were combined by summing the signal intensities at each m/z value across time, resulting in one aggregated mass spectrum per sample. This summation-based approach preserves the overall chemical fingerprint while minimizing variability associated with individual chromatographic fluctuations.
During this transformation, internal m/z alignment was applied using a tolerance of 0.001 to ensure accurate correspondence of mass signals prior to spectral aggregation. The resulting aggregated spectra were subsequently aligned across samples using the same m/z tolerance and organized into a data matrix (X), where rows correspond to samples and columns correspond to aligned m/z features.
Peak detection was then performed on the aligned matrix using a signal-to-noise threshold of 3, retaining only centroided peaks exceeding this threshold and present in at least 50% of the samples within each experimental group. Finally, the feature intensity matrix was normalized by total ion current (TIC) to correct for global signal variations across samples, improving comparability prior to downstream metabolomic and chemometric analyses.
Principal component analysis (PCA) is a statistical technique used to simplify complexity in high-dimensional data sets by preserving the most important trends and patterns while discarding less significant variations.37 PCA was performed in the X matrix with the mass spectra from thirty-five samples with 5,291 and 1,5393 variables in negative and positive ion mode in the m/z range from 100 to 1000 Da. Furthermore, prior to data analysis, the X matrix was row-normalized by the total sum of intensities and mean centered across columns.
Partial least squares discriminant analysis (PLS-DA) is a multivariate statistical method applied in situations where there is a known categorical response variable (classes or groups).38,39 PLS-DA was used to build a classification model (once the sample groups were already known) for all four sample groups. The PLS-DA classification was applied based on Bayes decision theory with threshold calculation by the normal probability density function.40 The selection of the number of latent variables (LVs) for the modeling was carefully determined using a five-fold cross-validation method. The cross-validation process aimed to minimize the classification error and maximize the model accuracy. Specifically, we evaluated the model performance using various numbers of LVs and selected the optimal number based on the minimum classification error rate. The classification error rate was calculated as the proportion of misclassified samples in the cross-validation process, with the accuracy being the complement of the classification error (i.e., accuracy and error sum to 100%). Additionally, it is reported the figures of merit as sensitivity and specificity to validate the model performance and the cross-validation results (Table S2 in the SI section).34
Ordered predictors selection discriminant analysis (OPSDA) was used with the aim of identifying the variables that most effectively differentiate between the classes.41,42 This method is based on an informative vector that contains information about the location of the best response variables for classification. The length of this vector matches the number of independent variables and can be derived through several computational methods involving the X matrix columns (independent variables) and class variables (y). Initially, several informative vectors were tested to determine their effectiveness in ordering the variables by importance for classification. Once an informative vector is obtained, the independent variables in the X matrix are ranked according to their absolute values in this vector. The variable with the highest absolute value is considered the most important, and the variables are sorted in descending order of importance. PLS-DA models are then constructed and evaluated using a cross-validation approach. Initially, a subset of ten variables (window) is selected to build and evaluate the first model. This subset is subsequently expanded by adding a fixed number of five variables (increment), and new PLS-DA models are built and assessed. This process continues until all, or a predetermined percentage of variables are included. Cross-validation metrics are calculated for each model (OPSDA and PLS-DA), and the subsets are compared to determining the best set of variables.
In our study, the variable importance on projection (VIP) and regression vector (REG) combined were selected as the most effective informative vectors. The OPSDA method facilitated the discovery of discriminative variables by using these vectors to prioritize the variables that contribute most significantly to class differentiation. This approach enhanced the understanding of the underlying differences among the sample groups and improved the classification model performance. All chemometric analyses were performed into MATLAB R2024a using custom-built algorithms.
Putative annotation
The variables (m/z peaks) responsible for discriminating against each group were provided by PLS-DA analysis with OPSDA variable selection. Therefore, the selected variables for group classification were normalized in importance, which in this study refers to the VIP score given by the chemometric methods. The putative annotation for the selected variables for all four groups classification was performed by comparison with LIPIDMAPS database43 regarding exact mass with a mass error lower than 25 ppm and the MS/MS spectra of each variable.
Results and Discussion
HPLC-MS analysis
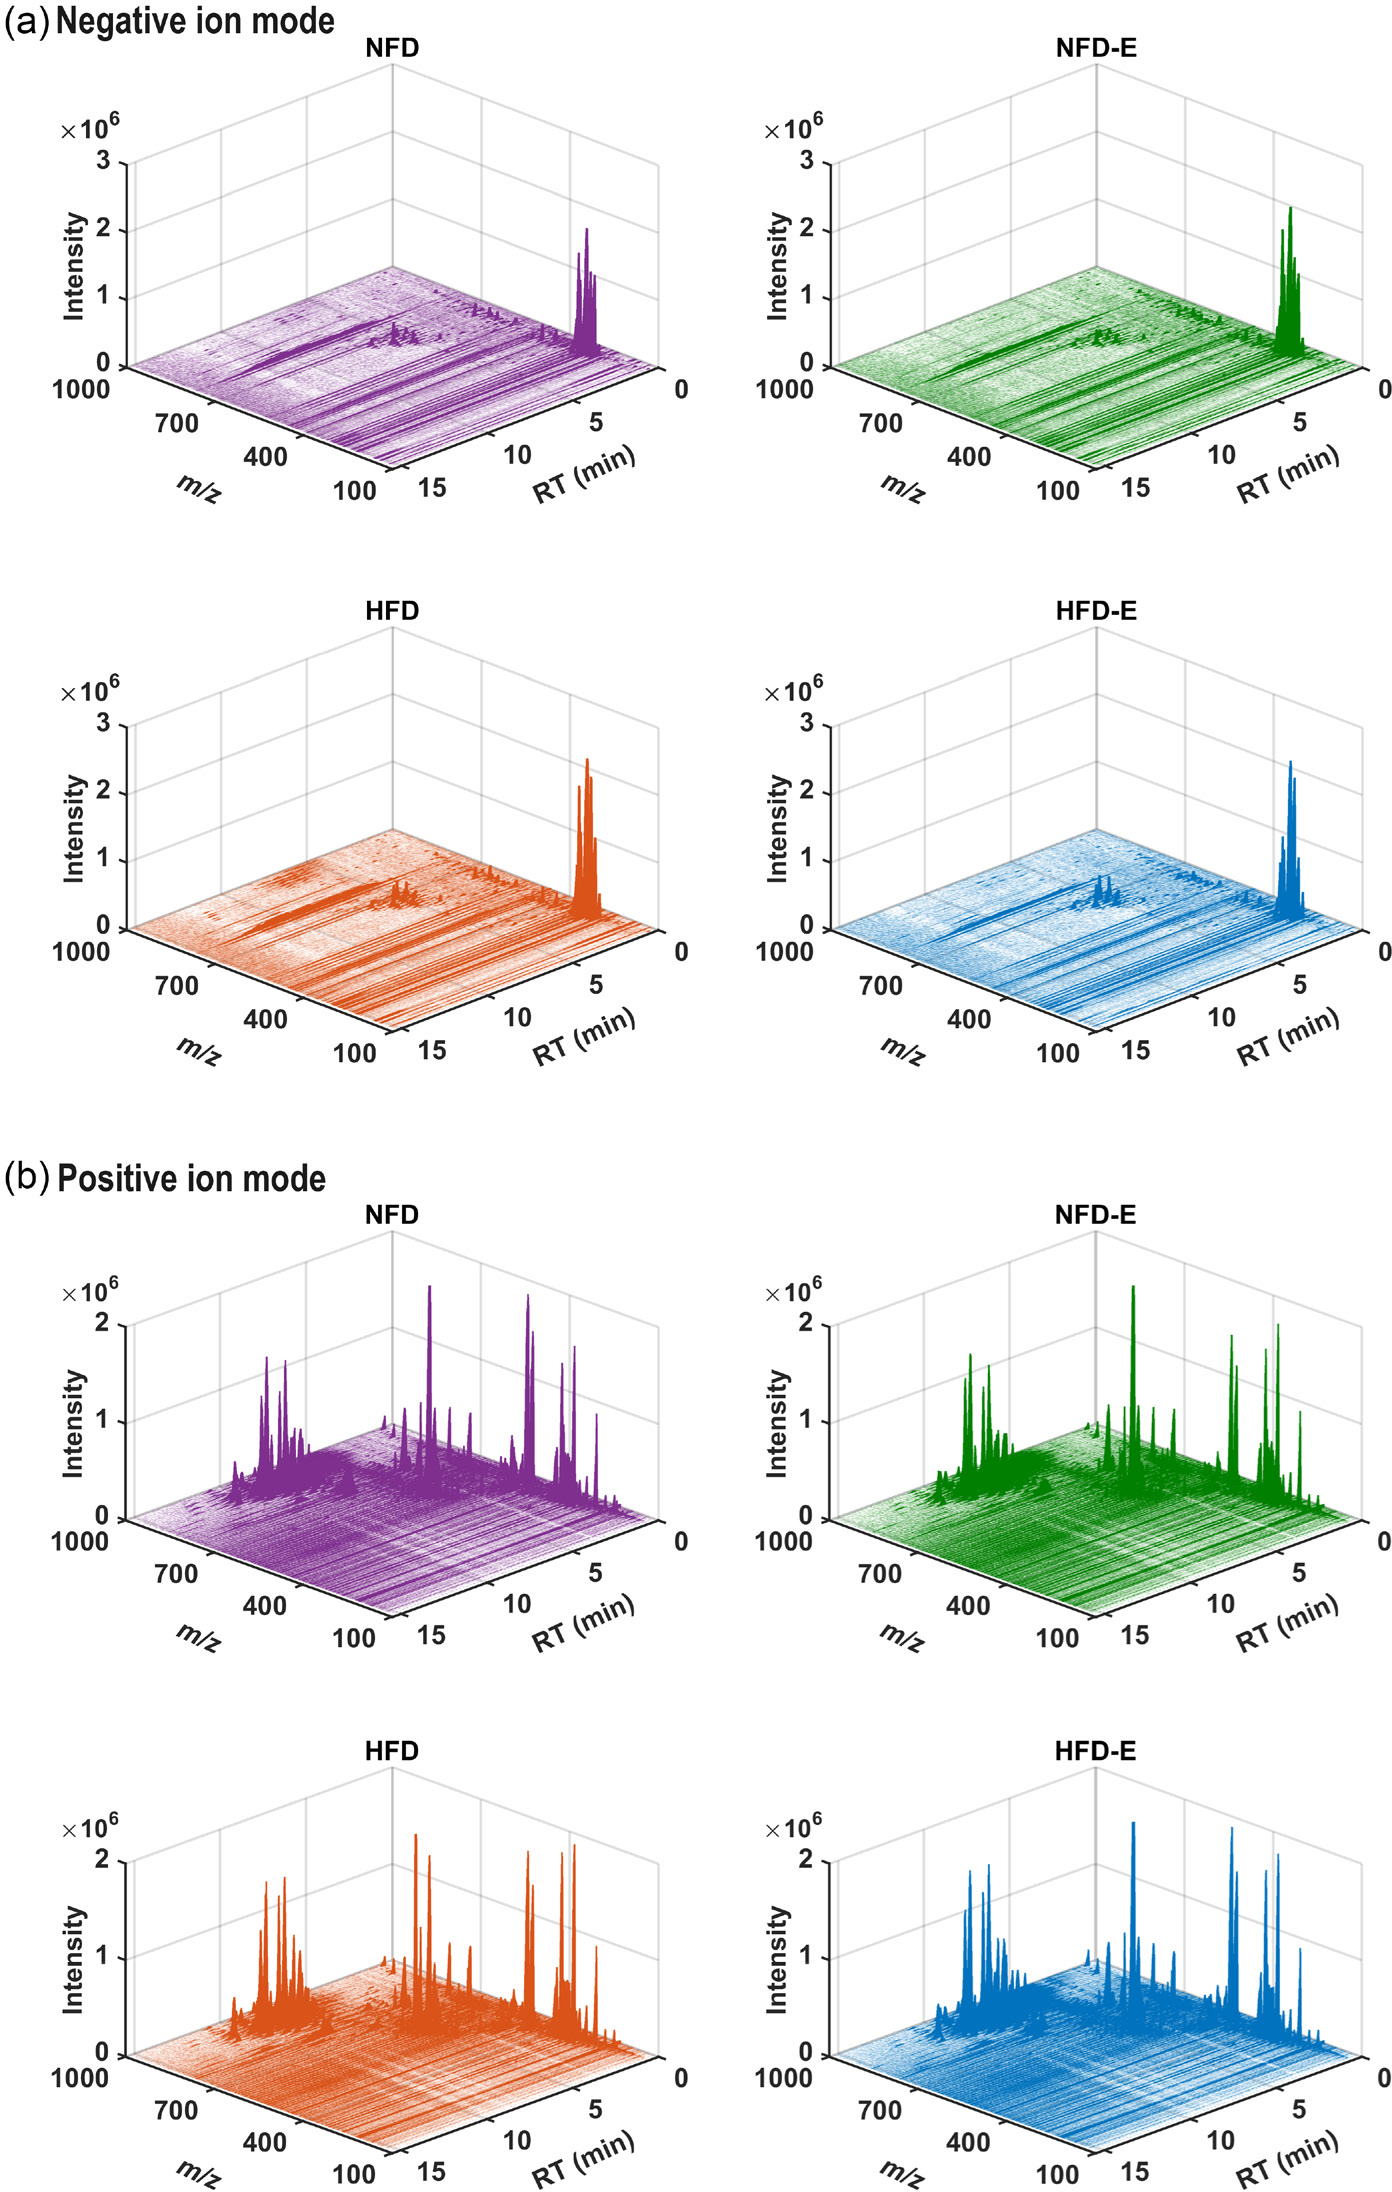
The lipid extraction from zebrafish was conducted by an adapted protocol proposed by bligh and dyer for further analyses via HPLC-MS.31,32 The chromatograms and mass spectra provide an overview of the metabolic profiles associated with each experimental condition (NFD, NFD-E, HFD, and HFD-E). Figure 1 enables the comparison of the raw data for each group in positive and negative ion mode, including the groups subjected to different diets and the exercise group. Thus, a brief visual analysis allows the observation of how these conditions influenced the metabolic profile of each group.
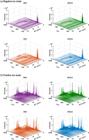
Three-dimensional HPLC-MS chromatograms of zebrafish sample groups; (a) presents the chromatograms in negative ion mode, while (b) in positive ion mode, corresponding to the groups NFD, NFD-E, HFD, and HFD-E. These plots are oriented to provide an optimal point of view, showcasing the intensity of detected ions over retention time and mass-to-charge ratio.
Numerous HPLC-MS methods for lipidomics assays are reported in literature with a predominant use of reversed-phase elution mode, particularly employing C18 and C30 columns for lipid separation.44,45 The efficacy of these methods relies on the interaction between the carbon chains of the stationary phase and those of the lipid molecules, facilitating the lipids separation based on their carbon chain length and degree of saturation. In reversed-phase separation, lipids with shorter carbon chains elute faster, whereas those with longer chains take longer to elute. Additionally, saturated lipids elute after their polyunsaturated counterparts of the same chain length.46
Regarding the choice of mobile phases in these methods, considerable discussion revolves around solvent strength. Strong and effective interactions may occur between the stationary phase and less polar lipids, such as cholesteryl esters (CE) and triglycerides (TG). Consequently, certain methods necessitate prolonged chromatographic runs to promote adequate elution of these compounds. While methanol and acetonitrile represent the most employed mobile phase in lipidomics, discussions have arisen concerning the potential advantages of 2-propanol and butanol. The use of these solvents has been debated due to their greater strength in reversed-phase conditions, which may lead to enhanced peak resolution and a reduction in chromatographic run duration. In terms of modifications, the use of formic acid, ammonium acetate and ammonium hydroxide has been encouraged once their presence in mobile phase can enhance the detection of several lipid species in MS detection.46
The sample composition is an important parameter to take into consideration regarding chromatographic methods. Here, employing a C18 analytical column as stationary phase, aqueous solution of formic acid (positive ion mode) or ammonium hydroxide (negative ion mode) as the mobile phase A and modified acetonitrile:2-propanol as the mobile phase B in gradient elution mode enabled the elution of lipid extracts from zebrafish body. As shown in Figure 1, the compounds in negative ion mode eluted from 0.6 to 12 min (Figure 1a), and in positive ion mode, the compounds eluted from 0.5 to 11 min (Figure 1b). Furthermore, the chromatographic run was maintained at 15 min to ensure the total elution of any interferent retained in the column, avoiding potential carryover effects. Furthermore, blank samples were acquired after every three real samples to ensure the absence of carryover effects and to assess the analytical background, which provided greater reliability in the analysis of lipids in the real samples.
The bligh and dyer organic phase yields a sample rich in mid to non-polar compounds. Consequently, it is observable that these mid polar compounds exhibit low affinity for the chromatographic column (non-polar stationary phase) and thus are eluted at the onset of the run when the mobile phase still comprises 15% of aqueous fraction. Moreover, it was observed that, in the positive ion mode, compounds with higher m/z values (m/z 700-1000) exhibited greater affinity with the stationary phase and had retention times exceeding 8 min. These differences rely on the classes of lipids assessed in each ion mode, as fatty acyls in negative ion mode and glycerophospholipids and sphingolipids in positive ion mode.
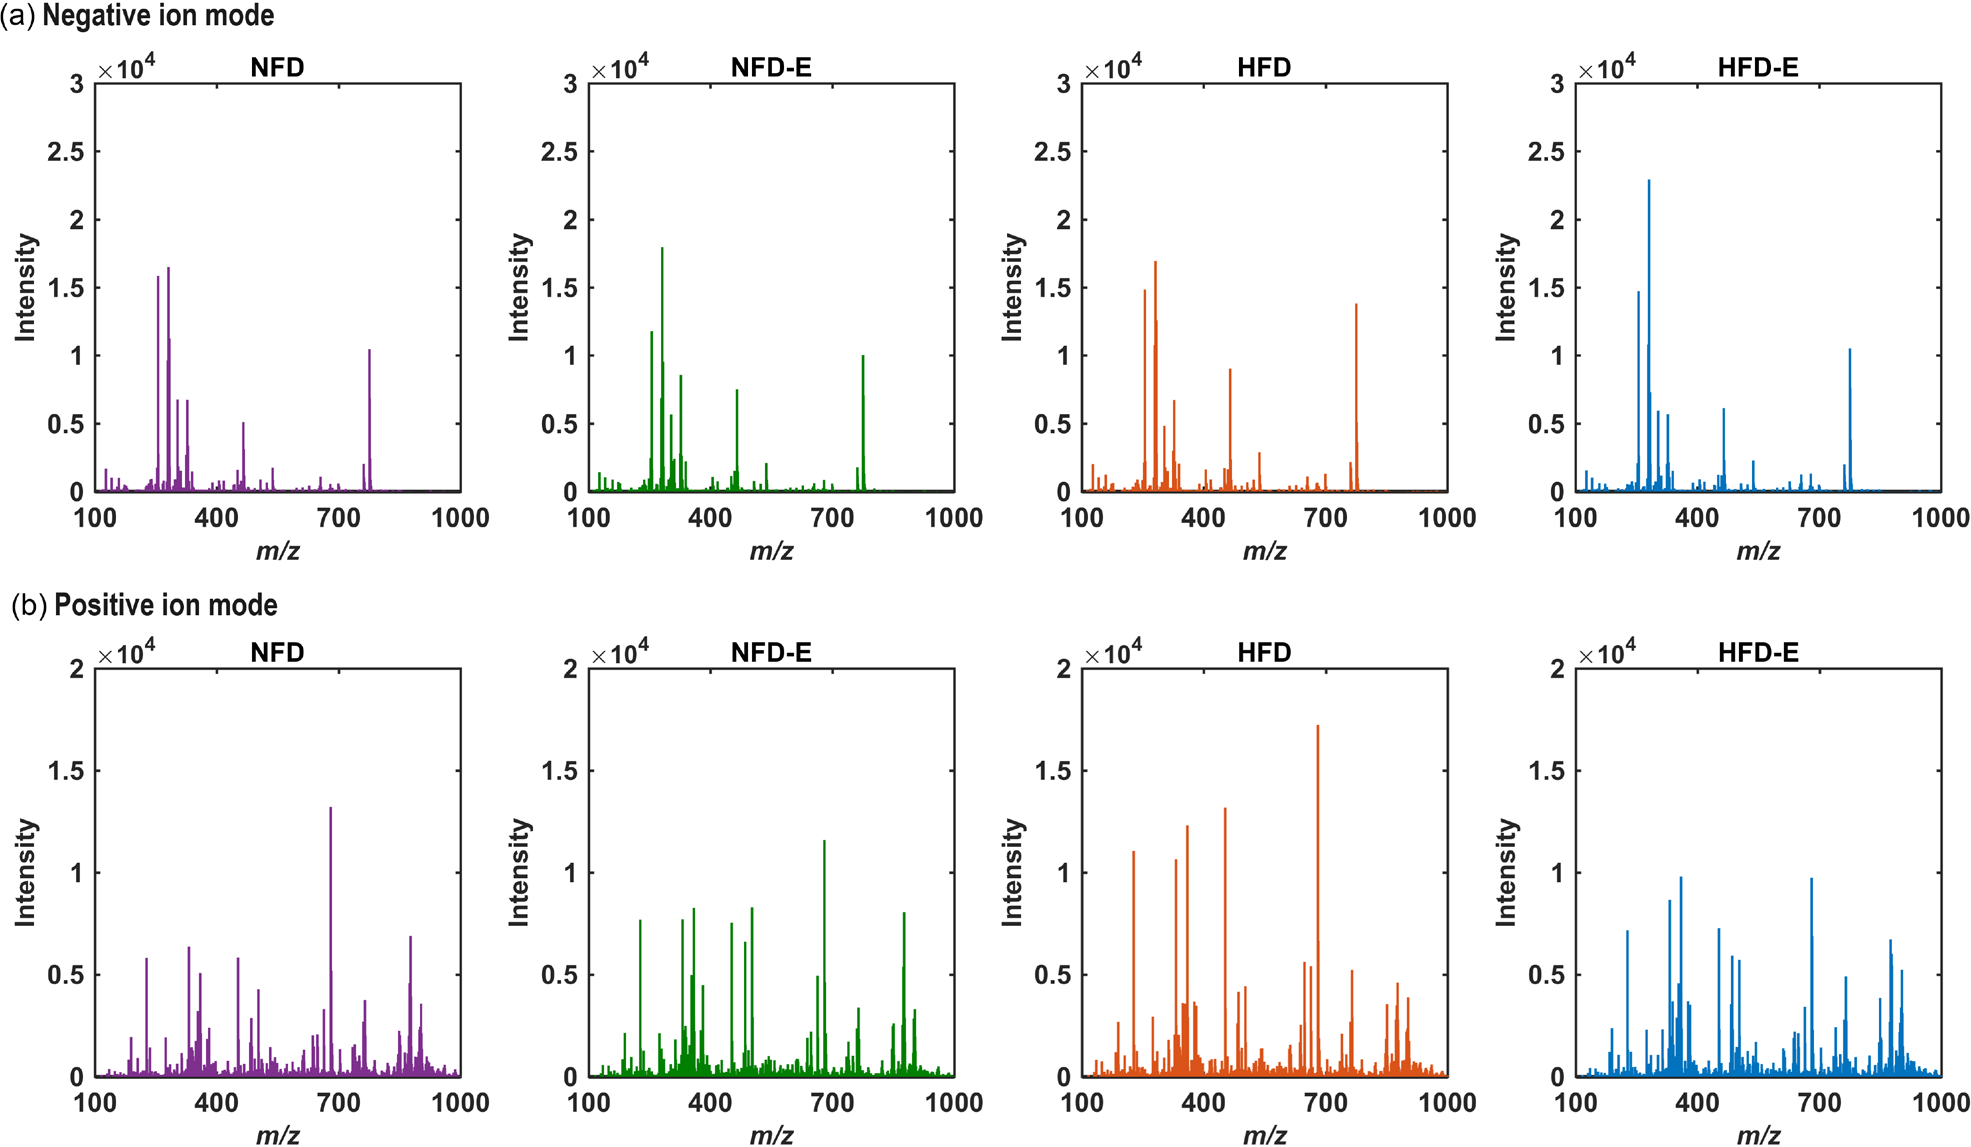
MS spectra provided the accurate mass for extracted lipids (Figure 2). Thus, putative peak annotation was conducted using exact mass with a mass error lower than 25 ppm and the MS/MS spectra at the LIPIDMAPS database43 for the most important lipids responsible for each sample group classification. The extracts exhibited contents of phosphocholines (PC), fatty acids (FA), ceramides (Cer), phophoethanolamines (PE), lysophosphatidic acid (LPA), sterols (ST), CE and more. The comprehension of the modifications induced by these compounds can yield valuable insights into the conditions of zebrafish, including variations in diet and exercise regimens. Nevertheless, manual examination of these variances is rendered impractical by the high number of variables present in the data. Consequently, the utilization of statistical methodologies can effectively address this challenge.

Average mass spectra from HPLC-MS data, representing the combined ion signals across the entire chromatographic run of zebrafish sample groups; (a) and (b) show the spectra for NFD, NFD-E, HFD, and HFD-E in negative and positive ionization modes, respectively.
Chemometrics analysis
The HPLC-MS data provided enormous number of variables (from ca. 5,000 to ca. 15,300 in negative and positive ion modes, respectively). These variables afford opportunities for scrutinize significant distinctions within each zebrafish group, thereby unveiling variations induced by diverse dietary and exercise regimens. In this context, the application of chemometric tools emerges as a compelling solution.
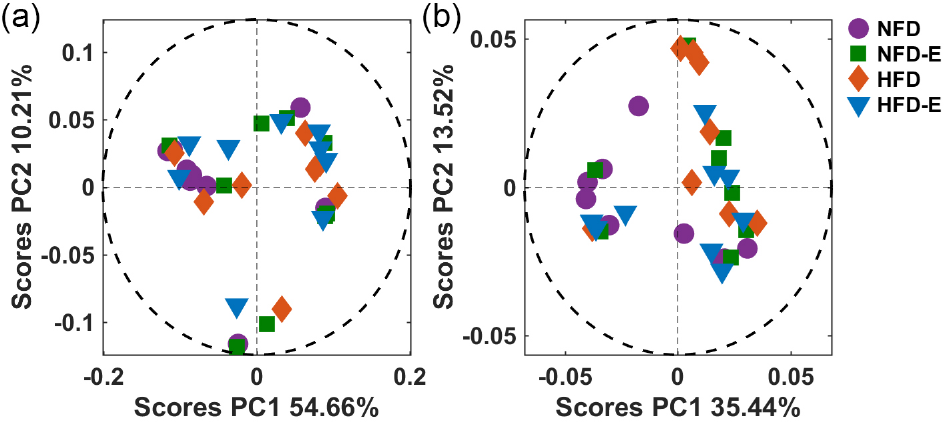
A preliminary exploratory analysis utilizing PCA was performed to reduce the complexity of the dataset and clarify the distinctions among the zebrafish groups. The dataset reduction involves transforming the original dataset into a fresh set of variables known as principal components (PCs), as shown in Figure 3.
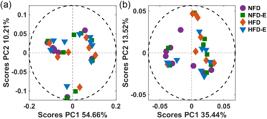
PCA scores of zebrafish sample groups; (a) and (b) present the scores for NFD (●), NFD-E (■), HFD (♦), and HFD-E (▲), acquired in negative and positive ionization modes, respectively. The dashed black lines represent the 95% confidence level ellipses.
Figure 3a illustrates the scores of PCA analysis in negative ion mode, which depicture that principal component 1 (PC1) and principal component 2 (PC2) were able to explain 35.44 and 13.52% of the variation in the data from zebrafish lipid extracts subjected to NFD, NFD-E, HFD and HFD-E. In positive ion mode (Figure 3b), PCA analysis demonstrated that PC1 is responsible for 54.66% of the variation while PC2 explained 10.21%. Based on the main observations in both ion modes of HPLC-MS data, the PCA evaluation shows no clear separation among the different classes of zebrafish samples. This result suggests that although there are metabolic differences between classes, these differences are not adequately represented by the first two principal components. Consequently, this suggests the need for a more sophisticated analysis method to discern the subtle differences among the groups. Therefore, PLS-DA with OPSDA was applied to achieve an adequate separation among the zebrafish groups submitted to different diets with or without physical exercise to select the variables that most contributed to this differentiation.
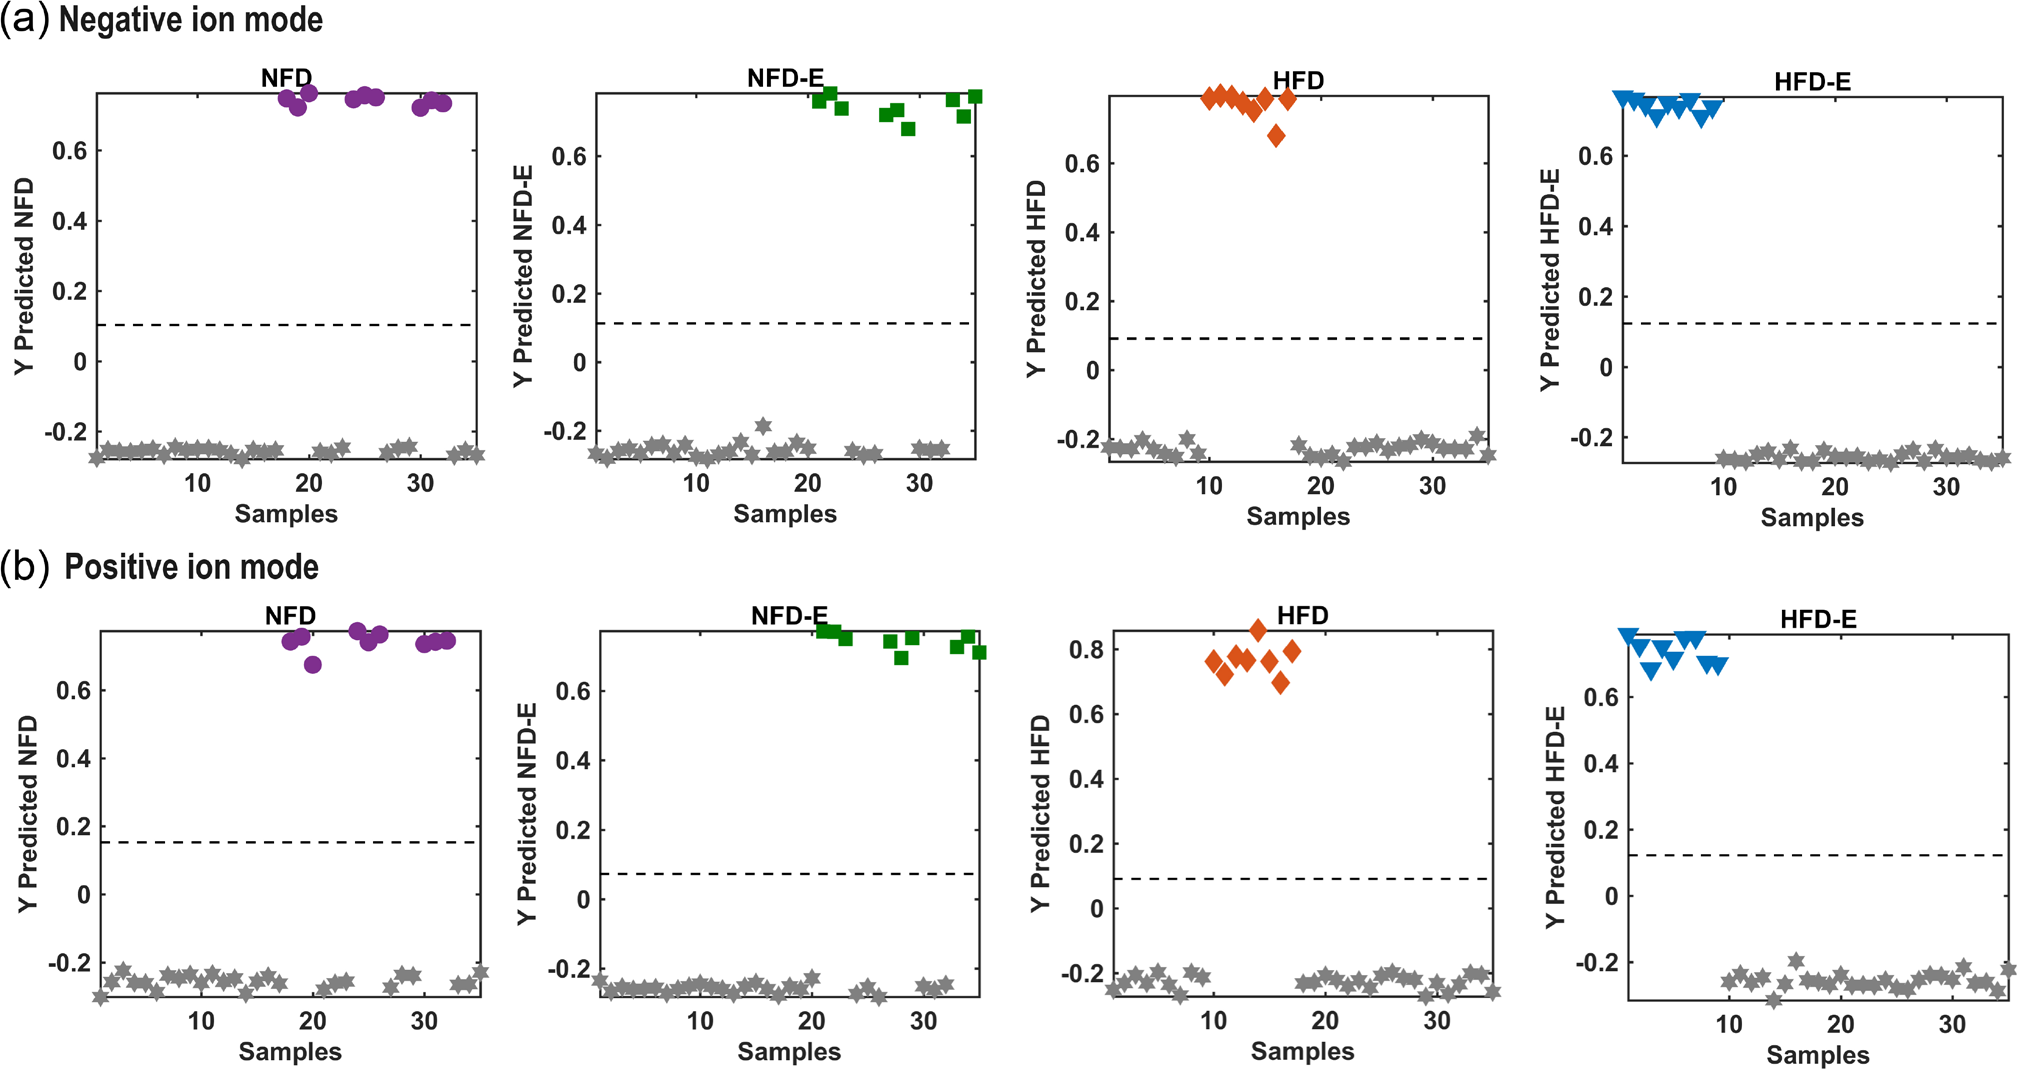
PLS-DA is a supervised chemometric method derived from PLS regression used to classify samples into known groups and predict the class of unknown samples.47 This approach is particularly advantageous in the classification and characterization of datasets with high dimensionality, such as HPLC-MS data. Figure 4 presents the results of a PLS-DA with OPSDA variable selection by using VIP and REG scores combined in negative ion mode (Figure 4a) and positive ion mode (Figure 4b). The PLS-DA OPSDA models exhibited remarkable classification performance for zebrafish groups in both ionization modes, achieving 100% accuracy, with all samples correctly assigned to their respective classes. Notably, the inclusion of OPSDA-selected variables led to substantial improvements in classification metrics compared to the standard PLS-DA models. For instance, in the negative ion mode, sensitivity, specificity, and accuracy for PLS-DA OPSDA models reached 100% across all groups (NFD, NFD-E, HFD, and HFD-E), compared to maximum values of 44, 84, and 71% respectively for standard PLS-DA. Similarly, in the positive ion mode, the PLS-DA OPSDA models achieved 100% across all metrics, significantly outperforming the standard PLS-DA, where sensitivity ranged from 33 to 44% and accuracy peaked at 80%. Further classification parameters, including error rates and group-specific comparisons, are detailed in Table S2 (in the SI section).
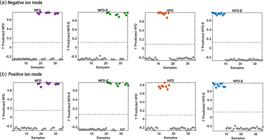
Classification by PLS-DA model with selected variables by OPSDA for the prediction of zebrafish sample groups NFD (●), NFD-E (■), HFD (♦), and HFD-E (▲) in (a) negative and (b) positive ion mode. Each plot displays the classification of one class against the others, with the dashed line representing the threshold.
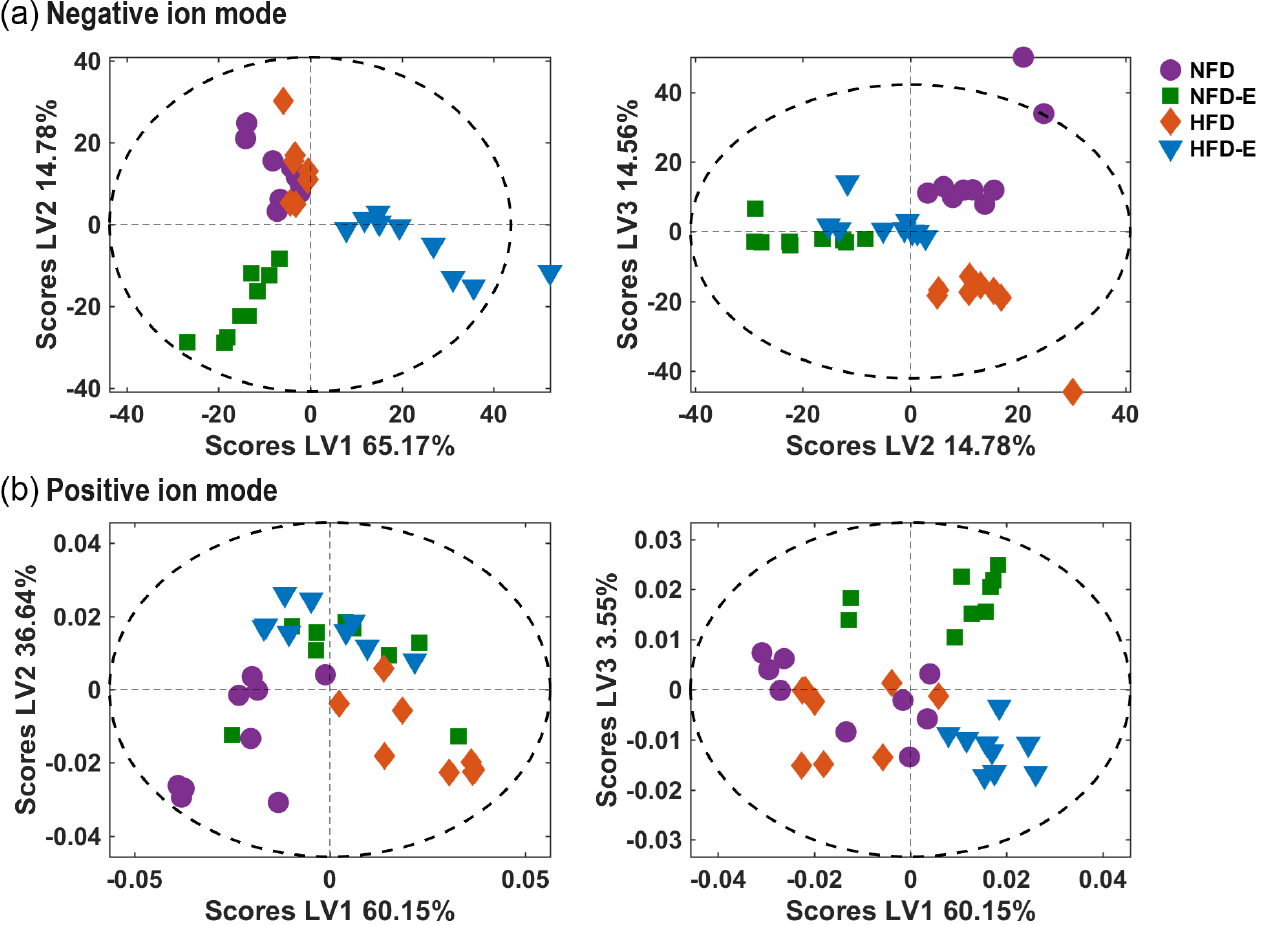
In addition to the classification plot in Figure 4, the separation of zebrafish groups can also be observed in the scores plot of the LVs from PLS-DA, as presented in Figure 5. This detail provides further insight into how the LVs contribute to differentiating between the zebrafish groups, highlighting the method efficacy in revealing the underlying data structure.
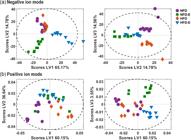
PLS-DA OPSDA scores of zebrafish sample groups; (a) and (b) present the scores for groups NFD (●), NFD-E (■), HFD (♦), and HFD-E (▲), acquired in negative and positive ionization modes, respectively. The dashed black lines represent the 95% confidence level ellipses.
In the PLS-DA OPSDA model for the negative ion mode, three LVs were employed for the classification. The plot of LVs scores in two dimensions provided an intuitive visualization of the PLS-DA ability to segregate groups based on their spectral data. In Figure 5a, LV1 demonstrates a trend towards separating the diets, particularly within the subsets involving exercise (NFD-E and HFD-E). However, it is primarily LV2 that clearly separates the samples based on exercise, irrespective of diet. While LV1 and LV2 facilitate some degree of distinction, they alone do not effectively separate the diets within the non-exercise groups. Therefore, LV3 is instrumental in delineating this separation, enabling a more definitive distinction between the four groups in terms of both diet and exercise.
In the PLS-DA OPSDA model in the positive ion mode, five LVs were employed for the classification. In Figure 5b, the scores for LV1 and LV2 provide a nuanced perspective on group differentiation. LV1 predominantly discriminates between the NFD and HFD diets; however, it does not effectively delineate the samples concerning exercise involvement. Conversely, LV2 exhibits a substantial inclination to segregate the groups based on their engagement in exercise. With respect to the combined LV1 by LV3 plot, it is discernible that LV3 facilitates the distinction between the diet groups that involve exercise, yet it does not comprehensively separate the groups across both diet and exercise conditions as initially suggested. It is important to emphasize that outlier tests were performed, and all samples were within the accepted limits; therefore, no true outliers were identified.
To summarize, the comprehensive visual separation of the four zebrafish groups was achieved through the utilization of three LVs in both negative and positive ion modes. The deployment of these LVs enabled the distinct stratification of the groups, with each LV playing a pivotal role in the classification process. In the negative ion mode, the combination of LV1, LV2, and LV3 was imperative for differentiating the samples based on their respective diets and exercise regimens. In the positive ion mode, LV1 effectively separated the diets, while LV2 and LV3 were instrumental in differentiating the impact of exercise, particularly with clear segregation of LV3 within the exercised groups. This layered approach underscores the intricate relationships between dietary intake and physical activity and illustrates the necessity of leveraging multiple LVs to adequately dissect the complex spectral information into clear, interpretable classes.
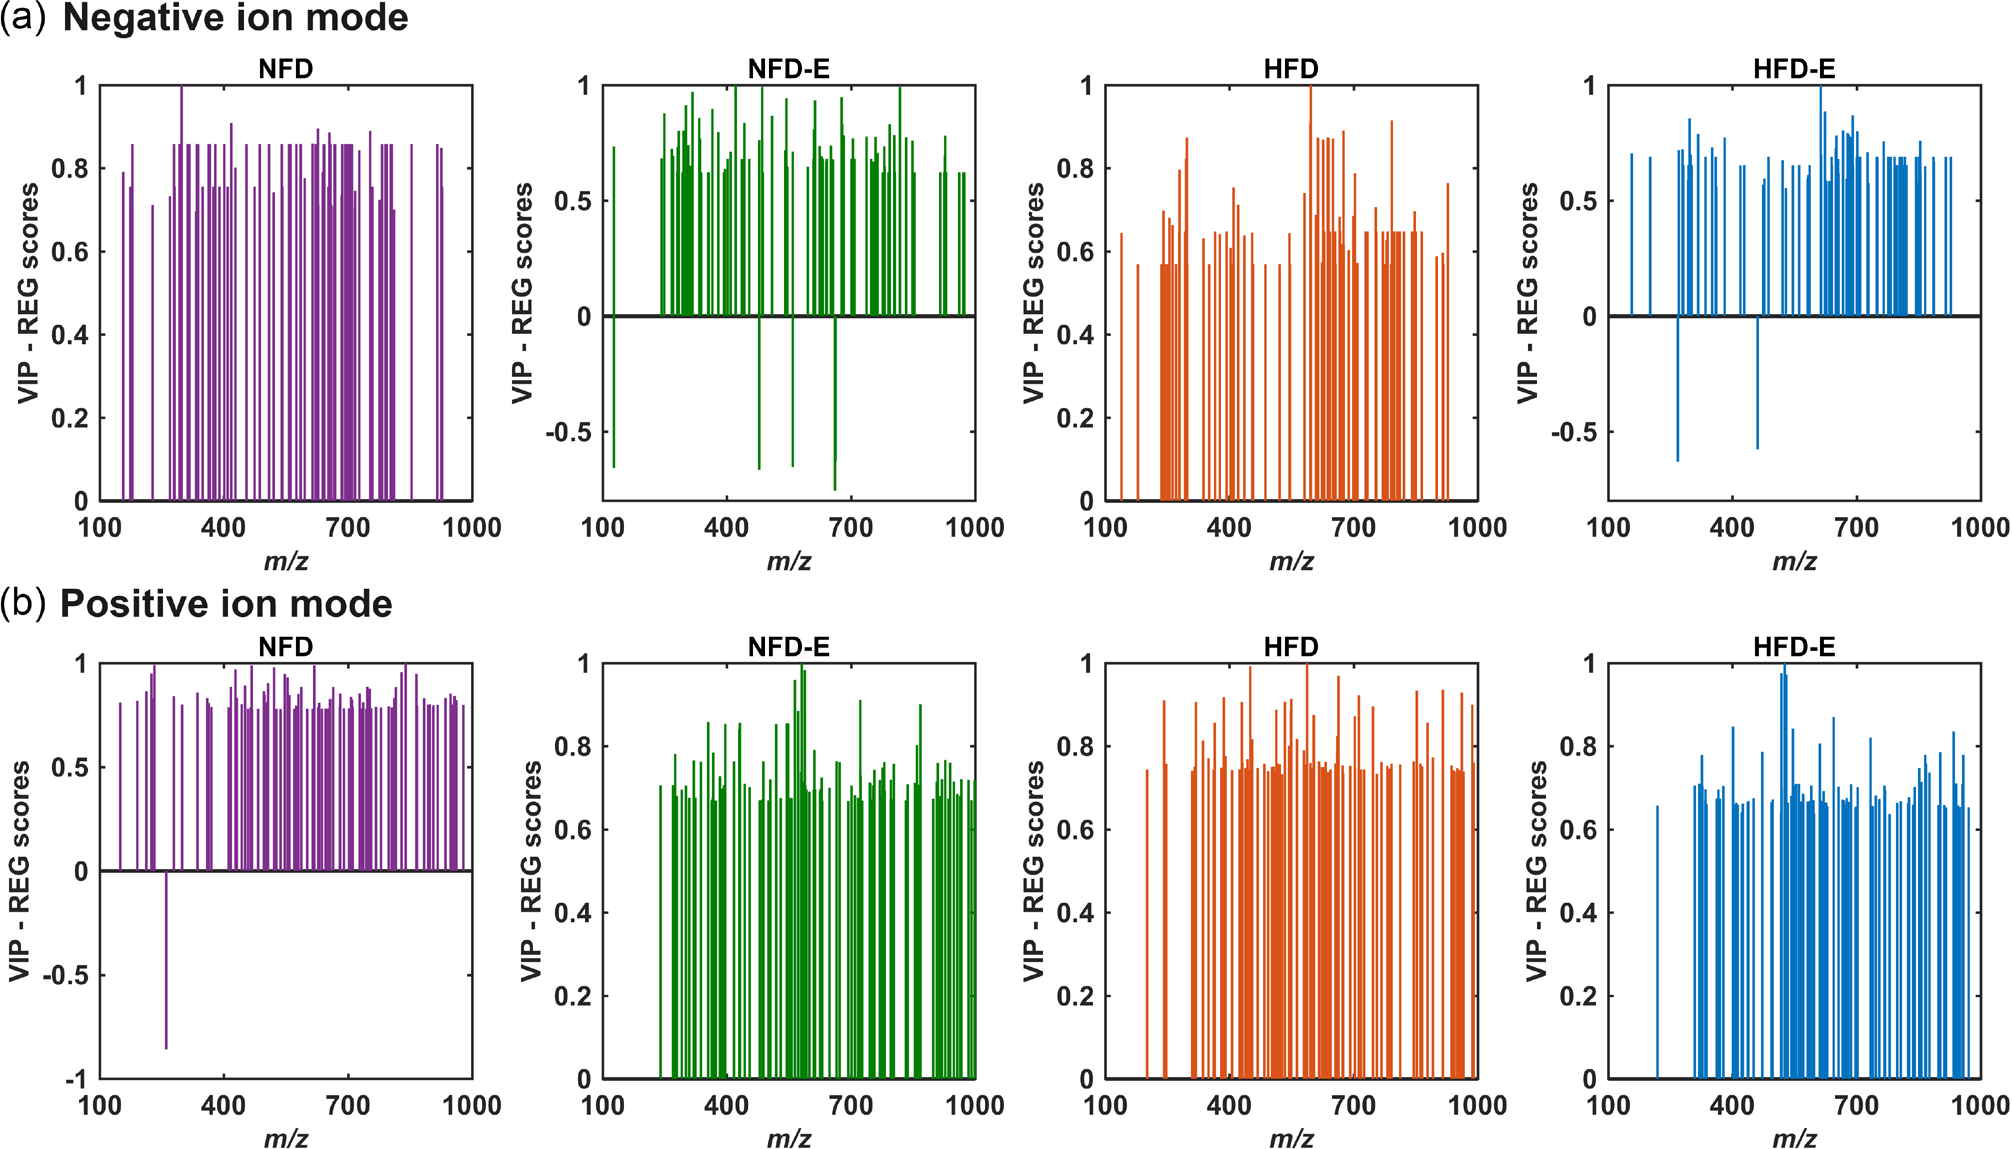
The distinct class separation facilitated by the PLS-DA OPSDA models, with the VIP and REG scores combined as an informative vector, enables the identification of variables responsible for this classification. In this study, classifying zebrafish groups was a secondary consideration. The primary focus was the application of PLS-DA and OPSDA approaches to ascertain the most pivotal variables for group classification. This methodological choice afforded a deeper comprehension of the essential factors that differentiate the groups, thus highlighting the critical role of variable selection in the analytical framework.
OPSDA reduced the data set from 5,291 variables in negative ion mode to 129 relevant variables for group classification, and 15,393 variables in positive ion mode to 160. These selected variables were then scrutinized against databases. Following a systematic evaluation, lipid species were annotated using a putative identification approach based on high-resolution mass spectrometry data. The LIPIDMAPS spectral library43 was employed for putative candidate annotation, using the multiple lipid class search function to account for various lipid classes and adducts. The exact m/z values were calculated with a mass tolerance of ± 25 ppm. For negative ion mode, deprotonated adduct for fatty acids, ceramides, glycerolipids, and sterol lipids was considered. In positive ion mode, sphingolipids and glycerophospholipids were annotated using the protonated, sodium, and double protonated adducts criteria. Annotations were made based on exact mass matching and allowed adduct types and MS/MS fragmentation data, providing level 2 of annotation. This rigorous analysis culminated in the identification of the compounds that are delineated in Table 2. These compounds likely hold the key to understanding the chemical / biochemical distinctions between the zebrafish groups under study. The 25 variables exhibiting the highest VIP scores were selected owing to their contribution to group discrimination; however, not all variables could be successfully annotated due to the absence of corresponding matches in the available databases.
Comprehensive lipids annotation of the most important variables for zebrafish group classification as identified by VIP and REG scores combined in PLS-DA OPSDA models
As previously stated, the compounds selected by OPSDA were responsible for classifying each class. Nevertheless, the interpretation of the selected variables proved intricate due to their uniform weighting in VIP and REG scores, thereby impeding the discernment of specific metabolites or markers associated with each diet and/or exercise conditions. Corroborating the result, Figure 6 illustrates the scores by PLS-DA OPSDA of selected variables for each group (NFD, NFD-E, HFD, and HFD-E) in negative (Figure 6a) and positive (Figure 6b) ion modes. The scores are detailed in Tables S3 and S4 (in the SI section). As observed, the differences are not remarkable, suggesting that the variables have relatively similar importance for the characterization of each class.
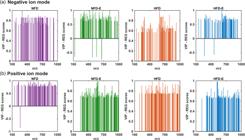
VIP and REG scores combined of selected variables by OPSDA; (a) and (b) preent the scores for groups NFD, NFD-E, HFD, and HFD-E in negative and positive ion modes, respectively.
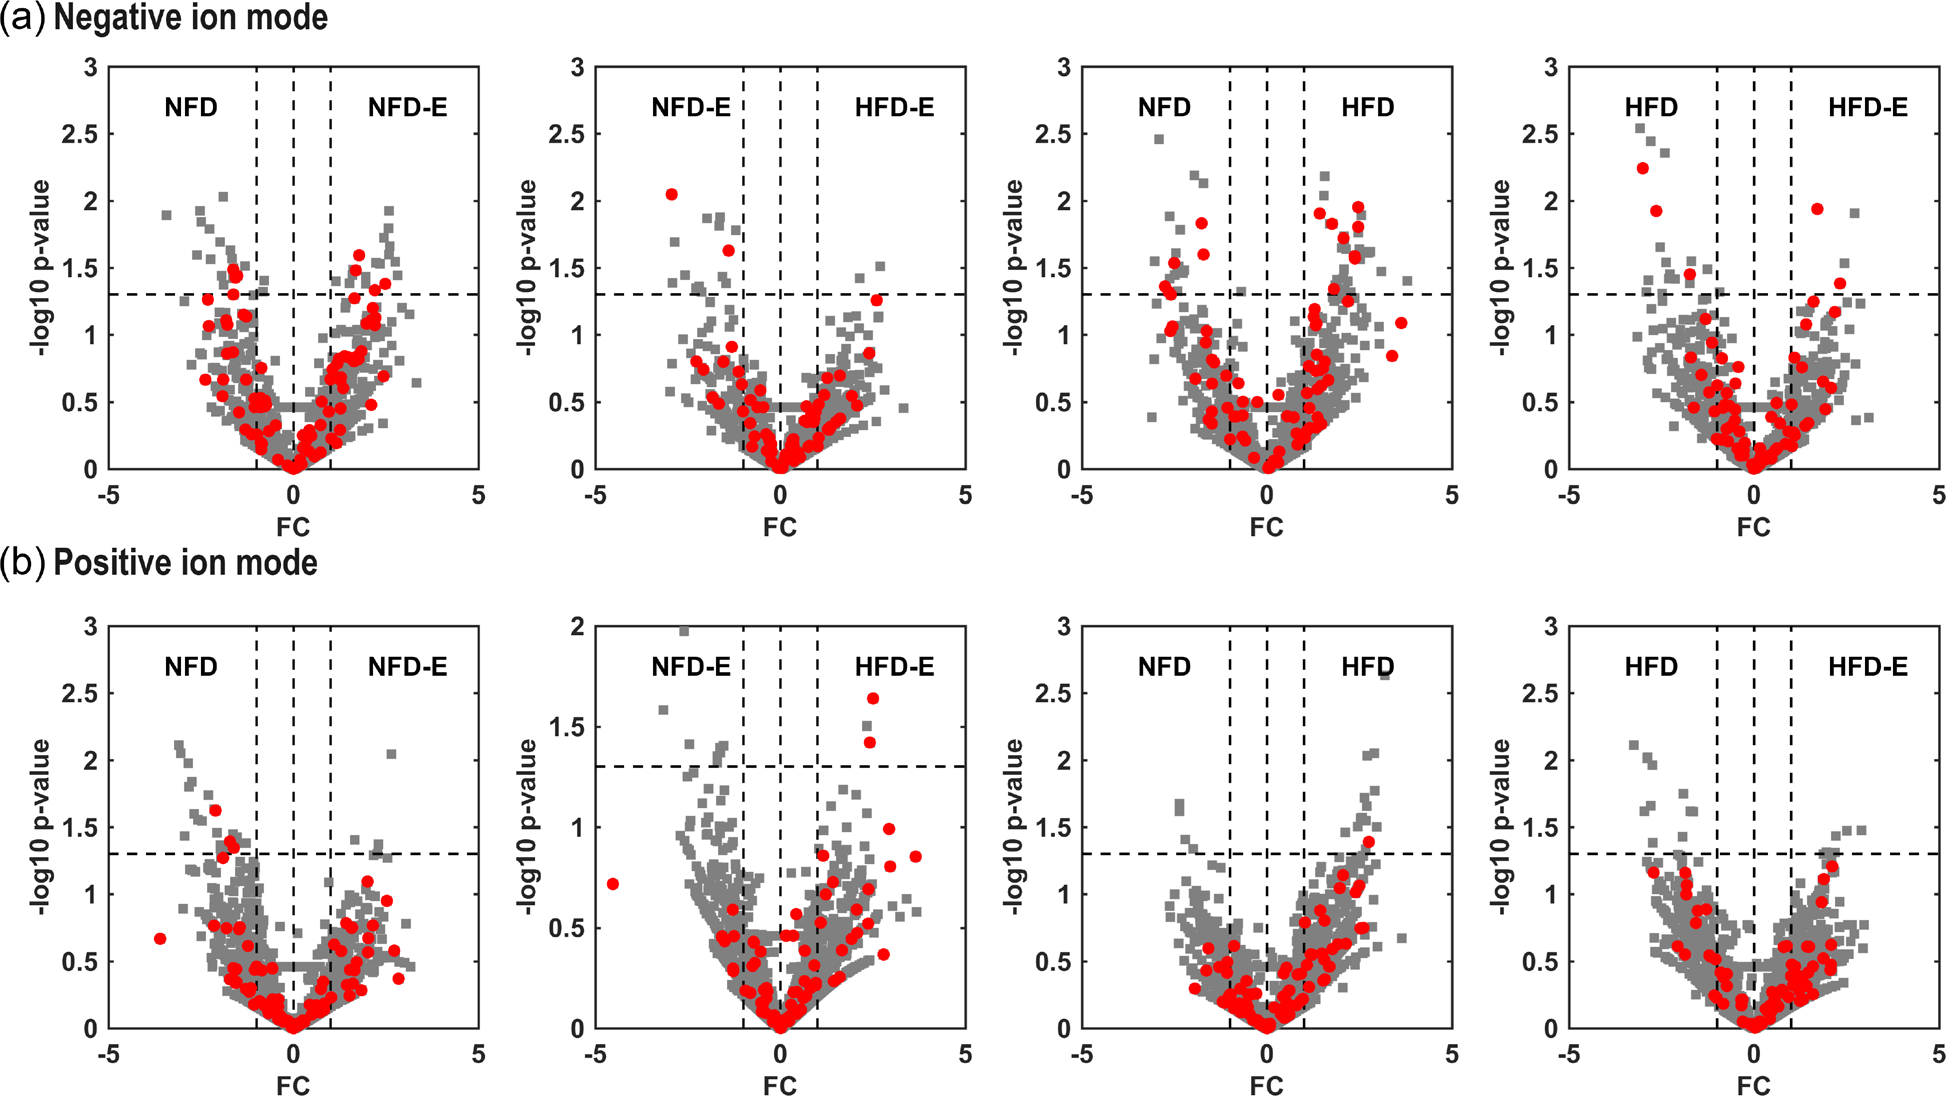
Therefore, while the selected variables were effective in distinguishing between the classes overall, they did not provide clear interpretative information or specific insights into the metabolites or metabolic pathways associated with each condition. Addressing the challenge highlighted by our results from PLS-DA with OPSDA, where the selected variables in classification proved insufficient for detailed interpretation, it is turned to the volcano plot as a solution to bridge this gap. The volcano plot facilitated a nuanced visualization of the fold changes (FC) of variables between two paired zebrafish groups. This approach was paramount in our comparative analysis, enabling the examination of expression level differences across four specific pairings: NFD vs. NFD-E, NFD-E vs. HFD-E, NFD vs. HFD, and HFD vs. HFD-E. Volcano plots were generated based on HPLC-MS data intensity obtained in negative (Figure 7a) and positive (Figure 7b) ion modes, each contrasting two different zebrafish classes.
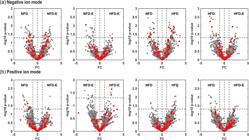
Volcano plots showcasing the differential expression of variables in zebrafish classes under (a) negative ion mode and (b) positive ion mode. Red circles indicate the variables selected by OPSDA. Vertical and horizontal dashed lines were the fold change (FC) threshold of ±1 and 1.3 -log10 p-value (95% confidence level), respectively.
Employing the volcano plot, which plots the negative logarithm of the p-value against the log2 FC, provided a clear graphical representation of both statistical significance and the magnitude of change in expression. This visualization strategy was particularly effective in identifying variables that were statistically significant, highlighting those with considerable up-regulation or down-regulation between the compared classes.
Consequently, by utilizing the volcano plot, we were able to overcome the limitations previously encountered with focused classification directions. It enabled us to efficiently isolate and scrutinize key variables showing significant differential expression, offering a deeper insight into the intricate biological dynamics at play. This methodical approach underscored the utility of the volcano plot as a pivotal analytical tool in our study, guiding the identification of variables for further in-depth analysis.
The volcano plots presented in Figure 7 provide a compelling graphical representation of the differentially expressed variables between the zebrafish classes, delineated by both negative and positive ion modes. The selected variables by OPSDA (red circles) stand out against the backdrop of other variables, depicted as gray squares, which did not meet the selection criteria.
The observed discrepancies in variable selection, with some variables chosen by OPSDA falling outside the significance area of the volcano plot and vice versa, underscore the fundamental differences in the methodological approaches. OPSDA is a multivariate method that selects a set of variables based on the multivariate nature of the dataset, considering the complex interdependencies between variables. In contrast, the volcano plot evaluates each variable individually using univariate statistics, which does not account for the relationships between variables.
Moreover, the volcano plot is inherently limited to comparing two groups of samples at a time, whereas multivariate statistics, like those used in OPSDA, have the capacity to differentiate between all four classes concurrently. This ability to handle multiple classes simultaneously is particularly advantageous in complex biological systems where the interactions between variables can be intricate and multilayered.
Therefore, to render the OPSDA-selected variables interpretable, the volcano plot was employed as an ancillary tool. It was used to pinpoint variables that not only showed statistical significance on a univariate level but also belonged to the subset of variables selected by OPSDA. By doing so, it allowed us to reconcile the multivariate nature of the dataset with the need for univariate statistical significance, thus facilitating an interpretative analysis. This integrative approach enhances the robustness of our findings, ensuring that the variables we focus on for interpretation are both multivariately relevant and univariately significant.
Table 3 provides a curated selection of ions that have been identified as significantly altered across four distinct zebrafish groups. The data were meticulously extracted from a comprehensive volcano plot analysis, where statistical rigor was applied using a combination of significance variables in t-test and FC with those selected by OPSDA.
Interpretative variables (m/z values) selected by volcano plot and OPSDA insights. The gray cell indicates a significant occurrence of the variable in each condition, illustrating the metabolic impact of diet and exercise
The significant selections indicated in Table 2 are poised to guide further inquiries into metabolic pathway analyses and potential biomarker discovery. They provide a snapshot into the metabolic reprogramming that occurs in response to lifestyle interventions and hold promises for advancing our understanding of the mechanistic links between diet, exercise, and metabolic health.
In the negative ion mode, FA(16:0), selected in the HFD group and its exercised counterpart HFD-E, suggests a metabolic biomarker associated with high-fat consumption that persists irrespective of exercise. In contrast, ST(21:5;O3), which is selected across all groups, indicates a metabolite integral to a core metabolic pathway unaffected by diet or exercise interventions. The FA(20:4), significantly selected in the NFD-E group, underscores the metabolic impact of exercise in the context of a normal diet. It could represent a metabolite that is either up-regulated due to exercise-induced stress response or more readily mobilized and hence selected in this condition. FA(22:6) were significantly selected in the NFD and HFD-E groups, suggesting a potential link between DHA availability and metabolic adaptations to both a normal-fat diet and exercise. In the present study, CE(22:4) was selected as an important lipid for HFD group classification. This outcome is supported by Landgraf et al.,48 where the authors used zebrafish overfed with high-fat diet and normal-fat diet to evaluate the development of metabolically healthy and unhealthy obesity. The authors reported an increase in plasma triglyceride and cholesterol levels and ectopic liver lipid accumulation in HFD group.48
The positive ion mode data presents a compelling narrative where the selection of ions in the exercised groups (NFD-E and HFD-E) is notably sparse. This could imply an increased metabolic turnover or a shift toward different metabolic pathways due to exercise, resulting in less detection of these lipids. For example, the absence of DG(36:5;O2) in the NFD-E group, despite its selection in the NFD group, may point to exercise-induced metabolic modifications that warrant further investigation.
These findings demonstrate that dietary composition and exercise elicit distinct metabolic responses, as evidenced by the significant selection of certain ions in specific conditions. This selective ion profile provides a rich dataset for further interpretation and could lead to a deeper understanding of the metabolic consequences of diet and exercise regimens. Further studies are warranted to elucidate the roles of these selected ions in metabolic pathways and their potential implications for health and disease.
Overall, the significant ion selections in the volcano plot with OPSDA highlight the complex interplay between diet, exercise, and metabolism. These ions serve as potential biomarkers for physiological adaptations to lifestyle interventions and offer a window into the metabolic alterations that could underpin health benefits or disease risks associated with diet and exercise. Further metabolic pathway analysis and validation studies are necessary to elucidate the precise biochemical roles of these ions and their implications for nutritional science and metabolic health.
Lipid alterations associated with obesity
Literature reports that chronic obesity is essentially related to alterations in glycolipids, sphingolipids and phospholipids.49 However, the effects of these alterations are still unclear in many cases, and their complications have been discussed. Moreover, some studies demonstrate distinct alarming alterations that must be considered. Wang et al.50 demonstrates the capacity of a HFD to induce alterations in lipid metabolism, employing mice as model for HPLC-MS lipidomics assays. The enzymatic metabolism of polyunsaturated fatty acids facilitated by lipoxygenase and cytochrome P450 pathways, gives rise to lipid metabolites that confer various health benefits, including anti-inflammatory, anticancer, and analgesic activities. The investigation revealed that the HFD exerted an influence on fatty acid metabolism primarily through cytochrome P450 pathways. Fatty acid epoxides were the most reduced metabolites, as epoxyoctadecenoic acids and epoxydocosapentaenoic acids, and the reduction of lipid metabolites are intrinsically related to obesity cases.50 In another exploratory study conducted in 2022, researchers investigated alterations in lipid profiles during early childhood using plasma samples from mothers with obesity and their newborns.51 This study found an up-regulation between levels of deoxyceramide, diacylglycerol, and alkyl-diacylglycerol, as well as TG classes, with the increase of the body mass index. Conversely, ether-linked phospholipids and glycosphingolipids exhibited down-regulated with the increase of the body mass index.51
In the present study, chemometric methods highlighted that, regarding HPLC-MS in negative ion mode, HFD was influenced by the content of CE, once its presence was significant in the sedentary group that was submitted to this diet. On the other hand, HFD and HFD-E groups had a non-significant correlation with FA, in agreement with previous studies.50 It is notorious, evaluating the differences regarding the sedentary groups and the exercised groups, which the sedentary groups (NFD and HFD) demonstrated significant correlation to FA lipids, once these variables were able to distinct these groups (HFD vs. HFD-E and NFD vs. NFD-E). This finding underscores the importance of regular exercise, as previous studies have shown that fatty acid content is intrinsically linked to certain clinical conditions associated with obesity, such as the insulin resistance that leads to type 2 diabetes.52 Considering the annotated lipids, FA(16:0), which is associated positively with HFD groups, can correspond to palmitic acid, a fatty acid previously reported as an inducer of insulin resistance. In peripheral tissues, palmitic acid has been shown to interfere with insulin signaling pathways, leading to impaired glucose uptake and metabolic dysfunction.53 FA(18:1), a lipid positively associated with the sedentary group, can correspond to oleic acid. A recent study54 highlighted that this FA can be positively associated with coronary heart disease and may increase myocardial infarction risk.
Additionally, FA(22:6), corresponding to docosahexaenoic acid (DHA), was significantly selected in the NFD and HFD-E groups. DHA is an essential omega-3 polyunsaturated fatty acid associated with reduced inflammation, lipid homeostasis, and improved cognitive function. In the context of metabolic diseases and obesity, DHA may contribute to regulating lipid metabolism and controlling chronic inflammation, a risk factor for cardiovascular disease and insulin resistance.55,56 This reinforces the relevance of dietary composition and physical activity in modulating metabolic outcomes and highlights the potential benefits of DHA-rich diets combined with exercise in preventing obesity-related complications.55,56
Evaluating the positive ion mode obtained by HPLC MS analysis, it is evident that in sedentary groups, HFD diet presented non-significant correlation with LPE and DG lipids. Literature reports that the down-regulation of these classes of lipids intrinsically linked to obesity cases.57 It is possible to note that ceramides were positively associated with HFD groups. This correlation aligns with the literature, which suggests that excessive calorie intake leads to the accumulation of lipid metabolites, such as ceramides in peripheral tissues. Elevated ceramide levels are linked to cardiovascular diseases and serve as predictors for these conditions.58
Choi and Snider59 reported that HFD influences global sphingolipid metabolism by modulating de novo synthesis as well as the salvage pathway. The diet alterations change in ceramide levels highlight the role of nutrition in shaping sphingolipid metabolism, which subsequently impacts downstream signaling pathways, contributing to obesity-related disorders such as insulin resistance and ectopic lipid deposition.59 Recent studies have demonstrated that reducing ceramide levels can prevent obesity-related cardiometabolic disorders, as these lipids serve as inflammatory biomarkers that link pro-inflammatory agonists, such as TNFα, TLR4 agonists, and saturated fats, to cellular dysfunctions underlying these diseases.60
Phospholipids were found to be important lipids for zebrafish group classification in the present study. As reported by Lee et al.,61 a HFD significantly alters phospholipid content in organisms, specially when regards to lipid composition in brain. By decreasing phosphatidylserine levels in the cortex, hippocampus, and hypothalamus, while simultaneously increasing lysophosphatidylserine (LPS) levels, likely due to oxidative stress or enzymatic activity. Additionally, the HFD elevates other lysophospholipids, such as lysophosphatidylcholine (LPC), lysophosphatidylethanolamine (LPE), and lysophosphatidylglycerol (LPG) in the cortex. The hippocampus shows a similar trend, with increased phosphatidylethanolamine (PE), PE plasmalogen, LPC, and LPE. However, these alterations are less pronounced in the hypothalamus and olfactory bulb, indicating region-specific lipid remodeling. These changes suggest that an HFD disrupts membrane integrity, enhances oxidative stress, and potentially contributes to neuroinflammatory processes.61
Conclusions
Lipidomics study on zebrafish model was performed to investigate the effects of different diets and exercise conditions using HPLC-MS and chemometric methods. Comprehensive analyses of lipid extracts revealed a wide range of putatively annotated lipids, including lysophosphocholine, fatty acids, ceramides, phospho-ethanolamines, lysophosphatidic acid, sterols, and cholesteryl esters. These results shed light on variations induced by various lifestyle factors.
Despite initial challenges in separating groups by PCA analysis, the study employed PLS-DA with OPSDA for effective classification and variable selection. Although the success in group classification, the selected variables lacked specific interpretative insights, prompting the use of volcano plots to identify statistically significant changes. The results emphasized the complex role of these variables in class differentiation, highlighting the importance of sophisticated analysis methods.
It was possible to annotate the lipids responsible for the variations between the groups. This research contributes to a broader understanding of how lifestyle factors affect lipid metabolism, providing critical insights for the development of targeted interventions to reduce the global burden of obesity and its associated health complications. The study highlights the complexity of lipid metabolism changes in obesity-related habits and underscores the need for a multifaceted approach to fully understand and address these metabolic changes.
-
This publication is part of the special issue “Omics Sciences”
Supplementary Information
Supplementary material 1
Supplementary data (write here the spectral type, ex. NMR, XRD, FTIR spectra, etc.) are available free of charge at http://jbcs.sbq.org.br as PDF file.
Acknowledgments
This study was financed in part by CAPES (Finance Code 001) and CNPq (grant No. 307423/2022-0). The authors are also grateful to FAPEG for scholarship.
Data Availability Statement
All data generated or analyzed during this study are included in this article. Further inquiries can be directed to the corresponding author. The original data supporting this study are publicly available in the Mendeley Data repository under the DOI URL https://doi.org/10.17632/tbg67bsst4.1.
References
-
1 Powell-Wiley, T. M.; Poirier, P.; Burke, L. E.; Després, J.-P.; Gordon-Larsen, P.; Lavie, C. J.; Lear, S. A.; Ndumele, C. E.; Neeland, I. J.; Sanders, P.; St-Onge, M.-P.; Circulation 2021, 143, e984. [Crossref]
» Crossref -
2 Shang, A.; Gan, R.-Y.; Xu, X.-Y.; Mao, Q.-Q.; Zhang, P.-Z.; Li, H.-B.; Crit. Rev. Food Sci. Nutr. 2021, 61, 2061. [Crossref]
» Crossref -
3 World Obesity Federation. [Link], accessed in February 2026
» Link -
4 World Heath Organization. [Link] accessed in February 2026
» Link -
5 Nani, A.; Murtaza, B.; Sayed Khan, A.; Khan, N. A.; Hichami, A.; Molecules 2021, 26, 985. [Crossref]
» Crossref -
6 Sarma, S.; Sockalingam, S.; Dash, S.; Diabetes Obes. Metab. 2021, 23, 3. [Crossref]
» Crossref -
7 Hesketh, K. D.; Zheng, M.; Campbell, K. J.; Nat. Rev. Endocrinol. 2025, 21, 31. [Crossref]
» Crossref -
8 Wrzosek, M.; Zawadzka, Z.; Sawicka, A.; Bobrowska-Korczak, B.; Białek, A.; Obes. Surg. 2022, 32, 428. [Crossref]
» Crossref -
9 Handakas, E.; Lau, C. H.; Alfano, R.; Chatzi, V. L.; Plusquin, M.; Vineis, P.; Robinson, O.; Obes. Rev. 2022, 23, e13384. [Crossref]
» Crossref -
10 Qiu, S.; Cai, Y.; Yao, H.; Lin, C.; Xie, Y.; Tang, S.; Zhang, A.; Signal Transduct. Target Ther. 2023, 8, 132. [Crossref]
» Crossref -
11 Züllig, T.; Trötzmüller, M.; Köfeler, H. C.; Anal. Bioanal. Chem. 2020, 412, 2191. [Crossref]
» Crossref -
12 Han, X.; Gross, R. W.; J. Lipid Res. 2022, 63, 100164. [Crossref]
» Crossref -
13 Chhonker, Y. S.; Kanvinde, S.; Ahmad, R.; Singh, A. B.; Oupický, D.; Murry, D. J.; Metabolites 2021, 11, 106. [Crossref]
» Crossref -
14 Liu, P.; Liu, Z.; Zhou, H.; Zhu, J.; Sun, Z.; Zhang, G.; Liu, Y.; Mol. Omics 2024, 20, 618. [Crossref]
» Crossref -
15 Bhagat, J.; Zang, L.; Nishimura, N.; Shimada, Y.; Sci. Total Environ. 2020, 728, 138707. [Crossref]
» Crossref -
16 Choi, T.-Y.; Choi, T.-I.; Lee, Y.-R.; Choe, S.-K.; Kim, C.-H.; Exp. Mol. Med. 2021, 53, 310. [Crossref]
» Crossref -
17 Porto, V. A.; da Rocha Júnior, E. R.; Ursulino, J. S.; Porto, R. S.; da Silva, M.; de Jesus, L. W. O.; de Oliveira, J. M.; Crispim, A. C.; Santos, J. C. C.; de Aquino, T. M.; Sci. Total Environ. 2023, 868, 161737. [Crossref]
» Crossref -
18 Zhang, W.; Song, Y.; Chai, T.; Liao, G.; Zhang, L.; Jia, Q.; Qian, Y.; Qiu, J.; Sci. Total Environ. 2020, 713, 136565. [Crossref]
» Crossref -
19 Smolińska, K.; Hułas-Stasiak, M.; Dobrowolska, K.; Sobczyński, J.; Szopa, A.; Tomaszewska, E.; Muszyński, S.; Smoliński, K.; Dobrowolski, P.; Int. J. Mol. Sci. 2024, 25, 12723. [Crossref]
» Crossref -
20 Hu, C.; Duan, Q.; Han, X.; Proteomics 2020, 20, 1900070. [Crossref]
» Crossref -
21 Fu, X.; Hafza, N.; Götz, F.; Lämmerhofer, M.; J. Chromatogr. A 2023, 1703, 464111. [Crossref]
» Crossref -
22 Rakusanova, S.; Cajka, T.; TrAC, Trends Anal. Chem. 2024, 180, 117940. [Crossref]
» Crossref -
23 Harrieder, E.-M.; Kretschmer, F.; Böcker, S.; Witting, M.; J. Chromatogr. B 2022, 1188, 123069. [Crossref]
» Crossref -
24 Zhang, Z.; Singh, M.; Kindt, A.; Wegrzyn, A. B.; Pearson, M. J.; Ali, A.; Harms, A. C.; Baker, P.; Hankemeier, T.; J. Chromatogr. A 2023, 1708, 464342. [Crossref]
» Crossref -
25 Ministério da Ciência, Tecnologia e Inovações; Resolução Normativa CONCEA No. 51, de 19.05.2021, Dispõe sobre a Instalação e o Funcionamento das Comissões de Ética no Uso de Animais - CEUAs e dos Biotérios ou Instalações Animais; Diário Oficial da União (DOU), Brasília, 24/05/2021. [Link] accessed in February 2026
» Link -
26 Lawrence, C.; Aquaculture 2007, 269, 1. [Crossref]
» Crossref -
27 Martins, M. S. A.; Carneiro, W. F.; Monteiro, K. S.; de Souza, S. P.; Vianna, A. R. C. B.; Murgas, L. D. S.; J. Comp. Physiol. B 2024, 194, 793. [Crossref]
» Crossref - 28 Horwitz, W.; Latimer, G. W.; Official Methods of Analysis of AOAC International, 18th ed.; AOAC International Gaithersburg, Md.: Gaithersburg, Md., 2005.
-
29 Palstra, A. P.; Tudorache, C.; Rovira, M.; Brittijn, S. A.; Burgerhout, E.; van den Thillart, G. E. E. J. M.; Spaink, H. P.; Planas, J. V.; PLoS One 2010, 5, e14483. [Crossref]
» Crossref -
30 Ross, L. G.; Ross, B.; Anaesthetic and Sedative Techniques for Aquatic Animals; Wiley Online Library, 2008. [Link] accessed in February 2026
» Link -
31 Bligh, E. G.; Dyer, W. J.; Can. J. Biochem. Physiol. 1959, 37, 911. [Crossref]
» Crossref -
32 Oyeniyi, E. A.; Sorgi, C. A.; Gardinassi, L. G.; Azevedo, L. F.; Adeyemi, J. A.; Omotoso, O. T.; Faccioli, L. H.; Antunes, L. M. G; Barbosa, F.; Food Chem. Toxicol. 2022, 165, 113189. [Crossref]
» Crossref -
33 Reichl, B.; Eichelberg, N.; Freytag, M.; Gojo, J.; Peyrl, A.; Buchberger, W.; J. Chromatogr. B 2020, 1153, 122271. [Crossref]
» Crossref -
34 Bernardo, R. A.; Roque, J. V.; de Oliveira Júnior, C. I.; Lima, N. M.; Machado, L. S.; Duarte, G. R. M.; Costa, N. L.; Sorgi, C. A.; Soares, F. F. L.; Vaz, B. G.; Chaves, A. R.; Talanta 2024, 269, 125522. [Crossref]
» Crossref -
35 Bernardo, R. A.; de Oliveira Júnior, C. I.; Roque, J. V.; Costa, N. L.; Roriz, V. M.; Sorgi, C. A.; Janfelt, C.; Vaz, B. G.; Chaves, A. R.; J. Proteome Res. 2024, 23, 2750. [Crossref]
» Crossref -
36 Kauhanen, D.; Sysi-Aho, M.; Koistinen, K. M.; Laaksonen, R.; Sinisalo, J.; Ekroos, K.; Anal. Bioanal. Chem. 2016, 408, 3475. [Crossref]
» Crossref -
37 Bro, R.; Smilde, A. K.; Anal. Methods 2014, 6, 2812. [Crossref]
» Crossref -
38 Lee, L. C.; Liong, C.-Y.; Jemain, A. A.; Analyst 2018, 143, 3526. [Crossref]
» Crossref -
39 Barker, M.; Rayens, W.; J. Chemom 2003, 17, 166. [Crossref]
» Crossref -
40 Pérez, N. F.; Ferré, J.; Boqué, R.; Chemom. Intell. Lab. Syst. 2009, 95, 122. [Crossref]
» Crossref -
41 Roque, J. V.; Cardoso, W.; Peternelli, L. A.; Teófilo, R. F.; Anal. Chim. Acta 2019, 1075, 57. [Crossref]
» Crossref -
42 Wartha, C. A.; Porto, N. A.; Tomaz, A. C.; Roque, J. V.; Teixeira Diniz, M. B. T.; de Queiroz, M. E. L. R.; Teófilo, R. F.; Barbosa, M. H. P.; Phytochem. 2022, 199, 113175. [Crossref]
» Crossref -
43 Fahy, E.; Sud, M.; Cotter, D.; Subramaniam, S.; Nucleic Acids Res. 2007, 35, W606. [Crossref]
» Crossref -
44 Harrieder, E.-M.; Kretschmer, F.; Böcker, S.; Witting, M.; J. Chromatogr. B 2022, 1188, 123069. [Crossref]
» Crossref -
45 Cajka, T.; Hricko, J.; Kulhava, L. R.; Paucova, M.; Novakova, M.; Kuda, O.; Int. J. Mol. Sci. 2023, 24, 1987. [Crossref]
» Crossref -
46 dos Santos, A. C. A.; Vuckovic, D.; TrAC, Trends Anal. Chem. 2024, 170, 117419. [Crossref]
» Crossref -
47 Asri, M. N. M.; Verma, R.; Mahat, N. A.; Nor, N. A. M.; Mat Desa, W. N. S.; Ismail, D.; Chemom. Intell. Lab. Syst. 2022, 225, 104557. [Crossref]
» Crossref -
48 Landgraf, K.; Schuster, S.; Meusel, A.; Garten, A.; Riemer, T.; Schleinitz, D.; Kiess, W.; Körner, A.; BMC Physiol. 2017, 17, 4. [Crossref]
» Crossref -
49 Heilbronn, L. K.; Coster, A. C. F.; Campbell, L. V.; Greenfield, J. R.; Lange, K.; Christopher, M. J.; Meikle, P. J.; Samocha Bonet, D.; Obesity 2013, 21, 2421. [Crossref]
» Crossref -
50 Wang, W.; Yang, J.; Qi, W.; Yang, H.; Wang, C.; Tan, B.; Hammock, B. D.; Park, Y.; Kim, D.; Zhang, G.; Obesity 2017, 25, 132. [Crossref]
» Crossref -
51 Mir, S. A.; Chen, L.; Burugupalli, S.; Burla, B.; Ji, S.; Smith, A. A. T.; Narasimhan, K.; Ramasamy, A.; Tan, K. M.-L.; Huynh, K.; Giles, C.; Mei, D.; Wong, G.; Yap, F.; Tan, K. H.; Collier, F.; Saffery, R.; Vuillermin, P.; Bendt, A. K.; Burgner, D.; Ponsonby, A.-L.; Lee, Y. S.; Chong, Y. S.; Gluckman, P. D.; Eriksson, J. G.; Meikle, P. J.; Wenk, M. R.; Karnani, N.; BMC Med. 2022, 20, 242. [Crossref]
» Crossref -
52 Arner, P.; Rydén, M.; Obes. Facts 2015, 8, 147. [Crossref]
» Crossref -
53 Sánchez-Alegría, K.; Bastián-Eugenio, C. E.; Vaca, L.; Arias, C.; FASEB J. 2021, 35, e21712. [Crossref]
» Crossref -
54 Wang, G.; Zhou, L.; Wang, Z.; Ali, A.; Wu, L.; Ir. J. Med. Sci. (1971 -) 2024, 194, 59. [Crossref]
» Crossref -
55 Richard, C.; Monk, J. M.; Adv. Nutr. 2024, 15, 100161. [Crossref]
» Crossref -
56 Takic, M.; Pokimica, B.; Petrovic-Oggiano, G.; Popovic, T.; Molecules 2022, 27, 4471. [Crossref]
» Crossref -
57 Auguet, T.; Bertran, L.; Capellades, J.; Abelló, S.; Aguilar, C.; Sabench, F.; del Castillo, D.; Correig, X.; Yanes, O.; Richart, C.; Int. J. Mol. Sci. 2023, 24, 7761. [Crossref]
» Crossref -
58 Delcheva, G.; Stefanova, K.; Stankova, T.; Diseases 2024, 12, 195. [Crossref]
» Crossref -
59 Choi, S.; Snider, A. J.; Mediators Inflammation 2015, 2015, 520618. [Crossref]
» Crossref -
60 Varre, J. V.; Holland, W. L.; Summers, S. A.; Biochim. Biophys. Acta, Mol. Cell. Biol. Lipids 2022, 1867, 159125. [Crossref]
» Crossref -
61 Lee, J. C.; Park, S. M.; Kim, I. Y.; Sung, H.; Seong, J. K.; Moon, M. H.; Biochim. Biophys. Acta, Mol. Cell. Biol. Lipids 2018, 1863, 980. [Crossref]
» Crossref
Edited by
-
Editor handled this article:
Alessandra Sussulini (Guest) and Hector Henrique F. Koolen (Associate)