Study of Organic Acids Profile in Human Urine by Capillary Zone Electrophoresis Aiming at the Diagnosis of COVID-19
Abstract
The coronavirus disease (COVID-19) pandemic highlighted the need for alternative diagnostic strategies based on accessible and non-invasive technologies. This proof-of-concept study evaluates capillary zone electrophoresis with ultraviolet detection as a data-acquisition platform for exploratory profiling of four urinary organic acids (tartrate, malate, lactate, and succinate) in samples collected from individuals tested by reverse transcription polymerase chain reaction (RT-PCR) for severe acute respiratory syndrome coronavirus 2 (SARS-CoV-2). Electropherogram data were processed using multiple machine learning algorithms to classify COVID-19-positive and -negative samples. The models included partial least squares discriminant analysis (PLS-DA), soft independent modeling of class analogy (SIMCA), decision tree, random forest, bagged trees, and stochastic gradient descent. Overall performance was moderate: PLS-DA showed limited discrimination, SIMCA achieved high sensitivity but low specificity, and tree-based models demonstrated balanced yet modest accuracy. The best results were obtained with the stochastic gradient descent classifier, reaching 70% accuracy and a Matthews correlation coefficient of 0.41. These findings indicate that urinary organic acid profiles provide only weak discriminatory power for COVID-19 classification. Nonetheless, the workflow demonstrates the feasibility of integrating capillary electrophoresis with machine learning modeling for exploratory, non-invasive metabolomics-based screening.
Keywords:
urine; capillary zone electrophoresis; target metabolomics; machine learning classification; COVID-19
Introduction
Since the outbreak of coronavirus disease (COVID-19), multidisciplinary collaborations among scientists from various fields have contributed to the development of vaccines, therapeutics, contingency strategies, and the improvement of diagnostic and prognostic protocols. Innovative methods for auxiliary diagnostic alternatives that are non-invasive, rapid, and cost-effective are constantly being pursued.1-3 Metabolomics investigations,4-6 as well as machine learning (ML) and deep learning approaches,7,8 either independently or combined, stand out in efforts to enhance current severe acute respiratory syndrome coronavirus 2 (SARS-CoV-2) testing strategies.
The diagnostic test for COVID-19 currently relies on the detection of SARS-CoV-2 ribonucleic acid (RNA) by reverse transcription polymerase chain reaction (RT-PCR).9,10 Briefly, the RT-PCR test involves extracting viral RNA from a nasopharyngeal sample, reverse transcribing it into complementary deoxyribonucleic acid (DNA), and then amplifying it to generate quantitative or qualitative information about the viral load. Although considered the gold-standard confirmatory test,11 there is some disagreement of the medical community regarding whether the detected viral load truly corresponds to a positive or negative diagnosis, as discussed by Rabaan et al.12 Additionally, some authors13,14 report limitations associated with RT-PCR, including the requirement for skilled personnel, biosafety level 2 facilities and high operational costs, that results in a costly exam for the patient.
Antigen tests, commonly known as rapid tests, provide results within 15-30 min at a reduced cost, including the self-tests now available in pharmacies. These tests are performed through lateral-flow assays, in which the nasopharyngeal sample is treated with a solution that disrupts the virus and releases its antigens. After placing the solution over a paper-based device, the antigens migrate and react with the specific SARS-CoV-2 antibodies, yielding a qualitative result. According to the Centers for Disease Control and Prevention,11 positive antigen test results are highly reliable. However, compared to nucleic acid-based test such as RT-PCR, antigen tests are less sensitive to detect viral particulates and may be affected by improper self-collection, therefore, the single negative result by this king of test does not rule out infection.15-17
Serological tests based on enzyme-linked immunosorbent assay (ELISA) or loop-mediated isothermal amplification also represent diagnostic options in clinical portfolios. Some other experimental alternatives are thoroughly discussed in recent reviews,9,18-22 and they include the manufacture of sensors, biosensors, spectrometric-based probes, nanomaterials and more. All diagnostic strategies present advantages and limitations, mostly related to the balance between test cost and reliability. Authors in the medical field argue that no single laboratory test is entirely conclusive and should be complemented, when necessary, with radiological examinations.23,24 It is also worth mentioning that any test is influenced by multiple factors,25 in the case of COVID-19, widely reported in the media, sample collection timing is a particularly critical factor affecting test reliability.
Considering these factors, screening tests become valuable tools for large-scale triage, especially in the context of highly contagious diseases that place substantial demand on laboratory infrastructure. Moreover, nasopharyngeal sampling can be uncomfortable, may expose healthcare personnel to infection risks, and can be difficult for some individuals to tolerate. Therefore, diagnostic alternatives that further reduce costs and expand accessibility for the general population represent a significant benefit.
In this context, the present study introduces an unprecedented approach. Using capillary electrophoresis (CE) with ultraviolet (UV) detection as the main instrumentation, we performed an exploratory profiling of organic acids (OAs) in human urine and applied ML classifiers to build predictive models. Capillary zone electrophoresis (CZE) is a versatile and high-efficiency separation technique, and when coupled with UV detection, it offers a simple, robust, and cost-effective analytical platform. This combination is particularly suitable for exploratory biochemical-driven studies, where method accessibility, reproducibility, and low operational cost are essential.26
ML encompasses a broad set of computational techniques capable of learning patterns from data and generating predictive models without being explicitly programmed for each task.27-30 These algorithms, ranging from classical methods such as support vector machines and random forests to more advanced techniques like gradient boosting and deep learning, have gained prominence in metabolomics due to their ability to process high-dimensional and complex datasets. Within metabolomics workflows, ML is widely applied to classification, regression, clustering, feature selection, biomarker discovery, and data integration. In disease-related metabolomics, ML supports the identification of metabolic signatures that discriminate between healthy and diseased states and supports the prediction of clinical outcomes based on multi-metabolite profiles.31-37
OAs are key metabolites and represent intermediates or final products of numerous metabolic pathways, making them promising as biomarkers for human diseases and physiological imbalances. Consequently, OAs are frequently reported to be associated with metabolic dysfunctions in metabolomics studies, including both targeted and untargeted approaches. Given their low molecular weight and high solubility in water, urine is a suitable biological matrix for OA investigations, as these compounds are excreted in diverse and detectable concentrations. Saliva could have been an obvious choice for non-invasive assays; however, apart from being less rich in potential metabolites, the viable SARS-CoV-2 viral load in saliva samples has been found to be comparable to that of nasopharyngeal sputum and higher than in urine, with detectable RNA lasting for up to eight weeks post-infection.38,39 In this context, urine is an easily collected fluid that presents itself as a less biologically hazardous and non-invasive material for diagnostic assays.26,39-43
Few studies have reported44-48 the use of urine samples for SARS-CoV-2 identification and most rely on conventional diagnostic methodologies, either involving labeled biochemical reactions or the direct detection of viral nucleic acid fragments. Considering that OA metabolites are easily ionizable and therefore suitable for electromigration analysis, we adapted a previously developed CZE method combined with indirect UV detection (CZE-UV). This approach enables the analysis of low-molecular-weight hydroxy dicarboxylic OAs as a low-cost, rapid, automated, and effective strategy to obtain urinary OA profiles.
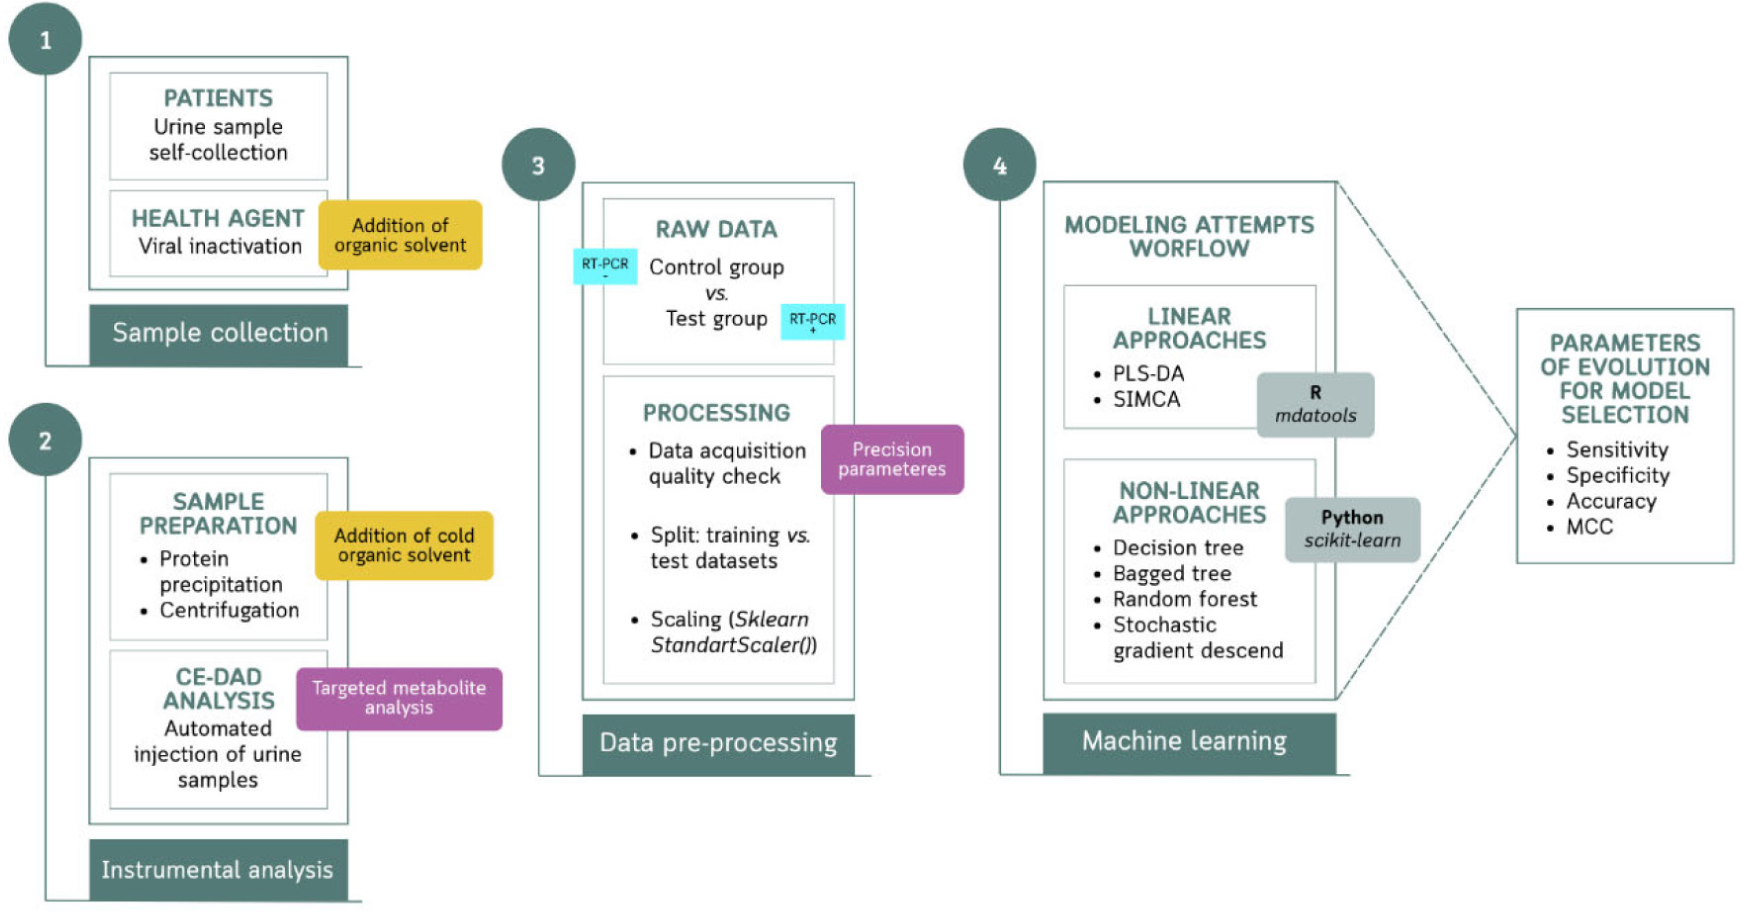
The aim of this work was to evaluate and discuss the best classificatory output among a few ML approaches, considering both linear and non-linear, for processing data acquired from screening samples collected non-invasively through a fast and simple analytical instrumentation. A schematic overview of the entire workflow, from sample collection to data modelling, is shown in Figure 1. Overall, this study introduces CZE-UV combined with ML into the metabolomics scenario as a promising and accessible analytical approach. This strategy may support exploratory metabolomics and metabolite profiling investigations and, in the long term, be extended to other related studies.
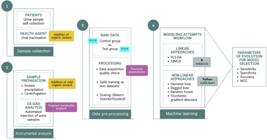
Schematic step-by-step overview of the entire study, from human urine sample collection to final data modeling.
Experimental
Materials and reagents
All solutions used in this work were diluted in water deionized by Reverse Osmosis System (Quimis, São Paulo, Brazil). Sodium hydroxide (NaOH) was purchased from Synth (São Paulo, Brazil), tris(hydroxymethyl)aminomethane (TRIS) and cetyltrimethylammonium bromide (CTAB) from Sigma-Aldrich (Saint Louis, USA), and phthalic acid from Vetec (Rio de Janeiro, Brazil). The OA analytical standards, those being, tartaric, malic, succinic, and lactic acids were all purchased from Sigma-Aldrich (Saint Louis, USA). The background electrolyte (BGE) was prepared from aqueous stock solutions of each one of the components diluted in freshly deionized water. The final solution was filtered and stored in an amber flask at 4 °C until analysis. Aqueous stock solutions of each standard (50 mmol L-1) were also stored at 4 °C and diluted in water at the needed concentration before analysis.
Sample details
Human urine samples were collected under the authorization from the Ethics Committee of the University Hospital of the Federal University of Juiz de Fora (acceptance codes: 4.473.404; 4.566.092; 5.039.371). The volunteer population consisted of adults who underwent nasopharyngeal RT-PCR tests for SARS-CoV-2 detection and formally agreed to participate in this research by filling up and signing the Free and Informed Consent Form and the anamnesis questionnaire. The samples were collected individually and daily between July and November 2021. Volunteer recruitment and all the steps involving sample collection and triage took place at the Lemos Laboratórios de Análises Clínicas, Brazil.
During this period, the COVID-19 pandemic was reaching its second-wave stage as a reaction of the delta variant.13 In Brazil, the gamma variant, identified firstly in Manaus in November 2020, was also contributing to the number of confirmed cases mostly at the beginning of the sample collection period,49 which eventually decreased until November 2021. Over this entire period, the vaccination program has already started worldwide, in Brazil, from July to November, approximately 208 million doses were administered.50,51
SARS-CoV-2 virus detection tests were carried out by RT-PCR using the TaqPath™ COVID-19 CE-IVD RT-PCR kit52 from Thermo Fisher Scientific (Palo Alto, CA, USA) capable of detecting a minimum of 10 genomic copies within nasopharyngeal swab samples. The results were processed using the Applied BiosystemsTM COVID-19 Interpretive Software v1.2 (Thermo Fisher Scientific, Palo Alto, CA, 2020).
A total of 100 samples (38 positives and 62 negatives for SARS-CoV-2 according to the RT-PCR test) were randomly selected and analyzed in three authentic replicas following a double-blind protocol. The donors were men and women aged between 21 and 77 years, with or without symptoms and comorbidities according to self-reported information. Among the 58 volunteers who reported symptoms, 30 tested positive for SARS-CoV-2 by RT-PCR, while 28 tested negative. The most frequently reported symptoms, in descending order were cough, runny nose, pain, headache, fever, lost sense of smell, diarrhea/nausea, sore throat, and chest pain. Regarding the comorbidities, 15 individuals declared having hypertension, diabetes, or respiratory diseases. Complete details are summarized in Table S1, presented in the Supplementary Information (SI) section. Despite the heterogeneity of the volunteer group, no restriction, regarding symptoms and health profile of the participants, was applied to data analysis procedures to simulate real-world conditions and generate unbiased results. Samples with negative RT-PCR results were assigned as the control group, while samples with positive results were classified as the test group. The RT-PCR tests results were accessed only after the analytical phase.
Sample preparation
Urine samples were self-collected by volunteers in 50 mL centrifuges tubes at random times of day, with no prior preparation required from the patient. No restrictions were imposed regarding the collection period also. After collection, the sealed tubes were submitted to a triage process, where 10% (v/v) of an acetone / methanol solution (6:4, v/v) was immediately added to the samples as a protocol for inactivation of any viral particulates and as metabolic quenching.53 The samples were then individually coded, refrigerated and transported to our facility (Laboratory of the Analytical Chemistry and Chemometrics Group at the Federal University of Juiz de Fora, Brazil), where they were all stored in an ultrafreezer at –50 °C. Throughout transportation, storage temperature was monitored to ensure samples remained properly refrigerated.
Before analysis, the selected samples were thawed at room temperature (22 °C) for approximately ٢٠ min, after which 10% (v/v) of ice-cold acetonitrile at 2 mL aliquots for complete the protein precipitation procedure. The samples were then vortex-mixed for 10 s and centrifuged at 7500 rpm for 10 min. The resulting supernatant was transferred directly to the analytical vial. This entire procedure was performed authentically for each of the three aliquots taken from each one of the 100 selected samples. The samples were kept under conventional refrigeration (4° C) until the moment of analysis by CZE-UV. A quality control (QC) sample was prepared by pooling 20 µL of the 100 urine samples, also considering the preparation of three authentic replicas. The QC sample was used throughout the entire analytical method optimization process.
Instrumentation
The experiments were conducted in a 7100 CE system from Agilent Technologies (Palo Alto, USA) equipped with a diode array detector (DAD) set at 240 nm and a thermostat compartment maintained at 25 °C. Instrument control and data acquisition were performed using Agilent OpenLab ChemStation rev C.01.07 software. Samples and solutions were injected into the system hydrodynamically by applying 25 mbar for 2 s. The electrophoretic system was operated under negative polarity at –10 kV, generating a current of 5 µA average.
Experimental conditions
A TSP series polyimide-coated fused-silica capillary (Polymicro Technologies, Phoenix, USA) with a total length of 68.5 cm (60 cm effective length) and an internal diameter of 75 µm was used. A solution containing 10 mmol L-1 of TRIS, 11 mmol L-1 of phthalic acid, and 0.5 mmol L-1 of CTAB (pH 3.9) was used as BGE. The capillary was initially conditioned by flushing 1 mol L-1 of NaOH (40 min), followed by deionized water (20 min), and BGE (20 min) at 950 mbar. Between analyses, the capillary was reconditioned with 950 mbar flushes of 1 mol L-1 NaOH (60 s), deionized water (30 s), 1 mol L-1 HCl (30 s), a second flush of deionized water (30 s), and BGE (120 s).
Data collection and analysis
The analyses were organized in a randomized sequence and distributed across three analytical batches, each consisting of 100 urine samples prepared in authentic triplicates. Each batch included: (i) 100 urine samples; (ii) external calibration curves of the four analytes (tartaric, malic, succinic, and lactic acids) at five levels of concentration arranged in a randomized order; (iii) a pooled sample composed of aliquots from the 100 samples in the batch, used as QC; and (iv) deionized water used as blank. The entire batch took about 80 h of analysis, after every 20-h interval, a complete capillary reconditioning procedure was performed, followed by two blank injections, a full calibration curve, 25 samples injections and seven QC injections (placed at the beginning and the end of the sequence, and in between every six sample injections). Between batches, removable electrodes and pre-punchers were cleaned with isopropanol in an ultrasonic bath for 15 min to avoid accumulation of salts or other unwanted residues. The pieces were reattached to the system and the electrodes were realigned. The entire process, considering the 300-sample analysis (100 samples separated in three authentic replicas) and the complementary runs, took approximately ten days.
External standardization curves were constructed using the ordinary least squares method. QC electropherograms were evaluated to assess reproducibility, repeatability, and precision, as these samples were analyzed in an interspersed manner throughout the analytical sequence. Results are reported as mean values of all replicates, along with their corresponding standard deviations.
Software and programs
Data processing and chemometric modeling were conducted in R software (version 4.5.1, R Core Team, Austria, 2025), using the Positron IDE (version 2025.10.1, Posit, PBC, USA). For exploratory and supervised classification analyses, soft independent modeling of class analogy (SIMCA) and partial least squares discriminant analysis (PLS-DA) models were developed with the mdatools package in R software (version 0.14.2). Additional statistical analyses and data visualization were also performed in R software. ML modeling was carried out in Python (version 3.12.4, Conda base environment), developed by Python Software Foundation (Wilmington, USA), using the Scikit-learn library (version 1.4.2).
Data acquisition and structure
The dataset consisted of 100 urine samples collected from individual donors, including 62 SARS-CoV-2-negative and 38 SARS-CoV-2-positive cases, as determined by RT-PCR. No replicates were included; therefore, each row in the dataset corresponds a unique subject. For each sample, four analytical variables were extracted from CE electropherograms. These variables represent the integrated peak areas of four signals tentatively attributed to OAs and designated OA1 to OA4 according to their migration times. Peak integration was performed using Agilent ChemStation 3D-CE/MSD software (version B.04.03). The resulting dataset is organized as a matrix with 100 rows (samples) and 4 columns (variables), with no missing values identified.
Prior to chemometric and ML analyses, the dataset was mean-centered and scaled to unit variance (standardized) using the StandardScaler function to ensure equal weighting of all variables and to minimize the influence of scale disparities among features. Baseline correction, normalization, smoothing, and alignment procedures were deemed unnecessary due to the limited number of variables and the use of integrated peak areas rather than full electropherograms profiles. No outliers were identified during exploratory analysis.
Modeling and validation strategy
The complete dataset was randomly partitioned into training (80%) and test (20%) subsets using stratified sampling to maintain the original class distribution (62% negative and 38% positive cases). The training subset was used for model optimization and validation through 10-fold cross-validation. No resampling or synthetic data generation was applied, as class imbalance was moderate and well preserved during stratified splitting.
Results and Discussion
CZE-UV method specifics
The CZE-UV method was adapted from the protocol originally developed by de Oliveira et al.54 for phytochemical analysis. Since urine was the primary matrix of interest in this study, altering analytical outcomes due to interferents, signal intensity, and other parameters, additional optimization steps were required. The method relies on the indirect detection of predominantly dicarboxylic OAs, as well as certain monocarboxylic or polyhydroxylated compounds such as lactic acid. Detection is enabled by the use of phthalic acid, a chromophore agent that migrates near the possible analytes.
As previously discussed, urine is a complex biological matrix rich in both organic and inorganic metabolites and is therefore unlikely to allow complete baseline separation of all constituents under the selected analytical conditions, particularly when using CZE-UV with indirect detection. Consequently, full electropherogram resolution was not the analytical goal, instead, the objective was to obtain reproductible electrophoretic profiles representing urinary OA patterns.
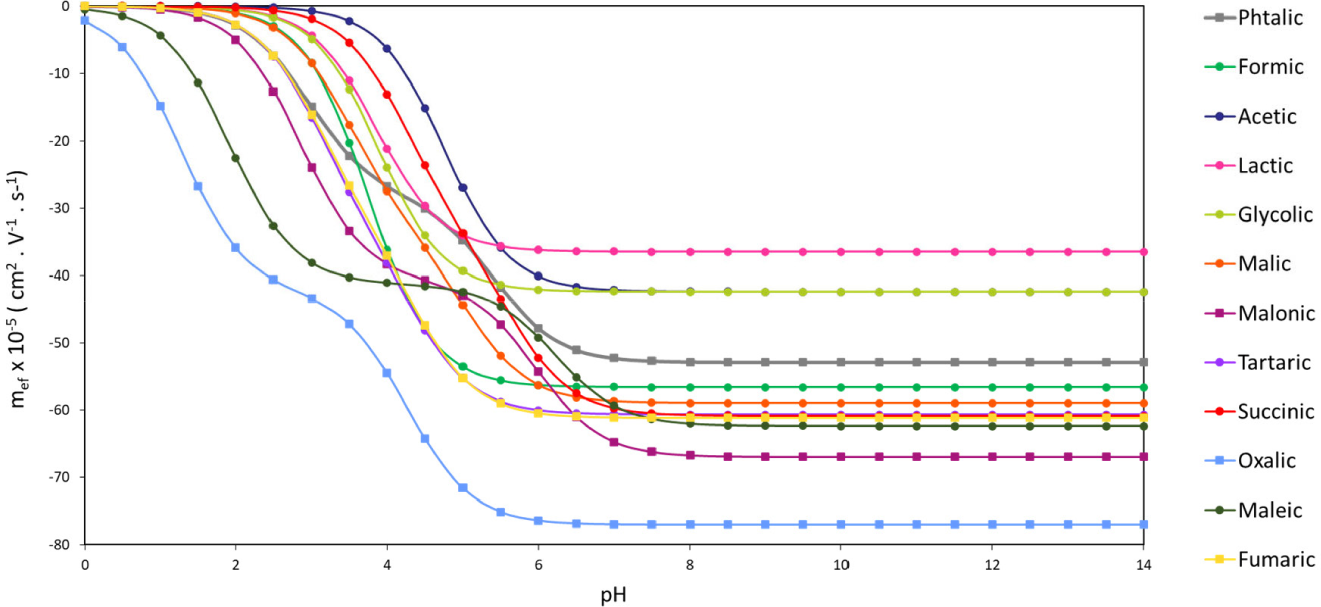
Method optimization was carried out through a combination of empirical experiments and computer-assisted simulations using PeakMaster® (version 5.4, Charles University group, Praga), a software specifically designed to model electromigration behavior and predict separation performance. Following preliminary evaluations, an acid solution with pH 3.9 was selected. At lower pH values, analyte mobility decreased markedly (Figure 2), whereas at pH values above 4.0, an increase in baseline noise and signal instability were observed in the electropherograms. Thus, pH 3.9 represented the best compromise between resolution, sensitivity, and baseline quality.
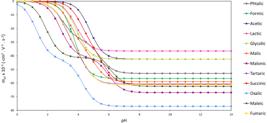
Graphic of effective mobility vs. pH curve of some organic acids potentially presented in human urinary profile. Phthalic acid (chromophore agent) in gray thicker line. Values of ionization constants and electrophoretic mobility used for this plot were acquired in the database of PeakMaster®.
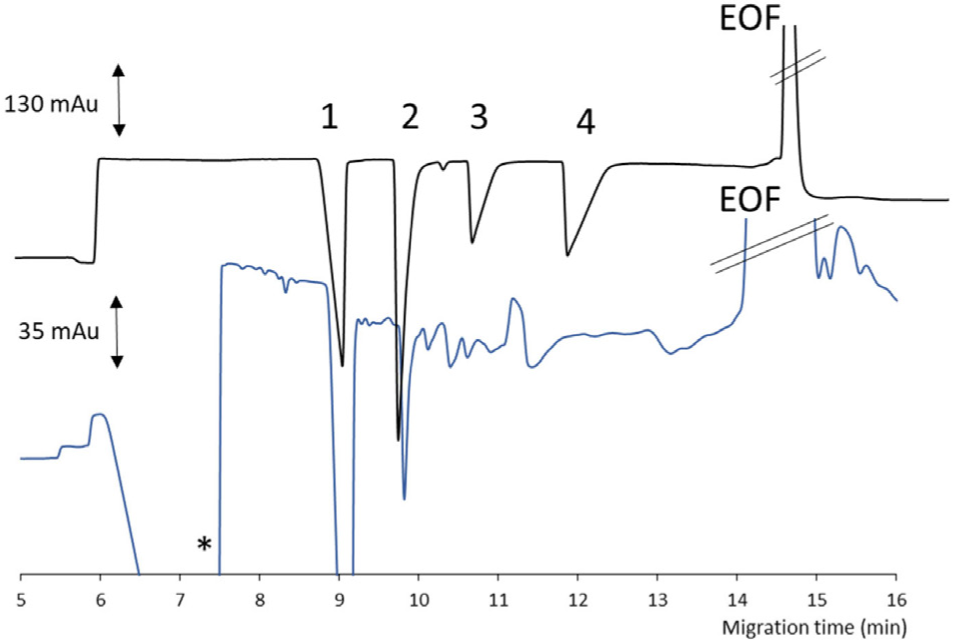
Given that the analytes are in their anionic form, the separation was carried out under negative polarity with reverse electroosmotic flow (EOF). Under these conditions, combined with indirect UV detection and pH-controlled selectivity, the method is limited to detecting species that: (i) are negatively charged at pH 3.9, (ii) exhibit electrophoretic mobilities within the range shown in Figure 2, and (iii) lack intrinsic chromophoric groups. Consequently, the OAs listed in Figure 2 represent the most likely metabolites contributing to the detected signals. Some fast-migrating inorganic anions, such as chloride, may also be detected. Further attempts to identified individual signals were not pursued, as the primary goal of the experiment was to obtain comprehensive profiling rather than targeted identification. It is important to note that, during the optimization process, both standard mixtures and pooled urine QC samples were used to evaluate method performance (Figure 3).
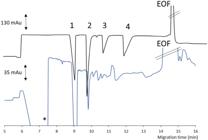
Electropherogram of a standard mixture (black line) and the urine QC (blue line). Peaks identification: (1) tartrate; (2) malate; (3) lactate; (4) succinate; *chloride and other unidentified fast anions. Electrolyte: 10 mmol L-1 TRIS, 11 mmol L-1 phthalic acid, and 0.5 mmol L-1 CTAB (pH 3.9). Other experimental conditions: hydrodynamic injection (25 mbar for 2 s); cartridge temperature: 25 °C; voltage: –10 kV; detection: 240 nm; and a TSP capillary 68.5 cm (60 cm effective length), and 75 μm internal diameter.
Additional experimental parameters, including capillary length, applied voltage, and injection conditions, were also optimized. The protocol for capillary conditioning between runs was a key factor for enhancing method reproducibility. Due to the high concentration of charged species in urine, adsorption of analytes onto the inner walls of the fused-silica capillary can occur. To minimize this effect, a conditioning sequence consisting of NaOH, deionized water, HCl, and finally a 2-min flush with BGE was performed between runs. This protocol ensured a consistent surface charge and effective removal of adsorbed residues, thereby improving method repeatability.
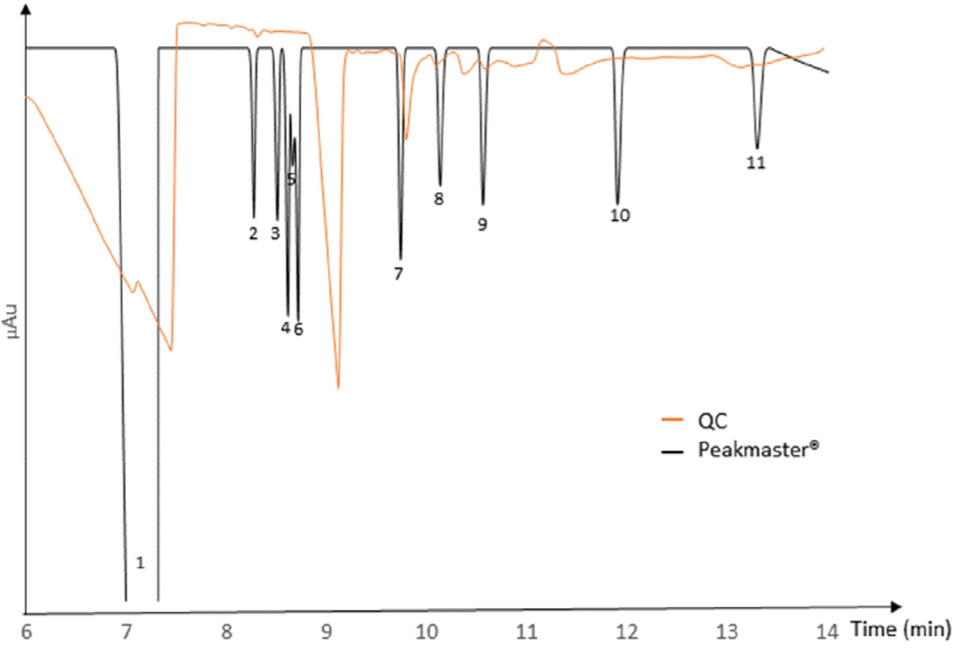
Potential analytes were simulated under the same experimental conditions using PeakMaster®, enabling a semi-qualitative comparison between theoretical and experimental electropherograms (Figure 4), particularly for the QC sample. This approach is especially valuable for CZE-UV with indirect detection, where peak identification is limited because individual UV spectra cannot be obtained. The simulations were also useful for evaluating the selectivity of the method toward OAs under the conditions employed.55
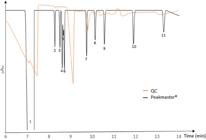
Simulated electropherogram in PeakMaster® software using experimental conditions. Peak identification: (1) chloride and unidentified fast anions; (2) maleic acid; (3) malonic acid; (4) tartaric acid; (5) formic acid; (6) fumaric acid; (7) malic acid; (8) glycolic acid; (9) lactic acid; (10) succinic acid; and (11) acetic acid.
It is important to note that comparing peak area between experimental and simulated data is not appropriate, as PeakMaster® does not simulate accurate concentrations. Additionally, due to the low analyte concentrations in urine, some peaks are not clearly distinguishable and may be confused with baseline noise; therefore, these peaks were excluded from interpretation.
In the QC electropherogram, three major peaks were consistently observed at approximately 7, 9, and 10 min. Comparison with simulated data suggests that the first peak corresponds to fast-migrating inorganic anions, such as chloride, showing strong agreement in migration time. The second peak appears in a region where no isolated simulated peak is expected; however, partial overlap between simulated peaks 3 and 6 suggests that co-migration of analytes may account for this unresolved signal. Due to limited resolution and matrix effects, definitive identification was not possible. The third peak aligns with the simulated migration time of malic acid, supporting its tentative assignment.
To enable accurate compound identification, further optimization of the separation conditions would be required to improve resolution, or complementary detectors such as mass spectrometry should be employed. Therefore, for subsequent data processing and chemometric analysis, electrophoretic peaks were assigned sequential labels (OA1, OA2, OA3, and OA4), without direct attribution to specific metabolites.
Quality evaluation of the raw CZE dataset
A total of 300 electropherograms were acquired using the optimized CZE-UV protocol. The method generated reproducible and chemically distinct electrophoretic profiles, consistent with the analytical parameters established during optimization. For data processing, only the migration window corresponding to the OAs of interest was extracted and used as input for further analysis. The initial region of the electropherogram, where chloride and other fast-migrating inorganic anions appear at high intensity in all samples, was excluded. Because these species were abundant and consistent across samples, their inclusion could bias the classification model. Therefore, only the OA portion of each electropherogram was retained for subsequent ML modeling.
Analytical performance parameters were evaluated to verify any variations in the results and ensure the quality of the acquired data, given that differences in the OA profile between each result should originated solely from the biological samples themselves, and not by any contamination or other interference. External standardization curves were built using the data acquired from electropherograms of standard analytes of known concentration injected between sample runs. The models were fitted for each batch, and none of them presented lack of fit within a 95% confidence interval, showing a statistically acceptable linear correlation, as suggested by the significance results of the regression and correlation coefficients (Table 1).
Regression models built for OAs using ordinary least squares method in association with ANOVA evaluation
Method precision was evaluated using the most intense peak in the QC urine electropherograms, attributed to tartrate. The corresponding concentrations were 12.78 ± 0.51, 12.71 ± 0.99, and 12.48 ± 0.52 mmol L-1 for the three analytical batches, with relative standard deviations (RSDs) of 4.01, 7.81, and 4.20%, respectively. Considering all 36 QC electropherograms, a global mean concentration of 12.66 ± 0.15 mmol L-1 was obtained, corresponding to an overall RSD of 1.22%. Based on these statistical parameters, reproducibility, repeatability, and precision, the acquired dataset is considered suitable for further ML processing.
Descriptive analysis
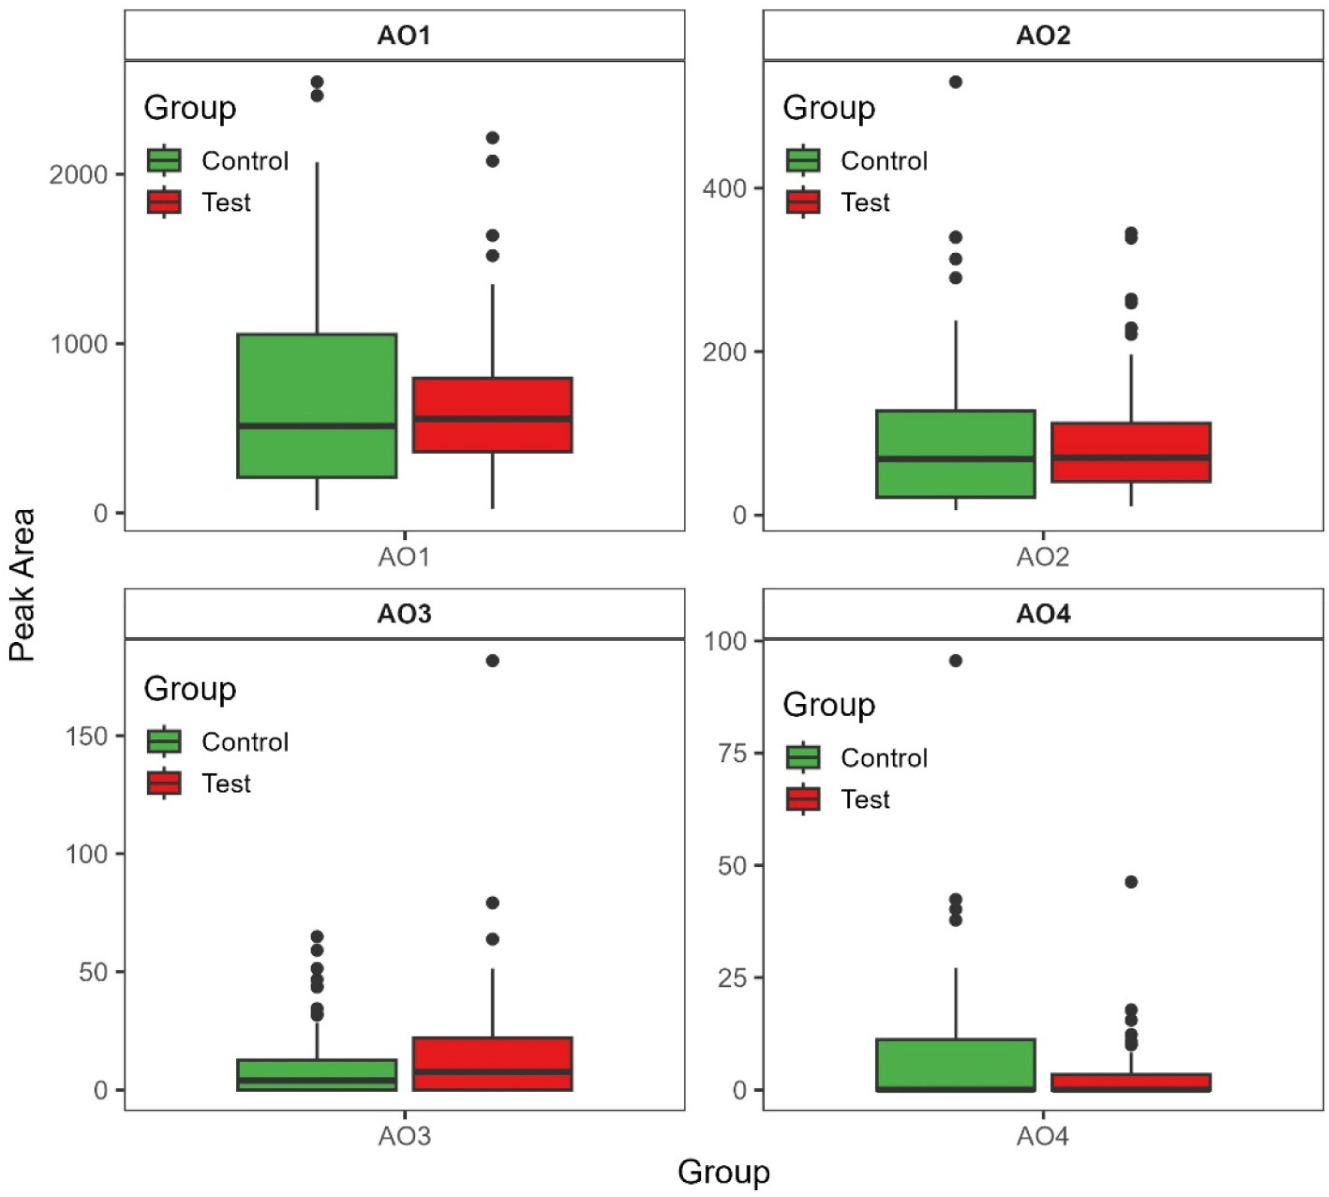
To investigate the distributional behavior of the variables prior to modeling, an exploratory data analysis was performed on the integrated peak areas of the four OAs. Summary statistics indicated that median values were slightly higher in the SARS-CoV-2-positive group compared with the negative group for OA1 (554.50 vs. 512.25) and OA2 (69.95 vs. 68.30), and markedly higher for OA3 (7.55 vs. 3.90). In contrast, OA4 exhibited a median of zero in both groups. The interquartile range (IQR) values revealed considerable variability, particularly for OA1 and OA2 in the negative group (IQR = 843.93 and 105.55, respectively), in contrast to the more compact distributions observed among the positive samples.
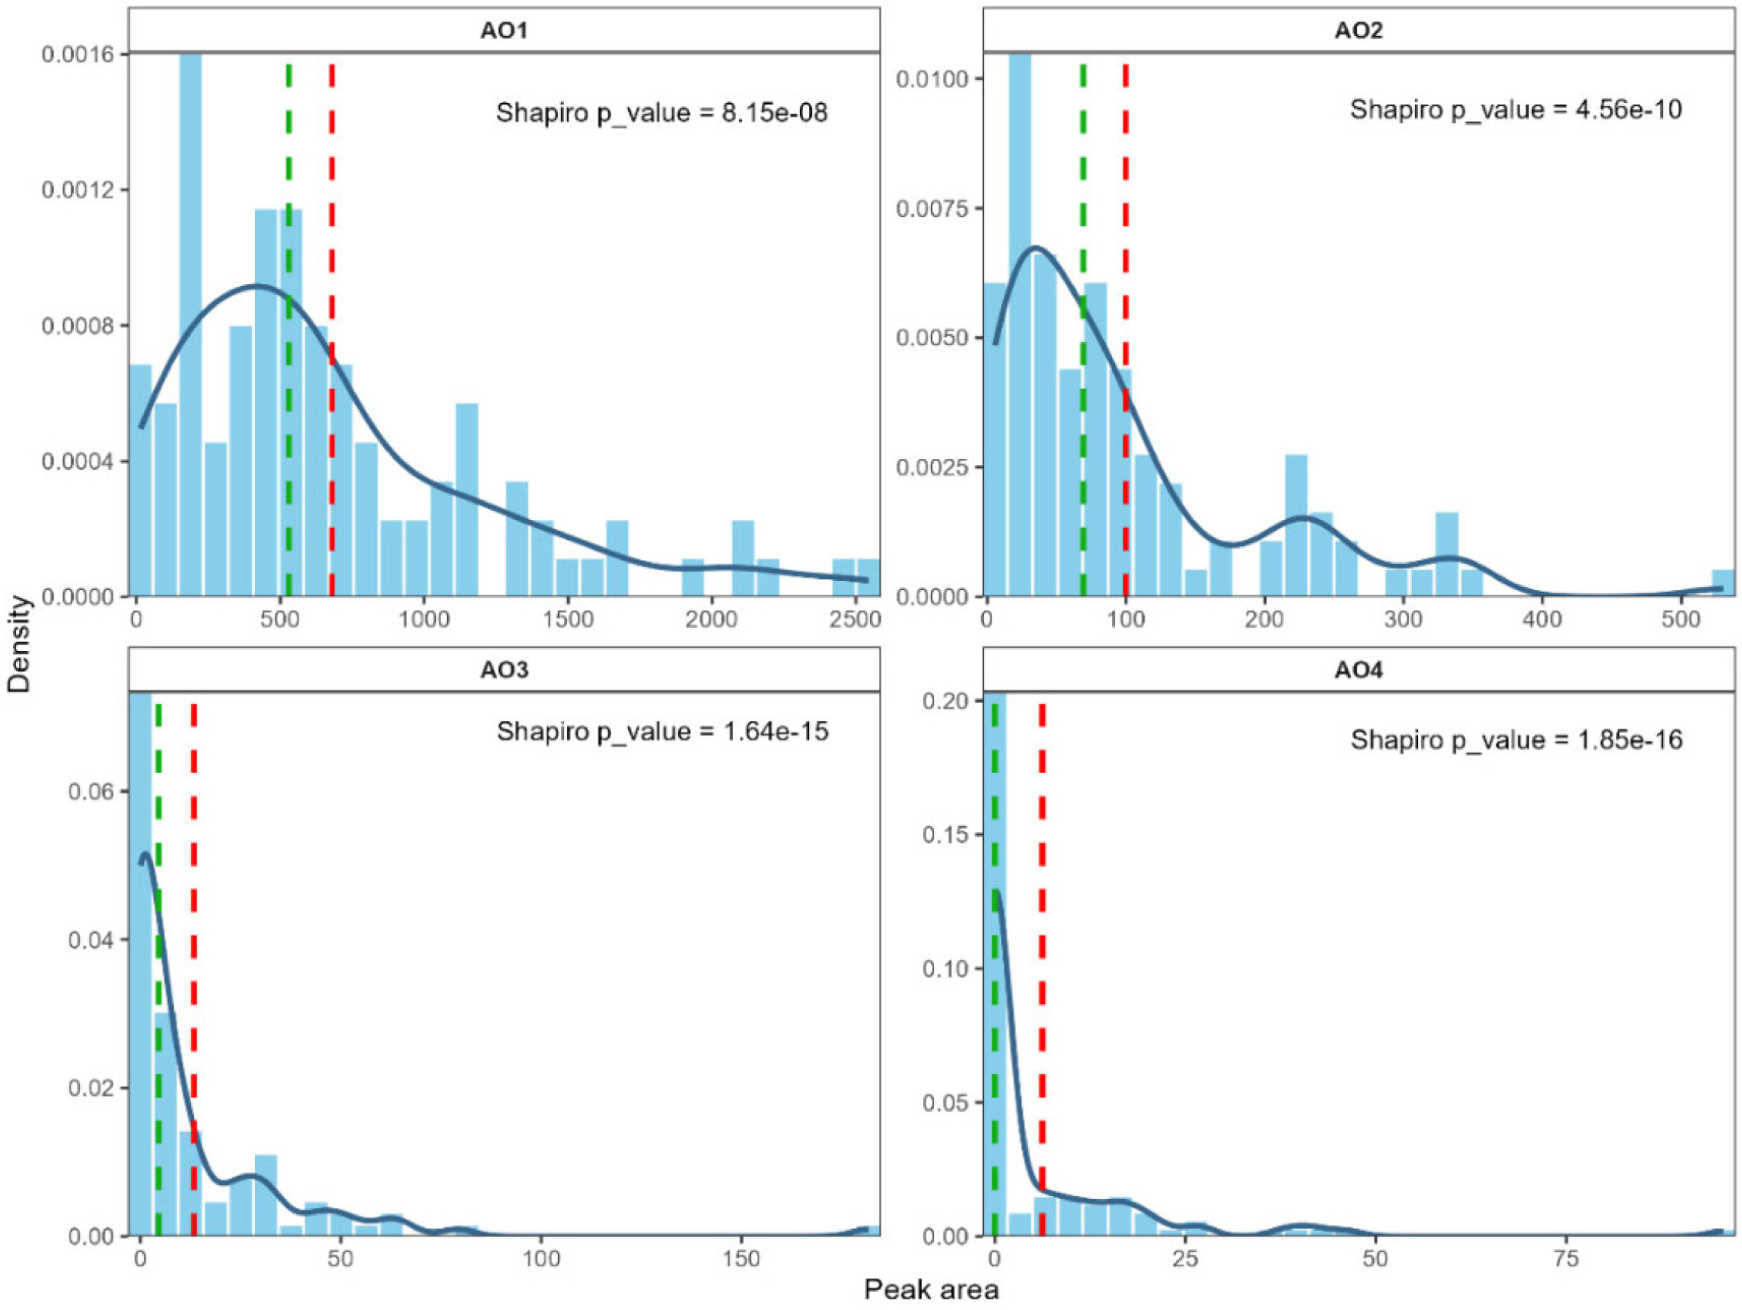
Normality was assessed using the Shapiro-Wilk test applied to the full dataset. None of the four variables exhibited a Gaussian distribution (p < 0.05), which was consisted with the histogram inspection shown in Figure 5. This non-Gaussian distribution supported the selection of non-parametric statistical approaches for subsequent group comparisons and modeling steps.
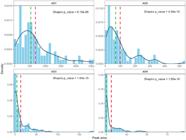
Histogram distribution of the integrated peak areas of OAs OA1-OA4. None of the variables followed a Gaussian distribution according to the Shapiro-Wilk test. Red dashed lines represent the mean, while the green dashed lines represent the median of each peak area.
To assess differences between SARS-CoV-2-positive and -negative individuals, the Wilcoxon rank-sum test was applied to each variable. No statistically significant differences were observed, with p-values of 0.8396 (OA1), 0.3359 (OA2), 0.3053 (OA3), and 0.1924 (OA4). These findings are consistent with the overlapping distributions shown in the boxplots (Figure 6), indicating that none of the OAs, when analyzed individually, can discriminate between positive and negative groups.
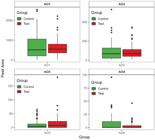
Boxplots comparing SARS-CoV-2-positive and -negative groups for OAs. No statistically significant differences were observed between groups (Wilcoxon test, p > 0.05).
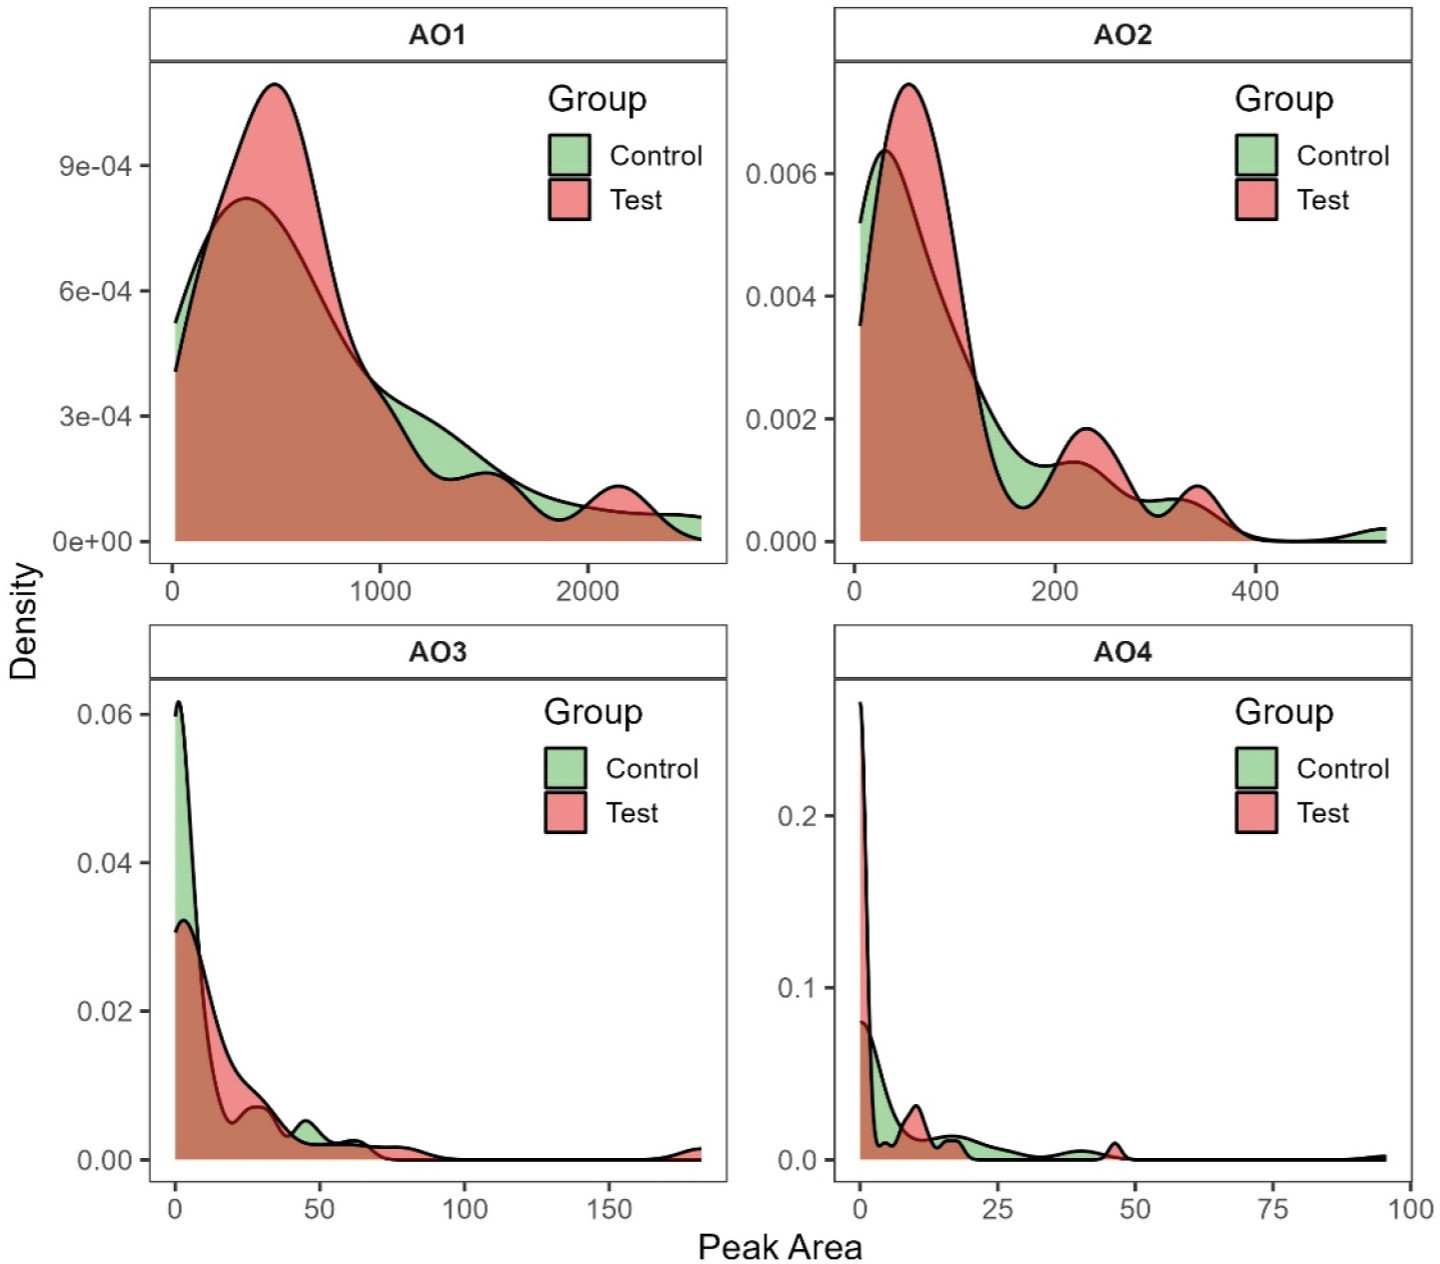
Kernel density estimation (KDE) plots were also generated to provide a smoothed representation of variable distributions across both groups (Figure 7). The resulting density curves revealed substantial overlap between SARS-CoV-2-positive and -negative individuals for all four OAs, reinforcing the conclusions drawn from the statistical analysis. Although OA3 exhibited a slight rightward shift toward higher values in the positive group, the overlap remained considerable, confirming that univariate analysis alone is insufficient for group discrimination.
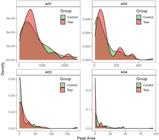
Kernel density estimation plots for OA1-OA4 showing the distribution of positive and negative samples. Substantial overlap between groups can be observed.
Collectively, the exploratory findings indicate that, although subtle trends may be present, the OA profiles do not differ significantly between groups at the univariate level. These results suggest that any potential diagnostic or discriminatory power is more likely to emerge from multivariate interactions, thereby supporting the application of chemometric and ML models in subsequent analyses.
Multivariate analysis
The performance of six supervised classification models (PLS-DA, SIMCA, decision tree (DT), random forest (RF), bagged trees (BT), and stochastic gradient descent (SGD)) was evaluated. Each model was implemented using optimized hyperparameters (Table S2, SI section), which were essential for achieving the final performance. The evaluation metrics, including accuracy, balanced accuracy, recall, precision, F1-score, and Matthews correlation coefficient (MCC), are summarized in Table 2.
The application of ML algorithms to classify urine samples as COVID-19-positive or -negative provided valuable insights into both the potential and the limitations of metabolomics-based screening approaches. Across all models, performance was moderate and inconsistent. Accuracy values ranged from 0.47 to 0.70, while balanced accuracies varied between 0.45 and 0.71. Even the best-performing model, the SGD classifier, achieved an accuracy of only 0.70 and a balanced accuracy of 0.708, both below the threshold typically required for diagnostic purposes (≥ 0.90). These outcomes indicate that, although some class separation exists in the data, it is neither strong nor stable enough to support reliable clinical decision-making.
The PLS-DA model, constructed with two latent components, projected the spectral data into a discriminative subspace maximizing covariance with class labels. However, the model demonstrated limited predictive power, with an accuracy of 0.524 and a balanced accuracy of 0.459 - only marginally above than random classification. The low recall (0.375) and precision (0.375), combined with an MCC near zero, confirmed the weak class separation. The confusion matrix further shows the difficulty in correctly identifying positive samples. These limitations likely arise from assumptions of linear separability and Gaussian-distributed latent variables structure, which are incompatible with the high-dimensional and skewed electrophoretic profiles in the dataset, resulting in underfitting and poor generalization.
The SIMCA model, based on the construction of independent principal component analysis (PCA) models for each class, used three components and achieved high recall (0.875) but low precision (0.418), indicating strong sensitivity to positive samples but poor specificity, with a high number of false positives (FP = 10). This behavior aligns with the operating principle of SIMCA, in which each class is defined as a region in multivariate space constructed from its principal components. As a result, ambiguous or borderline samples may be assigned to multiple classes or to the one with broader variance, resulting in higher recall but reduced precision. Although this characteristic is advantageous for exploratory or preliminary screening, it is unsuitable for strict binary classification in datasets with overlapping or non-elliptical class structures.
To overcome the limitations of linear projection-based models, tree-based algorithms (DT, RF and BT) were explored. These models rely on recursive partitioning of the feature space and make no assumptions about data distribution, making them particularly useful for complex, non-Gaussian electrophoretic datasets. Tree-based models can capture nonlinear feature interactions and local decision boundaries, potentially improving discrimination performance. The DT classifier, optimized using the Gini impurity criterion and requiring a minimum of six samples per split, achieved balanced accuracy of 0.687 and MCC of 0.375. Recall and precision were both 0.625, suggesting a well-balanced trade-off between sensitivity and specificity. The model effectively identified both classes with moderate error rates. Moreover, DTs offer interpretability through explicit hierarchical rules, an advantage in analytical or clinical applications where feature importance has biological meaning. Nonetheless, the modest overall accuracy (0.70) suggests partial overfitting or difficulty in capturing subtle class transitions due to discrete, axis-aligned splits.
The RF ensemble, comprising 819 bootstrap-aggregated trees with feature subsampling, introduced randomization to reduce correlation among trees and improve generalization. Despite these design strengths, the model achieved an accuracy of 0.65, balanced accuracy of 0.583, and MCC of 0.23. Precision remained high (0.667), but recall dropped to 0.25, indicating a conservative classifier prone to false negatives (FN = 6). Similarly, the BTs ensemble, constructed from 100 bootstrapped trees without feature subsampling, produced comparable performance (accuracy = 0.65, recall = 0.25, precision = 0.667). This similarity suggests limited model diversity in the absence of feature randomness. Although bagging reduces variance through prediction averaging, the lack of feature sampling restricts exploration of alternative decision boundaries, resulting in redundancy and reduced sensitivity.
The SGD classifier, employing the modified Huber loss and L1 regularization, yielded the most promising results among all models. Its configuration favored robust convergence and sparse feature selection. The classifier achieved an accuracy of 0.70, balanced accuracy of 0.708, and MCC of 0.408, with recall (0.75) and precision (0.60) indicate a strong balanced between sensitivity and predictive reliability. The confusion matrix indicates that most positive samples were correctly identified, with only a small number of false positives. From an analytical chemistry standpoint, the ability of SGDs to manage sparse and high-dimensional data is particularly valuable, as it supports the selection of chemically meaningful features while minimizing noise. However, due to its linear formulation, the model may still fail to capture nonlinear dependencies within the electrophoretic data. Therefore, although the SGD model demonstrated the best numerical performance, its broader applicability should be considered with caution, especially in scenarios requiring nonlinear feature relationships or more heterogeneous datasets.
The confusion matrices (Table 3) further illustrate that the classification errors were asymmetrically distributed across the models. For instance, SIMCA achieved the highest recall (0.875), correctly identifying most positive cases but at the cost of numerous false positives (FP = 10), which resulted in a lower overall accuracy (0.476). On the other hand, RF and BTs exhibited high specificity (TN = 11) but failed to identify most positive cases (recall = 0.25), leading to potential false-negative outcomes in a diagnostic context. The PLS-DA model, although balanced in its misclassifications, performed near random (accuracy = 0.524, MCC ca. 0), indicating minimal discriminative power. Collectively, these findings highlight instability in the predictive structure across algorithms, suggesting that the signal-to-noise ratio in the dataset is low and that metabolic variations in urinary organic acids may not sufficiently reflect the physiological disturbances caused by COVID-19.
In the context of diagnostic applications, these findings have direct implications. COVID-19 primarily affects the respiratory and immune systems, with downstream metabolic effects that may only subtly influence urinary profiles. While OAs are informative markers of general metabolic status, they are not specific indicators of viral infection. Their concentrations are influenced by multiple exogenous and endogenous factors, including diet, hydration, microbiota composition, renal function, and comorbidities. Consequently, relying exclusively on OA profiling limits the biological interpretability of observed differences and limits the ability of ML models to extract disease-specific information. Even the most advanced algorithms can only learn patterns that are statistically present in the data; if the biological signal is weak or indirect, predictive accuracy will remain inherently low, regardless of algorithmic complexity.
Another key limitation concerns the dataset size. With only 100 urine samples, the models were trained on a relatively small and slightly unbalanced dataset, substantially restricting their capacity for generalization. Small datasets amplify noise and random variation, leading to overfitting during training and unstable performance upon validation. This issue is particularly critical in high-dimensional metabolomic data, where the number of measured features far exceeds the number of samples. Such data structures require strong regularization and stringent validation, which can suppress subtle but real biological effects. As a result, the moderate accuracies observed here are likely to reflect statistical artifacts arising from sample variability rather than true predictive potential.
From a practical standpoint, while this study demonstrates the feasibility of applying ML to urine-based metabolomic data, it also underscores the need for larger and more biologically comprehensive datasets if such models are to be translated into diagnostic or triage tools. In clinical practice, models with accuracies near 0.70 are inadequate for infectious disease screening, as false negatives may delay isolation and treatment, while false positives could lead to unnecessary anxiety or interventions. To progress toward clinical applicability, future studies should expand sample size, ensure class balance, and integrate multiple biochemical domains, such as amino acids, peptides, or volatile compounds, potentially combined with complementary clinical variables (e.g., symptoms, demographics, or inflammatory markers).
In summary, while this exploratory work offers an analytical exploration of COVID-19 classification using urinary OA profiles, the results show that the metabolic association between these compounds and infection status is weak and indirect. The modest predictive metrics obtained across all models highlight the intrinsic difficulty of diagnosing a systemic viral infection from localized urinary metabolites. Although ML remains a powerful analytical framework, its diagnostic success ultimately depends on the biological relevance and statistical richness of the underlying data, factors that, in this study, were inherently limited by the narrow metabolic scope and small sample size.
During the pandemic, several studies56-61 successfully combined the analysis of biological materials with ML and artificial intelligence approaches, employing portable and accessible spectroscopic instruments such as Raman and infrared spectrometers. These techniques have become well-established for classification tasks due to their simplicity and rapid data acquisition. More sophisticated analytical platforms, including matrix-assisted laser desorption/ionization Fourier transform ion cyclotron resonance (MALDI FT-ICR) and inductively coupled plasma mass spectrometry (ICP-MS), have also been explored for COVID-19 investigations, providing complementary molecular insights with higher sensitivity and structural resolution.22,62
In this scenario, CZE is introduced as an alternative that offers the practical advantages discussed in the introduction and produces spectra-like data to suitable for classification workflows. Most previously reported spectroscopic studies63,64 achieved higher modeling sensitivity, indicating that there is still room for further improvement in the association of electromigration data with ML despite some of our models presented sensitivity similar to rapid antigen tests. Compared with the mass spectrometry-based approaches mentioned above, CZE is inherently less complex, especially when used as a screening tool. Altogether, CZE along with these alternatives are included under the label-free perspective, which, there is no need of labels to induce measurements, such as immunoassays like ELISA, although a common instrument in clinical facilities, requires enzyme-labeled antibody capable of detecting an antigen. Label-free strategies may enable the development of classification models extending beyond binary responses toward differential recognition of multiple clinically relevant infectious diseases (e.g., discriminating COVID-19 from influenza, arboviral or other symptom-overlapping viral infections).65
When targeted metabolomics is considered, workflows typically focus on predefined classes or sets of metabolites and may be addressed using a single, well-established analytical platform. In contrast, untargeted metabolomics often relies on multi-platform approaches, combining techniques such as mass spectrometry, liquid chromatography, gas chromatography, and nuclear magnetic resonance to achieve broader metabolic coverage. In this context, even though CZE-UV does not have selectivity enough or fingerprinting information to identify molecules within biological complex matrices, it may be helpful as preliminary screening evaluation of samples to be further analyzed by one of those fingerprinting/comprehensive systems.
Conclusions
In this proof-of-concept study, capillary electromigration techniques coupled with simple UV detection were demonstrated as an automated and low-cost alternative for sample analysis. The method enables overnight processing of dozens of samples with minimal analyst intervention, an advantage particularly relevant in scenarios involving contagious pathogens such as COVID-19.
Overall, the aim of this study was to propose a less invasive, low-cost auxiliary diagnostic strategy for COVID-19 by integrating CE with ML. While saliva has been commonly used as a non-invasive sample in previous studies, urine offers a biosafety advantage since SARS-CoV-2 transmission risk through urine is considerably lower. In this first reported application of CZE-UV for COVID-19-related metabolic screening, we demonstrated the feasibility of combining electrophoretic profiling with data-driven modeling. However, the ML models achieved only moderate discriminative performance, with maximum accuracies of approximately 70% and MCC values below 0.5, indicating limited predictive capability. These outcomes suggest that urinary OA profiles do not encode a strong or direct biochemical signature of COVID-19, likely due to the influence of non-specific factors such as diet, hydration, gut microbiota, and renal physiology.
Nevertheless, this study represents a pioneering effort in evaluating the potential relationship between urinary OAs and COVID-19 classification. Future work involving larger cohorts, improved class balance, and integration of broader metabolomic signatures may enhance predictive performance and contribute to a deeper understanding of the metabolic alterations associated with SARS-CoV-2 infection.
Data Availability Statement
The authors confirm that the data supporting the findings of this study are available within the article and its supplementary material.
Supplementary Information
Supplementary information (volunteer information and optimized hyperparameters for each classification model) is available free of charge at http://jbcs.sbq.org.br as PDF file.
Supplementary PDF
Acknowledgments
The authors acknowledge CAPES (finance code 001); CNPq (445275/2023-5, 406850/2023-2, 303867/2020-5; scholarship 142502/2020-0); Finep (CT-INFRA 01/2013-REF 0633/13); RQ-MG (CEX.RED-00010-14); INCTBio (FAPESP 2014/50867-3; CNPq 465389/2014-7, 401256/2020-0); and FAPEMIG (APQ-01118-24) for financial support. We thank Lemos Laboratório de Análises Clínicas for sample collection/triage and Prof Aripuanã Watanabe and Dionéia Cesar (Institute of Biological Sciences, UFJF) for early-stage intellectual contributions.
References
-
1 Yüce, M.; Filiztekin, E.; Özkaya, K. G.; Biosens. Bioelectron. 2021, 172, 112752. [Crossref]
» Crossref -
2 Falzone, L.; Gattuso, G.; Tsatsakis, A.; Spandidos, D. A.; Libra, M.; Int. J. Mol. Med. 2021, 47, 100. [Crossref]
» Crossref -
3 Chung, Y. S.; Lam, C. Y.; Tan, P. H.; Tsang, H. F.; Wong, S. C.; Int. J. Mol. Sci. 2024, 25, 8155. [Crossref]
» Crossref -
4 Hasan, M. R.; Suleiman, M.; Pérez-López, A.; Front. Genet. 2021, 12, 721556. [Crossref]
» Crossref -
5 López-Hernández, Y.; Monárrez-Espino, J.; Oostdam, A. S. H.; Delgado, J. H. C.; Zhang, L.; Zheng, J.; Valdez, J. J. O.; Mandal, R.; González, F. L. O.; Moreno, J. C. B.; Trejo-Medinilla, F. M.; López, J. A.; Moreno, J. A. E.; Wishart, D. S.; Sci. Rep. 2021, 11, 14732. [Crossref]
» Crossref -
6 Bruzzone, C.; Conde, R.; Embade, N.; Mato, J. M.; Millet, O.; Front. Mol. Biosci. 2023, 10, 1111482. [Crossref]
» Crossref -
7 Liu, T.; Siegel, E.; Shen, D.; Annu. Rev. Biomed. Eng. 2022, 24, 179. [Crossref]
» Crossref -
8 Alyasseri, Z. A. A.; Al-Betar, M. A.; Doush, I. A.; Awadallah, M. A.; Abasi, A. K.; Makhadmeh, S. N.; Alomari, O. A.; Abdulkareem, K. H.; Adam, A.; Damasevicius, R.; Mohammed, M. A.; Zitar, R. A.; Expert Syst. 2022, 39, e12759. [Crossref]
» Crossref -
9 de Oliveira, M. A. L.; Watanabe, A. S. A.; Cesar, D. E.; Candido, J. M. B.; Lima, N. M.; Moreira, O. B. O.; Chellini, P. R.; Quim. Nova 2022, 45, 760. [Crossref]
» Crossref -
10 Feng, W.; Newbigging, A. M.; Le, C.; Pang, B.; Peng, H.; Cao, Y.; Wu, J.; Abbas, G.; Song, J.; Wang, D. B.; Cui, M.; Tao, J.; Tyrrell, D. L.; Zhang, X. E.; Zhang, H.; Le, X. C.; Anal. Chem. 2020, 92, 10196. [Crossref]
» Crossref -
11 Centers for Disease Control and Prevention (CDC); Testing for COVID-19, 2025. [Link] accessed in March 2026
» Link -
12 Rabaan, A. A.; Tirupathi, R.; Sule, A. A.; Aldali, J.; Al Mutair, A.; Alhumaid, S.; Muzaheed; Gupta, N.; Koritala, T.; Adhikari, R.; Bilal, M.; Dhawan, M.; Tiwari, R.; Mitra, S.; Bin Emran, T.; Dhama, K.; Diagnostics 2021, 11, 1091. [Crossref]
» Crossref -
13 Dutta, A.; Sci. Rep. 2022, 12, 13371. [Crossref]
» Crossref -
14 Sule, W. F.; Oluwayelu, D. O.; Pan Afr. Med. J. 2020, 35, 121. [Crossref]
» Crossref -
15 Centers for Disease Control and Prevention (CDC); Considerations for SARS-CoV-2 Antigen Testing for Healthcare Providers Testing Individuals in the Community, 2023. [Link]accessed in March 2026
» Link -
16 National Collaborating Centre for Infectious Diseases; Understanding COVID-19 Antigen Tests, 2023. [Link] accessed in March 2026
» Link -
17 Dutta, D.; Naiyer, S.; Mansuri, S.; Soni, N.; Singh, V.; Bhat, K. H.; Singh, N.; Arora, G.; Mansuri, M. S.; Diagnostics 2022, 12, 1503. [Crossref]
» Crossref -
18 Böger, B.; Fachi, M. M.; Vilhena, R. O.; Cobre, A. F.; Tonin, F. S.; Pontarolo, R.; Am. J. Infect. Control 2021, 49, 21. [Crossref]
» Crossref -
19 Filchakova, O.; Dossym, D.; Ilyas, A.; Kuanysheva, T.; Abdizhamil, A.; Bukasov, R.; Talanta 2022, 244, 123409. [Crossref]
» Crossref -
20 Mathis, D.; Sass, J. O.; Graubner, C.; Schoster, A.; Mol. Genet. Metab. Rep. 2021, 29, 100827. [Crossref]
» Crossref -
21 Pascarella, G.; Strumia, A.; Piliego, C.; Bruno, F.; Del Buono, R.; Costa, F.; Scarlata, S.; Agrò, F. E.; J. Intern. Med. 2020, 288, 192. [Crossref]
» Crossref -
22 de Almeida, C. M.; Motta, L.C.; Folli, G. S.; Marcarini, W. D.; Costa, C. A.; Vilela, A. C. S.; Barauna, V. G.; Martin, F. L.; Singh, M. N.; Campos, L. C. G.; Costa, N. L.; Vassalo, P. F.; Chaves, A. R.; Endringer, D. C.; Mill, J. G.; Filgueiras, P. R.; Romão, W.; J. Proteome Res. 2022, 21, 1868. [Crossref]
» Crossref -
23 Waller, J. V.; Kaur, P.; Tucker, A.; Lin, K. K.; Diaz, M. J.; Henry, T. S.; Hope, M.; Am. J. Roentgenol. 2020, 215, 834. [Crossref]
» Crossref -
24 Fang, Y.; Zhang, H.; Xie, J.; Lin, M.; Ying, L.; Pang, P.; Ji, W.; Radiology 2020, 296, 15. [Crossref]
» Crossref -
25 Tahamtan, A.; Ardebili, A.; Expert Rev. Mol. Diagn. 2020, 20, 453. [Crossref]
» Crossref -
26 Moreira, O. B. O.; de Souza, J. C. Q.; Candido, J. M. B.; do Nascimento, M. P.; Penna, E. A.; Chellini, P. R.; de Oliveira, M. A. L.; Brazilian J. Anal. Chem. 2023, 10, 17. [Crossref]
» Crossref - 27 Géron, A.; Hands-on Machine Learning with Scikit-Learn, Keras, and TensorFlow, 2nd ed.; O’Reilly Media, Inc.: Sebastopol, CA, USA, 2019.
- 28 Kuhn, M.; Johnson, K.; Applied Predictive Modeling, 1st ed.; Springer: New York, USA, 2013.
-
29 McCulloch, W. S.; Pitts, W.; Bull. Math. Biophys. 1943, 5, 115. [Crossref]
» Crossref -
30 Krogh, A.; Nat. Biotechnol. 2008, 26, 195. [Crossref]
» Crossref -
31 Mendez, K. M.; Broadhurst, D. I.; Reinke, S. N.; Metabolomics 2019, 15, 142. [Crossref]
» Crossref -
32 Pomyen, Y.; Wanichthanarak, K.; Poungsombat, P.; Fahrmann, J.; Grapov, D.; Khoomrung, S.; Comput. Struct. Biotechnol. J. 2020, 18, 2818. [Crossref]
» Crossref -
33 Samaraweera, M. A.; Hall, L. M.; Hill, D. W.; Grant, D. F.; Anal. Chem. 2018, 90, 12752. [Crossref]
» Crossref -
34 Corsaro, C.; Vasi, S.; Neri, F.; Mezzasalma, A. M.; Neri, G.; Fazio, E.; Appl. Sci. 2022, 12, 2824. [Crossref]
» Crossref -
35 Asakura, T.; Date, Y.; Kikuchi, J.; Anal. Chim. Acta 2018, 1037, 230. [Crossref]
» Crossref - 36 Boehmke, B.; Greenwell, B.; Hands-on Machine Learning with R, 1st ed.; CRC Press: Boca Raton, FL, USA, 2019.
-
37 Risum, A. B.; Bro, R.; Talanta 2019, 204, 255. [Crossref]
» Crossref -
38 Puhach, O.; Meyer, B.; Eckerle, I.; Nat. Rev. Microbiol. 2023, 21, 147. [Crossref]
» Crossref -
39 Beyene, G. T.; Alemu, F.; Kebede, E. S.; Alemayehu, D. H.; Seyoum, T.; Tefera, D. A.; Assefa, G.; Tesfaye, A.; Habte, A.; Bedada, G.; Tegene, B.; Yeshambaw, M.; Wassie, L.; Mihret, A.; Abdissa, A.; Mulu, A.; Sci. Rep. 2021, 11, 22640. [Crossref]
» Crossref -
40 Ramsay, J.; Morton, J.; Norris, M.; Kanungo, S.; Ann. Transl. Med. 2018, 6, 472. [Crossref]
» Crossref -
41 Vaidyanathan, K.; Narayanan, M. P.; Vasudevan, D. M.; Indian J. Clin. Biochem. 2011, 26, 319. [Crossref]
» Crossref -
42 Zheng, J.; Zhang, L.; Johnson, M.; Mandal, R.; Wishart, D. S.; Anal. Chem. 2020, 92, 10627. [Crossref]
» Crossref -
43 Tsoukalas, D.; Alegakis, A.; Fragkiadaki, P.; Papakonstantinou, E.; Nikitovic, D.; Karataraki, A.; Nosyrev, A. E.; Papadakis, E. G.; Spandidos, D. A.; Drakoulis, N.; Tsatsakis, A. M.; Int. J. Mol. Med. 2017, 40, 112. [Crossref]
» Crossref -
44 Kurtulmus, M. S.; Kazezoglu, C.; Cakiroglu, B.; Yilmaz, H.; Guner, A. E.; North. Clin. Istanbul 2020, 7, 534. [Crossref]
» Crossref -
45 Ludolf, F.; Ramos, F. F.; Bagno, F. F.; da Silva, J. A. O.; Reis, T. A. R.; Christodoulides, M.; Vassallo, P. F.; Ravetti, C. G.; Nobre, V.; da Fonseca, F. G.; Coelho, E. A. F.; Sci. Adv. 2022, 8, eabn7424. [Crossref]
» Crossref -
46 Abbasi, J., JAMA 2022, 327, 1323. [Crossref]
» Crossref -
47 Gutiérrez-Gómez, M. L.; Ruíz, Z.; Gamboa, F.; Roa, N. S.; Cardozo, C.; Ariza, B.; Aristizábal, A.; Lugo, A.; Bolívar, S.; Henao, D.; García-Robayo, D. A.; Diagn. Microbiol. Infect. Dis. 2024, 109, 116320. [Crossref]
» Crossref -
48 Vaikath, N. N.; Al-Nesf, M. A.; Majbour, N.; Abdesselem, H. B.; Gupta, V.; Bensmail, I.; Abdi, I. Y.; Elmagarmid, K. A.; Shabani, S.; Sudhakaran, I. P.; Ghanem, S. S.; Al-Maadheed, M.; Mohamed-Ali, V.; Blackburn, J. M.; Decock, J.; El-Agnaf, O. M. A.; J. Infect. Public Health 2025, 18, 102744. [Crossref]
» Crossref -
49 Ministério da Saúde; Painel Coronavírus, 2023. [Link] accessed in March 2026
» Link -
50 Thakur, V.; Bhola, S.; Thakur, P.; Patel, S. K. S.; Kulshrestha, S.; Ratho, R. K.; Kumar, P.; Infection 2022, 50, 309. [Crossref]
» Crossref -
51 World Health Organization (WHO); COVID-19 Cases, Word, 2023. [Link] accessed in March 2026
» Link -
52 ThermoFisher Scientific; TaqPath COVID-19 CE-IVD RT-PCR Kit [Link] accessed in March 2026
» [Link] -
53 Widera, M.; Westhaus, S.; Rabenau, H. F.; Hoehl, S.; Bojkova, D.; Cinatl, J.; Ciesek, S.; Med. Microbiol. Immunol. 2021, 210, 235. [Crossref]
» Crossref -
54 de Oliveira, M. A. L.; Soares, D. C.; Tostes, G. S.; Guimarães, M. C.; Vaz, F. A. S.; Am. J. Anal. Chem. 2012, 3, 484. [Crossref]
» Crossref -
55 Faria, A. F.; Souza, M. V. N.; Bruns, R. E.; de Oliveira, M. A. L.; J. Chromatogr. A 2008, 1202, 224. [Crossref]
» Crossref -
56 Zhao, B.; Zhai, H.; Shao, H.; Bi, K.; Zhu, L.; Comput. Methods Programs Biomed. 2023, 229, 107295. [Crossref]
» Crossref -
57 Robertson, J. L.; Senger, R. S.; Talty, J.; Du, P.; Sayed-Issa, A.; Avellar, M. L.; Ngo, L. T.; Espriella, M. G.; Fazili, T. N.; Jackson-Akers, J. Y.; Guruli, G.; Orlando, G.; PLoS One 2022, 17, e0270914. [Crossref]
» Crossref -
58 Alexander, R.; Uppal, S.; Dey, A.; Kaushal, A.; Prakash, J.; Dasgupta, K.; Intell. Med. 2023, 3, 22. [Crossref]
» Crossref -
59 Ikponmwoba, E.; Ukorigho, O.; Moitra, P.; Pan, D.; Gartia, M. R.; Owoyele, O.; Biosensors 2022, 12, 589. [Crossref]
» Crossref -
60 Nogueira, M. S.; Leal, L. B.; Marcarini, W. D.; Pimentel, R. L.; Muller, M.; Vassallo, P. F.; Campos, L. C. G.; dos Santos, L.; Luiz, W. B.; Mill, J. G.; Barauna, V. G.; de Carvalho, L. F. C. S.; Sci. Rep. 2021, 11, 15409. [Crossref]
» Crossref -
61 Banerjee, A.; Gokhale, A.; Bankar, R.; Palanivel, V.; Slkar, A.; Robinson, H.; Shastri, J. S.; Agrawal, S.; Hartel, G.; Hill, M. M.; Srivastava, S.; Anal. Chem. 2021, 93, 10391. [Crossref]
» Crossref -
62 Xu, Y.; Chen, B.; He, M.; Hu, B.; Anal. Chem. Acta 2021, 1186, 339134. [Crossref]
» Crossref -
63 Castro, R.; Luz, P. M.; Wakimoto, M. D.; Veloso, V. G.; Grinsztejn, B.; Perazzo, H.; Braz. J. Infect. Dis. 2020, 24, 180. [Crossref]
» Crossref -
64 Cochrane; How Accurate Are Rapid Antigen Tests for Diagnosing COVID-19, 2022. [Link] accessed in March 2026
» Link -
65 Moreira, O. B. O.; Souza, J. C. Q.; Candido, J. M. B.; Nascimento, M. P.; Chellini, P. R.; Lemos, L. M.; de Oliveira, M. A. L.; Talanta 2023, 258, 124465. [Crossref]
» Crossref
Edited by
-
Editor handled this article:
Andrea R. Chaves (Executive)This publication is part of the special issue “Omics Sciences”