Evaluation of Anticancer Potency of Copper(II) Complexes of 7-Hydroxycoumarin N(3)-Substituted Thiosemicarbazones
Abstract
Anticancer activity of the 7-hydroxycoumarin N(3)-substituted thiosemicarbazones was evaluated against the human prostate cancer (DU145) and human embryonic kidney derived HEK293 cell lines. The cytotoxicity of the free ligands (HL1-HL4) along with the copper complexes [Cu(L1)Cl]-[Cu(L4)Cl] were checked using 3-(4,5-dimethylthiazol-2-yl)-2,5 diphenyltetrazolium bromide (MTT) assay. The most potent compound, [Cu(L1)Cl], induced cell death of 56.25 ± 1.17, 73.30 ± 0.71, and 82.33 ± 0.47% at concentrations of 10, 50 and 100 μM, respectively. Cell viability assays revealed that [Cu(L1)Cl] suppressed cancer cell proliferation in a dose-dependent manner with minimal cytotoxic toward HEK293 cells. Acridine Orange/Ethidium Bromide (AO/EB) staining of the compound [Cu(L1)Cl] demonstrated apoptotic morphological changes in DU145 cells, including nuclear shrinkage and chromatin condensation. The intracellular reactive oxygen species (ROS) generation induced by the compound [Cu(L1)Cl] in DU145 cells was evaluated using the 2’,7’-dichlorofluorescein diacetate (DCFH-DA) fluorescent probe. The results showed a significant elevation in ROS levels compared with the untreated control group, with ROS production increasing in a concentration-dependent manner. Additionally, molecular docking analyses revealed that ligands HL1-HL4 and their copper(II) complexes were particularly effective in inhibiting the epidermal growth factor receptor (EGFR) protein.
Keywords:
anticancer potency; apoptosis; dual staining; DU145 cells; thiosemicarbazone
Introduction
Cancer is a widespread medical issue characterized by adverse modifications in the genomic framework of normal cells. These genomic alterations culminate in the dysregulation of cellular proliferation and division, allowing the affected cells to disseminate to adjacent tissues through a mechanism known as metastasis. This progression presents substantial challenges to global health.1 Modern healthcare continues to face escalating difficulties in the field of anticancer therapeutics. Traditional modalities such as surgical intervention, chemotherapy, and radiotherapy persist as foundational treatment approaches; however, recent advancements have introduced novel therapeutic strategies. Cisplatin (cis-diamminedichloroplatinum(II)) emerged as the first notable example of the application of inorganic chemistry in the development of anticancer pharmacological agents. Biocompatible transition metal complexes have demonstrated remarkable bioactivity, exhibiting efficacy even at low concentrations. Such advancements underscore the promising potency of metal based therapeutic approaches in oncological management.2
Coumarins are naturally occurring phytochemicals found in plants such as Tonka beans, lavender, sweet clover, cherries and others. These compounds have also been synthesized for commercial purposes and are recognized for their pharmacological properties, including anticoagulant, antibacterial, antifungal, and antioxidant activities. Additionally, coumarin derivatives are employed as biological inhibitors, chemotherapeutic agents, and bioanalytical reagents. Furthermore, they exhibit antitumor activity and cytotoxic effects, emphasizing their potential utility in therapeutic applications.3 The molecular architectures of coumarins incorporate pharmacological features: the aromatic ring, which facilitates hydrophobic interactions, including π-π interactions, and the lactone group, which acts as hydrogen bond acceptor for a variety of receptors, including enzymes. These compounds are widely distributed in nature, particularly as secondary metabolites.4,5
Thiosemicarbazones represent a class of chemical entities that act as N, S-donor ligands, whose efficacy may be markedly enhanced through the incorporation of additional donor sites. Such systems can demonstrate a variety of coordination modes.6 They display diverse coordination behavior with metal ions and may function either as neutral ligands or as deprotonated anions (bidentate N, S-donor ligands), resulting in the formation of chelate ring structures.7
Thiosemicarbazone derivatives demonstrate significant antibacterial, antimalarial, antiviral, and antitumor activities. Their antiproliferative properties are substantially enhanced upon coordination with metal ions. In particular, copper(II) complexes of N(4)-substituted thiosemicarbazones exhibit biological activity through the inhibition of ribonucleotide reductase or the induction of deoxyribonucleic acid (DNA) strand breaks. Modification at the terminal N(4) atom is also crucial for antifungal efficacy, underscoring the important role of ligand architecture in determining pharmacological properties.8
Stepanenko et al.9 developed a series of thiosemicarbazone-coumarin hybrids, leading to the formation of monoand dinuclear copper(II) complexes. Notably, the antiproliferative activity of these copper(II) complexes was evaluated against resistant cancer cell lines, revealing their potential as promising anticancer agents.
This study reports the synthesis, characterization and anticancer evaluation of new coumarin-based thiosemicarbazones and their copper(II) complexes. The in vitro cytotoxicity was assessed against DU145 prostate cancer cells and human-derived embryonic kidney cells (HEK293, non-cancerous cells) while molecular docking studies were performed using the epidermal growth factor receptor (EGFR) protein.
Experimental
Materials and reagents
7-Hydroxycoumarin, piperidine, pyridine, acetyl chloride, and trypsin-EDTA (ethylenediaminetetraacetic acid) were purchased from Aesar, HiMedia, Merck, Fisher Scientific, and Qualigens, respectively, and used as received. Penicillin-streptomycin (Pen-Strep) and Dulbecco’s Modified Eagle Medium (DMEM) were obtained from HiMedia (Mumbai, India). 3-(4,5-Dimethylthiazol-2-yl)-2,5-diphenyltetrazolium bromide (MTT), ethanol, cisplatin, and other research-grade chemicals were purchased from HiMedia (Mumbai, India) and used as received. Dimethyl sulfoxide (DMSO) was purchased from Genetix Biotec Pvt. Ltd. DU145 and HEK293 cell lines were procured from the National Centre for Cell Science (NCCS), Pune, India. The required cell culture reagents were purchased from Gibco (Invitrogen, USA).
Instrumentation
Fourier-transform infrared (FTIR) spectra were recorded on a Shimadzu IRTracer-100 spectrometer (resolution 0.25 cm-1, signal-to-noise (S/N) ratio 60,000:1) over the wavenumber range of 4000-400 cm-1. Two-dimensional nuclear magnetic resonance (2D NMR) spectra were recorded on a Bruker Neo Ascend™ 400 MHz spectrometer at the Nepal Academy of Science and Technology, Lalitpur, Nepal. Solid-state ultraviolet-visible (UV-Vis) spectra were obtained using a UV-2600i spectrophotometer (slit width: 2.0 nm; external detector mode; light-source switching wavelength: 323 nm; detector switching wavelength: 830 nm) at the Institute of Engineering, Pulchowk Campus, Tribhuvan University, Nepal. FTIR and UV-Vis data were processed using OriginPro 2026 (64-bit) SR1, version 10.3.0.197 (Learning edition).
Melting points were determined using a Philip Harris melting point apparatus at the Central Department of Chemistry, Tribhuvan University, Kirtipur, Nepal. Elemental (CHN) analyses were performed using a LECO TruSpec Micro Analyzer. High-resolution electrospray ionization mass spectra (HR-ESI-MS) were recorded on an LC-QTOF-HRMS spectrometer. Electron paramagnetic resonance (EPR) spectra were recorded on a JES-FA200 EPR spectrometer operating in the X-band at the Indian Institute of Technology, Chennai, Tamil Nadu, India. NMR spectra were recorded on a Bruker BioSpin GmbH 400 MHz NMR spectrometer using DMSO-d6 as the solvent, and chemical shifts are reported in ppm relative to tetramethylsilane (TMS). The measurements were performed at the Indian Institute of Science (IISc), Bangalore, India.
Cell culture
DU145 and HEK293 cells were cultured in Roswell Park Memorial Institute (RPMI)-1640 medium and DMEM high-glucose medium supplemented with 1% antibiotics (100 I.U. mL-1 of penicillin and 100 mg mL-1 streptomycin) and 10% (v/v) fetal bovine serum (Gibco, Invitrogen, USA). The cells were kept at 37 °C in a humidified incubator with 5% CO2.
Methods
Acetylation of hydroxycoumarin
Acetylation was carried out using a solution of 7-hydroxycoumarin (9.24 g, 0.057 mol) in dry pyridine (72 mL) as solvent, with piperidine (4-5 drops) as catalyst. The reaction mixture was cooled to 4 °C prior to addition of acetylating agent. Then, acetyl chloride (6.59 g, 0.084 mol) was added dropwise to the reaction mixture. The mixture was stirred at room temperature for 48 h and the then poured onto 210 mL of ice-cold water. The pH of resulting mixture was adjusted to ca. 1.5 using HCl (2 mol L-1), leading to the formation of precipitate. The precipitated product was collected by suction filtration, washed with water until neutral and dried at 45 °C. The crude product was recrystallized from the water/ethanol (1:1) mixture to afford crystalline solids; melting point (mp) 138 °C (literature, 134-136 °C). Thin layer chromatography (TLC) was used to determine the purity of compound (Scheme 1).10

Synthesis of thiosemicarbazides
The preparation of N(3)-substituted thiosemicarbazides of dimethylamine and piperidine was carried out according to the procedure described by Scovill.11
Synthesis of 3-acetyl-7-hydroxycoumarin thiosemicarbazones (TSC)
The thiosemicarbazones HL1-HL4 were synthesized by refluxing equimolar amounts of 3-acetyl-7-hydroxycoumarin (1 mmol, 0.2041 g) and 1 mmol of respective thiosemicarbazides; N(3)-dimethyl (0.119 g), N(3)-piperdine (0.1452 g), and 4-methyl-3-thiosemicarbazide (0.105 g) and 4-ethyl-3-thiosemicarbazide (0.305 g) in absolute ethanol (10 mL) and 2-3 drops of acetic acid glacial as a catalyst at 80 °C for 6 h (Scheme 2). TLC was used to monitor the progress of the reaction. The reaction mixture was filtered, washed with ethanol and dried at 40 °C overnight. The compound was obtained in powdered form which was recrystallized in MeOH/DMF 9:1 (v/v) and dried again.12

Synthesis of 3-acetyl-7-hydroxycoumarin thiosemicarbazones, R1, R2 = CH3 (HL1); piperidinyl (HL2); H, CH3 (HL3); H, C2H5 (HL4).
Synthesis of copper(II) complexes of thiosemicarbazones
Copper(II) thiosemicarbazones compleses were prepared by refluxing an equimolar mixture (1 mmol each) of CuCl2.2H2O (0.1705 g, 1 mmol) and respective thiosemicarbazone in 10 mL pure ethanol at 80 °C for 3 h (Scheme 3). After cooling to ambient temperature, the solution was filtered, washed with diethyl ether, and dried at 35-40 °C. The product was further purified by recrystallization in ethanol, followed by drying at 80 °C for an additional hour.13
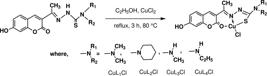
Synthesis of copper(II) complexes of thiosemicarbazones, R1, R2 = CH3 (CuL1Cl); piperidinyl (CuL2Cl); H, CH3 (CuL3Cl); H, C2H5 (CuL4Cl).
(E)-2-(1-(7-Hydroxy-2-oxo-2H-chromen-3-yl)ethylidene)-N,N-dimethylhydrazine-1-carbothioamide (HL1)
64% yield; light yellow solid; mp 182 °C; UV-Vis (solid) Λ / nm 256, 343; FTIR (ATR) Ν / cm-1 3217, 3080, 2824, 2765, 1711, 1667, 1586, 1507, 1335, 972, 1120, 1441; 1H NMR (400 MHz, DMSO-d6) d 10.57 (s, 1H, C7 OH), 9.77, 8.85, (s, 1H, N(2)H), 7.95, 7.45 (d, t, H-C5), 7.54, 7.31 (d, t, H-C4), 6.79, 6.22 (H-C6), 6.71 (H8), 3.49 (6H, N(3)CH3), 1.81 (s, 3H, C(12)-CH3); 13C NMR (100 MHz, DMSO-d6) d 183.6, 168.1, 161.3, 160.4, 155.5, 144.5, 129.7, 126.9, 113.1, 111.3, 102.1, 43.3, 20.6; HRMS (ESI-QTOF) m/z, calcd. for C14H15N3O3S [M + H]+: 306.0907, found: 306.0995; anal. calcd. for C14H15N3O3S: C 55.07, H 4.95, N 13.76, found: C 54.96, H 4.89, N 13.68.
(E)-2-(1-(7-Hydroxy-2-oxo-2H-chromen-3-yl)ethylidene)piperdine-1-carbothioamide (HL2)
36.8% yield; off white solid; mp 190 °C; UV-Vis (solid) Λ / nm 230, 288, 305; FTIR (ATR) Ν / cm-1 3167, 3010, 2889, 2839, 1598, 1532, 1480, 1363, 853, 1152, 1297; 1H NMR (400 MHz, DMSO-d6) d 10.55 (s, 1H, C7-OH), 9.68, 9.30 (s, 1H, N(2)H), 7.93 (H-C5), 7.53 (H-C4), 6.78, 6.20 (H-C6), 6.70 (H-C8), 3.77 (s, C(12)-CH3), 1.85, 1.59, 1.48 (m, N(3)-CH2); 13C NMR (100 MHz, DMSO-d6) d 182.7, 168.3, 161.3, 160.4, 155.5, 144.5, 129.7, 113.1, 111.4, 102.1, 20.7, 49.2, 25.4, 23.8; HRMS (ESI-QTOF) m/z, calcd. for C17H19N3O3S [M + H]+: 346.1220, found: 346.2366; anal. calcd. for C17H19N3O3S: C 59.11, H 5.54, N 12.17, found: C 59.05, H 5.49, N 12.11.
(E)-2-(1-(7-Hydroxy-2-oxo-2H-chromen-3-yl)ethylidene)-N-methylhydrazine-1-carbothioamide (HL3)
68% yield; off white solid; mp 182 °C; UV-Vis (solid) Λ / nm 235, 305, 372; FTIR (ATR) Ν / cm-1 3142, 2934, 2827, 1679, 1596, 1558, 1396, 894, 1127, 1234; 1H NMR (400 MHz, DMSO-d6) d 10.57 (s, 1H, C7-OH), 9.63 (s, 1H, N(2)H), 9.11 (1H, N(3)H), 7.93, 7.52 (d, d, H-C5), 7.88 (H-C4), 6.79, 6.20 (d, s, H-C6), 6.71 (d, H-C8), 2.85 (t, 3H, N(3)-CH3), 1.83 (s, 3H, C(12)-CH3); 13C NMR (100 MHz, DMSO-d6) d 182.1, 174.3, 169.1, 161.3, 160.5, 155.5, 144.6, 142.7, 129.7, 113.2, 111.4, 111.3, 102.2, 31.1, 20.9 C(12)-CH3; HRMS (ESI-QTOF) m/z, calcd. for C13H13N3O3S [M + H]+: 292.0750, found: 292.0766; anal. calcd. for C13H13N3O3S: C 53.60, H 4.50, N 14.42, found: C 53.55, H 4.46, N 14.37.
(E)-2-(7-Hydroxy-2-oxo-2H-chromen-3yl)ethylidene)-N-ethylhydrazine-1-carbothioamide (HL4)
54% yield; off white solid; mp 190 °C; UV-Vis (solid) Λ / nm 233, 276, 359; FTIR (ATR) Ν / cm-1 3175, 2974, 2934, 1669, 1593, 1541, 1304, 820, 1120, 1222; 1H NMR (400 MHz, DMSO-d6) d 10.57 (s, 1H, C7-OH), 9.63, 9.07 (s, 1H, N(2)H), 8.55 (m, 1H, N(3)H), 7.95 (H-C5), 7.54 (H-C4), 6.80, 6.22 (d, d, H-C6), 6.72 (d, H-C8), 1.84 (s, 3H, C(12)-CH3), 1.07, 3.46 (t, N(3)-CH2-CH3); 13C NMR (100 MHz, DMSO-d6) d 181.0, 175.0, 169.0, 161.3, 160.4, 155.5, 144.5, 129.7, 113.1, 111.4, 111.3, 102.1, 37.6, 14.5, 20.9; HRMS (ESI-QTOF) m/z, calcd. for C14H15N3O3S [M + H]+: 306.0907, found: 306.0995; anal. calcd. for C14H15N3O3S: C 55.07, H 4.95, N 13.76, found: C 55.05, H 4.89, N 13.69.
(E)-2-(1-(7-Hydroxy-2-oxo-2H-chromen-3-yl)ethylidene)-N,N-dimethylhydrazine-1-carbothioamide copper(II) chloride ([Cu(L1)Cl])
60% yield; dark green solid; mp 210 °C; UV-Vis (solid) Λ / nm 227, 305, 372, 616; FTIR (ATR) Ν / cm-1 3355-3156, 2979, 2877, 1673, 1597, 1560, 924, 1227, 1407; HRMS (ESI-QTOF) m/z, calcd. for C14H14CuClN3O3S [M + H]+: 402.9813, found: 403.9986; anal. calcd. for C14H14CuClN3O3S: C 41.69, H 3.50, N 10.42, found: C 41.64, H 3.44, N 10.36.
(E)-2-(1-(7-Hydroxy-2-oxo-2H-chromen-3-yl)ethylidene)piperdine-1-carbothioamide copper(II) chloride ([Cu(L2)Cl])
80% yield; dark green solid; mp 246 °C; FTIR (ATR) Ν / cm-1 3252, 3199, 3121, 2975, 2912, 1618, 1544, 1508, 1433, 1340, 837, 1157, 1275; UV-Vis (solid) Λ / nm 228, 307, 349; HRMS (ESI-QTOF) m/z, calcd. for C17H18CuClN3O3S [M + H]+: 443.0126, found: 444.0207; anal. calcd. for C17H18CuClN3O3S: C 46.05, H 4.09, N 9.48, found: C 45.96, H 4.00, N 9.41.
(E)-2-(1-(7-Hydroxy-2-oxo-2H-chromen-3-yl)ethylidene)-N-methylhydrazine-1-carbothioamide copper(II) chloride ([Cu(L3)Cl])
84% yield; brown solid; mp 218 °C; UV-Vis (solid) Λ / nm 233, 305, 370; FTIR (ATR) Ν / cm-1 3294, 3156, 2839, 2749, 1665, 1583, 1547, 1493, 1309, 819, 117, 1219; HRMS (ESI-QTOF) m/z, calcd. for C13H12CuClN3O3S [M + H]+: 388.9657, found: 389.2533; anal. calcd. for C13H12CuClN3O3S: C 40.11, H 3.11, N 10.79, found: C 49.9, H 3.05, N 10.72.
(E)-2-(7-Hydroxy-2-oxo-2H-chromen-3yl)ethylidene)- N-ethylhydrazine-1-carbothioamide copper(II) chloride ([Cu(L4)Cl])
75% yield; dark green solid; mp 220 °C; UV-Vis (solid) Λ / nm 228, 307, 419; (ATR) Ν / cm-1 3355, 3237, 2962, 2893, 1633, 1602, 1543, 1438, 758, 1149, 1218; UV-Vis (solid) Λ / nm 228, 307, 419; HRMS (ESI-QTOF) m/z, calcd. for C14H14CuClN3O3S [M + H]+: 402.9813, found: 403.9849; anal. calcd. for C14H14CuClN3O3S: C 41.69, H 3.50, N 10.42, found: C 41.62, H 3.45, N 10.37.
Computational study
Pharmacokinetics study
The drug-like properties of the synthesized compounds were determined using SwissADME,14 a bioinformatics tool, while toxicity classes were estimated using the ProTox-3.0.15 Additionally, the pkCSM server16 was used to conduct the adsorption, distribution, metabolism, excretion, and toxicity (ADMET) study.
Preparation of ligand structures
The 2D structures of the four synthesized ligands were created using ChemDraw, version 23.1.1.3, converted to SDF format, and saved in Protein Data Bank (PDB) format using BIOVIA Discovery Studio (version v21.1.0.20298). Following energy minimization in AutoDock Tools (version 1.5.7, The Scripps Research Institute, USA), the structures were stored in the PDB, Partial Charge, and Atom Type (PDBQT) format.
Receptor preparation
The EGFR crystal structure in complex with PF 06459988 (PDB ID: 5HG7) was obtained from the Research Collaboratory for Structural Bioinformatics (RCSB) protein database.17 The suitability of EGFR protein structure for docking was demonstrated using Ramachandran plot (Figure 1) and confirmed the structural quality of selected protein model. The binding sites of the co-crystallized ligands were predicted using their binding pockets, and this prediction was validated by the literature.18 To build the EGFR protein structure, all chains and crystalline structures other than the target protein were extracted from the retrieved structure using the BIOVIA Discovery Studio tool, and the processed structure was saved in PDB format. The structures were saved in the PDBQT format in the AutoDock tools after being optimized using Kollmann charges and polar hydrogens. A grid box of 40 × 40 × 40 Å encompassed both the catalytic and binding-site residues involved in ligand binding.

Ramachandran plot demonstrating the high reliability of the protein model. The model meets the accepted quality criterion of more than 90% of residues located in the most favored regions and contains no residues in disallowed regions.
Molecular docking experiment
The binding process and affinity of a ligand to a protein with a known three-dimensional structure can be predicted using the molecular docking method. The synthesized ligands were docked into the binding pocket of target protein using AutoDock Tools, version 1.5.7 (The Scripps Research Institute, USA). Molecular docking was performed under the standard AutoDock Vina configuration, which generated nine ligand poses with binding energies. The BIOVIA Discovery Studio Visualizer was utilized to examine the ligand-protein binding interactions. The most stable binding complex and optimal docking locations were determined by comparing the hydrogen bond interactions and binding energies between the ligand and catalytic residues. The co-crystallized ligand found in the recovered receptor was used to test the docking technique. A binding pocket was considered acceptable if the root mean square deviation (RMSD) value between the docked co-crystallized and redocked ligand was less than 2 Å.
Anticancer screening
Cell viability assay
The MTT assay was performed according to a previously published method.19 DU145 cells (5 × 10³ cells per well) were seeded into 96-well plates and incubated for 24 h. The culture medium was then replaced with fresh medium containing the test compounds at concentrations of 10, 50, and 100 μM. The cells were subsequently kept in a humidified incubator (5% CO2) at 37 °C for a whole day. After the incubation, 20 µL of MTT reagent (5 mg mL-1) was added to the mixture and it was left to incubate for additional 4 h. Then, the formazan crystals in each well were dissolved by adding 150 µL of DMSO. Using a multimode plate reader (Fluostar Omega, BMG LabTech, Germany), the absorbance was measured at 570 nm. The formula used to determine the percentage of cell viability was calculated using equation 1.
Acridine Orange/Ethidium Bromide (AO/EB) staining assay
AO and EB double staining, which interacts with the DNA by intercalation, followed by fluorescence detection, is a widely used technique for evaluating apoptosis in tumor cells. AO produces green fluorescence upon staining DNA by penetrating the plasma membrane of living cells, whereas EB emits red-orange fluorescence and stains the DNA of dead cells. In sterile 6-well culture plates, DU145 cells were seeded at a density of 3 × 10⁵ cells per well for the experiment. The cells were then incubated at 37 °C for 24 h. The test compound [Cu(L1)Cl] was administered to DU145 cells at concentrations of 5 and 10 μM. The cells were incubated for 24 h, then rinsed once with phosphate-buffered saline (PBS) and incubated for 5 min in a staining solution containing 100 μg mL-1 of EB and 100 μg mL-1 of AO. After staining, the cells were washed with PBS to remove excess dye before being imaged using an inverted fluorescence microscope equipped with blue and green filters (Zeiss Axiovert 25, Germany). All experiments were performed in triplicate.
Reactive oxygen species (ROS) generation assay
Intracellular ROS generation was measured using 2’,7’-dichlorofluorescein diacetate (DCFH-DA), which is converted into the fluorescent compound 2’,7’-dichlorofluorescein (DCF) in the presence of ROS.20 In short, DU145 cells were cultivated in 6-well plates at 37 °C for 24 h in a humidified environment with 5% CO2 at a density of 3 × 10⁵ cells per well. The cells were then subjected to the test compound [Cu(L1)Cl] for 24 h at concentrations of 5 and 10 μM. To replicate a tumour microenvironment, a dose of 300 μM H2O2 (positive control) was added. Following a PBS rinse, DCFH-DA dye (30 μM) was added to the cells, and they were then incubated at 37 °C for 30 min. After that, the cells were examined by fluorescence microscopy, and images of DCF fluorescence were captured using an excitation wavelength (Λex) of 485 nm and an emission wavelength (Λem) of 530 nm. Every experiment was performed in triplicate.
Results and Discussion
Fourier-transform infrared spectroscopy
In the FTIR spectra of thiosemicarbazones the broad bands appeared at 3217-3142 cm-1 were attributed to the phenolic OH group. No noticeable change was observed in the Ν(OH) band of the complexes, which indicates non-involvement of phenolic OH in coordination.21 The bands for Ν(NH) were also found merged with Ν(OH). The bands observed in the range of 3175-3142, 1667-1532 and 1711 1598 cm-1 in the FTIR spectra of the free ligands (HL1-HL4) were assigned to Ν(NH), Ν(C=N), and Ν(C=O) vibrations, respectively.22 The most notable spectral change observed upon coordination of the free ligands to the copper (II) ion was the shift of the Ν(C=N) band to lower wavenumbers, accompanied by the appearance of new bands in the range of 1602-1544 cm-1.23 In the spectra of ligands, the Ν(C-H), Ν(C=C), and Ν(C-O, lactone) vibrations of the coumarin moiety were observed at 3080-2765, 1586-1480, and 1441-1222 cm-1, respectively.24
The bands observed in the spectra of the free ligands in the range of 1152-1120 cm-1 were assigned to Ν(N-N) vibrations, and were shifted to higher wavenumbers (1227 1149 cm-1) in the spectra of the corresponding complexes.25 The strong bands observed in the spectra of HL1-HL4 at 1396-1304 and 972-820 cm-1 were assigned to the stretching vibrations of the C=S group. In the spectra of copper (II) complexes, the C=O and C=S bands were observed at lower wavenumbers, in the ranges of 1673-1618 and 1340-1309 cm-1, respectively, showing the coordination of sulfur and oxygen (ketonic) to the copper(II) ion.26 The Ν(S-H) band at 2500-2700 cm-1 was not observed, indicating that the ligands exist in the thione form and ruling out the possibility of thione-thiol tautomerism.23 Thus, FTIR spectra reveal that the bands linked to coordinated atoms in the ligand, which initially have higher electron density, shift to lower frequencies after coordination. (see Supplementary Information (SI) section, Figures S9-S16).
NMR spectroscopy
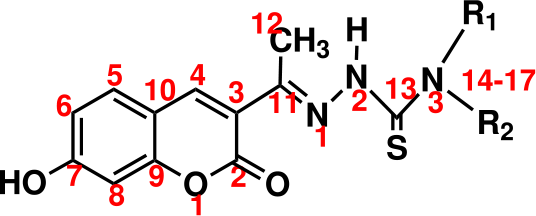
The 1H NMR spectra of the free ligands, HL1-HL4, display broad downfield singlet signals due to the protons of the phenolic OH group at d 10.57-10.55. The N(2)H proton exhibited two signals at d 9.77-8.85 due to E and Z isomers of the compounds having bulkier group at N(3).27 Moreover, the protons of the pyrone ring C(4)H were observed at d 7.88-7.31.28 The aromatic protons of coumarin H(C-5), H(C-6), and H(C-8) appeared at d 7.95 7.45, 6.80 6.20 and 6.72-6.70, respectively (Figure 2). The methyl protons C(12)-CH3 singlets were assigned at d 1.85 1.81.29 The 1H NMR spectrum of HL1 showed a signal at d 3.49 corresponding to N(3)-CH3.30 The proton signals of CH2 groups belonging to the piperidine ring of HL2 were observed at d 3.77-1.48 as multiplets.31 The quartet and triplet signals at d 3.46 and 1.07 were attributed to N(3)-CH2CH3 protons in the 1H NMR spectrum of HL4.32

In the 13C NMR spectra of the ligands HL1-HL4, the most downfield signals were observed at d 183.60-181.00, which were attributed to the carbon atom of C=S group. The carbonyl group (C=O) in these compounds showed resonance at d 175.00-174.33.33 Moreover, the chemical shifts corresponding to the C=N carbon was observed at d 169.12-168.06; the formation of this bond confirms the presence of azomethine group in the ligands. The downfield signals at d 161.32-161.26 and 160.47-160.40 were attributed to carbons linked to ethereal oxygen C(9) and the carbon C(7) linked to OH group, respectively. The peaks for the pyrone carbons C(3) and C(4) were observed at d 155.51-155.47 and 144.56-144.50, respectively. The 13C NMR spectra showed the presence of aromatic carbons C(5) and C(6) at d 129.74-129.68 and 113.15 113.09, respectively, as expected. The peaks for C(10) and C(8) were observed comparatively in the upfield region at d 111.38-111.26 and 102.18-102.13, respectively. As observed in 1H NMR spectra, C(6) exhibited multiple peaks in 13C NMR spectra due to the presence of isomers.34 The 13C NMR spectra showed signals at d 20.92-20.60 assigned to the CH3 group linked to azomethine carbon. The N(3) CH3 groups in the ligands HL1 and HL3 showed peaks at d 43.31 and 31.07, respectively. The signal at d 37.63 in HL4 was assigned to N(3)-CH2 group of N(3)-ethyl. Ligand HL2 showed peaks at d 49.22, 25.39 and 23.83 for the N(3)-piperidinyl ring31 (see SI section, Figures S25-S35).
Mass spectrometry
The ligands and their respective complexes were identified by positive-mode mass spectrometry. The molecular ion peaks of the ligands HL1-HL4 resulted from the fragmentation of the protonated molecular ions, with m/z values found (calculated) as follows: 306.0995 (306.0907), 346.2366 (346.1220), 292.0766 (292.0750) and 306.0995 (306.0907), respectively. For their copper complexes, [Cu(L1)Cl]-[Cu(L4)Cl], the m/z values found (calculated) were 403.9986 (402.9813), 444.0207 (443.0126), 389.2533 (388.9657) and 403.9849 (402.9813), respectively. The estimated values for the proposed molecular structures agreed well with the HR-MS data. In case of the copper complexes, the experimentally determined m/z values were higher by one unit than the calculated values, which can be attributed to the presence of naturally abundant copper isotopes25 (see SI section, Figures S1-S8).
UV-Vis spectroscopy
Electronic spectra of the Schiff bases and their copper(II) complexes in the solid state were recorded in the region of 200-800 nm. The UV-Vis spectral data of the ligands showed a strong π→π* absorption bands at 230 256 nm.21 The shoulder-like features observed at 288 305 and 305 372 nm were assigned to n→π* intra-ligand electronic transitions arising from involvement of lone-pair electrons on the sulfur, nitrogen, and oxygen atoms.31
The electronic spectra of the copper(II) complexes, [Cu(L1)Cl]-[Cu(L4)Cl] exhibited bathochromic shifts in the n→π* transitions associated with the C=N, C=O and C-S chromophores, with absorption maxima shifted to higher wavelength and appearing in the range of 349 419 nm.22 This shift suggests increased delocalization of electron density within the chelate ring, leading to complex stabilization (see SI section, Figures S17-S24).
Electron paramagnetic resonance spectroscopy
The EPR spectra of the copper(II) complexes, [Cu(L1)Cl]-[Cu(L4)Cl] were recorded at 305 K in the X-band frequency range of 9162.235-9171.858 MHz, showing the g‖ values in the range of 2.405-2.380, whereas the corresponding g┴ values were in the range of 2.084-2.079. The calculated g‖, g┴, gav and G values of the copper(II) complexes are summarized in Table 1. The spectral data are consistent with axial symmetry, which arises from the interaction of the unpaired electron with the nuclear spin of Cu2+ in the complexes. The Zeeman splitting resulted in four hyperfine lines corresponding to the nuclear spin states of 3/2, 1/2, -1/2, and -3/2, due to the nuclear spin (‖ = 3/2) of both 63Cu and 65Cu isotopes.35
The splitting in g‖ region attributed to hyperfine coupling was observed in EPR spectra of these complexes. The spectra displayed one peak at the magnetic field corresponding to the xy plane and four peaks at the magnetic field values along the z axis.36 The observed g tensor values (g‖ >g┴ > ge = 2.0023) indicate that the unpaired electron resides predominantly in the ground-state dx2-y2 orbital, which is characteristic of a square planar geometry.37 The degree of covalence affects spin-orbital coupling and consequently shifts the g value from the free electron value (ge = 2.0023), while the exchange interaction between metal ions in the solid states can be assessed using the geometric parameter G.38 The EPR spectra of the complexes in this study exhibited G > 4, indicating negligible interaction between copper(II) ions in the solid state, which supports the mononuclear structure36 (see SI section, Figures S36-S39).
Anticancer potential of test compounds in DU145 cell line
DU145 and HEK293 cell lines were used to investigate the cell cytotoxicity and antitumor efficiency of test compounds. DMSO (concentration ≤ 0.1) was used to dissolve the test compounds, and cell samples without DMSO were utilized as controls. Prior to treatment with the complexes, both cell lines were cultured for 24 h. Additionally, as described in the Methods sub-section, the test compounds at concentrations of 10, 50, and 100 μM were applied to both cell lines. After a 24 h of exposure, the effects of the test compounds were assessed using MTT assay. Cisplatin was used as a positive control to against the DU145 cell line to compare cytotoxicity. The percentage of non-viable cells in relation to the concentrations of the test compounds (10, 50, and 100 μM) was calculated (Figure 3).

Cytotoxic effects of the compounds against DU145 cells (after 24 h of treatment, MTT assay). [Cu(L1)Cl] potent compound against HEK293 cells. *p < 0.05, **p < 0.01, and ***p < 0.001, compared with the control group. Values are expressed as mean ± SEM. C: control, PC: positive control, and NC: negative control.
The cytotoxic effects of the ligands and their copper(II) complexes were evaluated at 10, 50, and 100 μM. Ligands HL1, HL2, HL3, and HL4 inhibited cell viability by 13.63, 31.13, 20.97, and 2.11% at 10 μM concentration; 22.87, 49.22, 29.58, and 12.10% at 50 μM concentration; and 41.66, 66.04, 33.18, and 31.59% at 100 Mm, respectively. In comparison, the copper(II) complexes exhibited enhanced cytotoxicity, with [Cu(L2)Cl], [Cu(L3)Cl], and [Cu(L4)Cl] causing 44.53, 36.64, and 50.30% inhibition at 10 μM; 57.63, 46.16, and 63.59% inhibition at 50 μM; and 70.20, 61.71, and 72.57% inhibition at 100 Mm, respectively. Moreover, the MTT assay showed that [Cu(L1)Cl] exhibited remarkable potency against DU145 cells compared with the other test compounds, causing cell death of 56.25 ± 1.17, 73.30 ± 0.71, and 82.33 ± 0.47% at concentrations of 10, 50 and 100 μM, respectively, indicating that metal complexation improved the anticancer activity. In contrast, cisplatin eradicated approximately 50% of cells at a half maximal inhibitory concentration (IC50) concentration of 30 µM, as reported previously.19 In accordance with this, cisplatin (standard drug) induced 46.87 ± 1.43% cell death at 30 μM in DU145 cells.
In the cytotoxicity assay using HEK293 non-cancerous cells, the most potent compound [Cu(L1)Cl] showed 8.56 ± 2.22, 23.64 ± 1.67, and 40.88 ± 1.83% cell death at concentrations of 10, 50 and 100 μM, respectively, which was far less cytotoxic than the observed in the DU145 cell line (Table 2). The cell viability tests demonstrated that [Cu(L1)Cl] exhibits concentration-dependent inhibition of cancer cell growth while sparing non-cancerous cells (Figure 3). Since cytotoxicity was assessed at only three concentrations (10, 50, and 100 μM), reliable IC50 values could not be determined. Therefore, the anticancer activity is presented as the percentage inhibition of cell viability at different concentrations. The IC50 value of the positive control was obtained from previously published literature.19
Statistical analysis
Experiments were performed in triplicate, and data are presented as mean ± standard error of the mean (SEM). Statistical comparisons among groups were performed using one-way analysis of variance (ANOVA), followed by Tukey’s post hoc test to determine significant differences between groups. Statistical significance was considered at p < 0.05 and is indicated in graph by different asterisks. Statistical analyses were performed using GraphPad Prism software,39 version 9.0.0.
Detection of apoptosis by AO/EB
Targeting cancer cells and inducing their death through apoptosis process is one of the therapeutic objectives of effective anticancer agents. The typical morphological characteristics of apoptotic cells include cytoplasmic cell shrinkage, chromatin condensation, plasma membrane blebbing, DNA fragmentation, and phosphatidylserine transfer to the extracellular side. The dual AO/EB fluorescent staining assay is widely used to detect basic morphological changes in apoptotic cells. Furthermore, this method allows differentiation among necrotic cells, early and late apoptotic cells, and normal cells.40 Therefore, AO/EB staining represents a qualitative and semi quantitative technique for apoptosis detection. While EB dye only stains cells that have lost the integrity of their membranes and show red fluorescence, AO dye can penetrate intact cell membranes and stain them green. The morphological alterations caused by [Cu(L1)Cl] at concentrations of 5 and 10 μM in DU145 cells were investigated using the AO/EB staining method following a 24-hour incubation period. These concentrations were selected for AO/EB staining in order to assess apoptosis at a submaximal concentration (5 μM) and at the concentration corresponding to the IC50 value (10 μM). A concentration of 5 μM was used to study early apoptotic alterations at a lower sub-cytotoxic dose. The control, or living cells, were depicted as green. However, apoptosis was induced and red fluorescence was observed in the examined cancerous cells as shown in Figure 4. The findings showed that the DU145 prostate cancer cells underwent morphological alterations, including nuclear shrinkage and chromatin condensation, which ultimately resulted in apoptosis.

Images of DU145 cells stained with AO/EB fluorescent dye, captured by a fluorescence microscope. The scale bar represents 100 μm, and the magnification was 20×. DU145 cells were treated with cisplatin (30 μM) and the most potent compound, [Cu(L1)Cl], for 24 h.
Evaluation of intracellular reactive oxygen species
Usually, ROS generation is associated with cell death. Additionally, ROS can alter the response of several critical cell-signalling molecules, such as nuclear factor kB, tumour suppressor protein p53, mitogen-activated protein kinases, and other cell cycle checkpoint proteins.41 Therefore, intracellular variations in ROS levels can affect whether cells undergo apoptosis, exit the cell cycle, or proceed through it.42 ROS levels ultimately determine how quickly the cell cycle is stimulated or repressed, and these changes depend on the cell type, extracellular stimuli, and exposure time. Here, we used the oxidation-sensitive fluorescent dye DCFH-DA to measure the levels of ROS generated in DU145 cells with and without treatment the test compound [Cu(L1)Cl].
The ROS generated by compound [Cu(L1)Cl] at concentrations of 5 and 10 μM in DU145 cells were measured using the DCFH-DA probe. Treatment of DU145 cells with compound [Cu(L1)Cl] resulted in a marked increase in ROS levels compared to the control, which was further enhanced with increasing concentrations. This increase may have contributed to the induction of apoptosis in these cells, as observed in Figure 5. Dichlorofluorescein fluorescence levels in the treated cells were noticeably higher than those in the control cells, as observed by fluorescence microscopy.

DCFH-DA staining for the detection of ROS generation in DU145 cells after 24 h of treatment with the test compound [Cu(L1)Cl]. H2O2 was used as the positive control. Green fluorescence was observed in the DCFH-DA-stained treated cells. The scale bar represents 100 μm, and the magnification was 20×.
Pharmacokinetics analysis
The transition from lead compounds to a clinical treatment candidate is one of the most challenging issues in drug discovery and development. A drug must be highly selective, have few side effects, and possess sufficient bioavailability and biodistribution to elicit the desired biological response in order to be considered for further development.43 The pkCSM tool aids in evaluating potency, pharmacological characteristics (Tables 3 and 4), and associated safety issues of drugs.44 All four synthesized ligands and their copper complexes showed significant human intestinal absorption (HIA), with values ranging from 70-92%. To evaluate the absorption and bioavailability of oral medications, the permeability of the colon cancer cell line (Caco-2) is assessed; a suitable permeability value is defined as an apparent permeability coefficient (Papp) value > 8 × 10⁻⁶ cm s-1.45 Ligands with a log BB ≤ 0.3 that partially pass the blood-brain barrier (BBB) are poorly dispersed to the brain. Drugs whose action site is unrelated to the brain should ideally not cross the BBB in order to prevent neurotoxicity.46 Cytochrome P450 (CYPs) enzymes play crucial roles in drug metabolism and detoxification. Among them, CYP2D6 and CYP3A4 contribute for anticancer drug metabolism.47,48 Topological polar surface area (TPSA) is a measure of the ability of the drug to penetrate cells; TPSA values > 140 Å2 indicates poor drug permeability, whereas TPSA values ≤ 60 Å2 indicates strong permeability.49,50 The TPSA values obtained for the four ligands and their complexes exhibited mild permeability. Lipinski’s rule of five was not violated by any of the four ligands and the complex [Cu(L1)Cl], indicating favorable drug-like proprerties (Tables 5 and 6).
An in silico ADME profile (Figure 6) confirmed that the complex [Cu(L1)Cl] occupies the ideal drug-like space for key parameters, including size, lipophilicity, polarity, and solubility. Its rigid and well-defined molecular framework offers a structural advantage by reducing entropic loss during receptor binding, making it a highly potent and architecturally optimized candidate for further therapeutic exploration. Pharmacokinetic evaluation using the SwissADME BOILED-Egg plot (Figure 6) confirms the favorable ADME profile of [Cu(L1)Cl]. Its position in the white region predicts robust oral gastrointestinal absorption, while its exclusion from the yellow yolk indicates a lack of blood-brain barrier penetration, reducing the risk of CNS (central nervous system) side effects. Crucially, the blue designation identifies the molecule as a non-substrate for P-glycoprotein (P-gp), suggesting it may evade cellular efflux to optimize intracellular retention and bypass drug-resistance pathways.

Radar figure (left) showing the potent copper complex, [Cu(L1)Cl], occupies the ideal drug-like window for key parameters, including size, lipophilicity, polarity, and solubility. BOILED-Egg plot (right) of [Cu(L1)Cl] showing favorable ADME profile.
The ProTox-3.0 server features applications for examining the toxicities that led to the classification of toxicity classes into six major groups. The ligands were classified as toxicity class V, whereas their cooper(II) complexes belonged to class IV, indicating relatively low toxicity.51 In silico profiling against the reference class average indicated that the complex [Cu(L1)Cl] possesses an excellent overall safety profile, with minimal or no predicted activity against major receptors and CYP enzymes (Figure 7). Apart from a high predicted probability for immunotoxicity, the other potential liabilities were restricted to moderate risk scores for carcinogenicity, respiratory toxicity, hepatotoxicity, and clinical/nutritional toxicity. Consequently, this specific liability does not invalidate the structure; rather, it provides a strategic roadmap for subsequent structural optimization while preserving on-target potency.

Illustration of the predicted toxicity and bioactivity profile of the [Cu(L1)Cl] compared to class average.
Molecular docking studies analysis
Docking protocol validation was achieved by redocking the reference inhibitor into the EGFR binding site. The lowest energy pose aligned precisely within the native pocket, maintaining the original binding energy and amino acid interactions. Superimposition of the redocked pose onto the initial conformation revealed a low RMSD of 0.317 Å (Figure 8), demonstrating the high reproducibility of the docking methodology and establishing its suitability for further studies.

Validation of the docking protocol. Superimposition of first docked reference inhibitor (blue) and the redocked reference inhibitor (green), showing an RMSD value of 0.317 Å.
To analyze docking outcomes, researchers typically focus on binding energy, hydrogen bonds, and specific amino acid interactions. Low binding energies and strong hydrogen-bonding interactions contribute to greater complex stability and stronger protein-ligand recognition. This study revealed that the ligands exhibited superior binding to the EGFR active sites compared to the reference inhibitor, PF-06459988.
All four synthesized ligands and their corresponding copper complexes, which were capable of inhibiting cancer cell proliferation at different concentrations, were docked into the EGFR protein, and each was found to interacted with catalytic residues. Docking scores and interacting residues show that ligand HL2 and the complexes [Cu(L2)Cl], [Cu(L1)Cl], and [Cu(L3)Cl] exhibited excellent binding affinity toward the target protein (Tables 7 and 8), whereas [Cu(L4)Cl], HL1, HL3, and HL4 showed interactions comparable to those of the reference ligand (Figure 9).

Structures of the (a) [Cu(L1)Cl] complex and (b) reference ligand bound to the EGFR protein.
The molecular docking result predicts that ligand HL2 established strong binding connections with the catalytic residue Met 793 through hydrogen-bonding, with a binding energy of -8.1 kcal mol-1. In addition, it interacted with other important amino acid residues through hydrogen-bonding and hydrophobic bonding interactions. The complexes [Cu(L1)Cl], [Cu(L2)Cl], and [Cu(L3)Cl] demonstrated stronger binding in the target protein binding site than its corresponding ligans, with binding energies of -8.0, -8.3, and -8.0 kcal mol-1, respectively, and showed hydrogen bonds with the catalytic residue Cys 797. Meanwhile, the thiosemicarbazones HL1, HL3 and HL4 showed acceptable binding energies of -7.1, -7.2, and -6.9 kcal mol-1, respectively, comparable to that of the reference ligand and accompanied by hydrogen-bonding interactions with catalytic residues: Cys 797 and Met 793. According to the findings of molecular docking and pharmacokinetics analyses, the complexes [Cu(L1)Cl], [Cu(L2)Cl], and [Cu(L3)Cl], together with ligand HL2, appears to be the most promising inhibitors of the EGFR protein. Hence, the computational study support in vitro studies which demonstrates that the copper complexes exhibited greater cytotoxic activity than their corresponding ligands.
Conclusions
Anticancer activity of the synthesized compounds against the human prostate cancer cell line DU145 and the human embryonic kidney-derived non-cancerous HEK293 cells showed promising effects. Free thiosemicarbazones HL1 HL4 showed comparatively lower cytotoxicity values of 13.63 ± 1.86, 31.13 ± 2.24, 20.97 ± 2.20, and 2.11 ± 1.29%, respectively, at a concentration of 10 μM, whereas copper(II) complexes [Cu(L1)Cl]-[Cu(L4)Cl] exhibited higher cytotoxicity values of 56.25 ± 1.17, 44.53 ± 0.89, 36.64 ± 0.47, and 50.30 ± 0.84% at 10 μM, respectively, at the same concentration.
The cell viability tests showed that [Cu(L1)Cl] has the potential to inhibit the growth of cancer cells at various concentrations without significantly harming the non-cancerous cells. The IC50 value of the positive control was obtained from previously published literature and is presented as a reference. However, the IC50 values of the test compounds could not be determined because only three concentrations were evaluated in this study. Therefore, the cytotoxicity data are reported as percentage cell death at different concentrations. AO/EB staining of DU145 cells treated with [Cu(L1)Cl] demonstrated morphological alterations, including nuclear shrinkage and chromatin condensation, which ultimately resulted in apoptosis. Furthermore, intracellular ROS generation studies exhibited that treatment with [Cu(L1)Cl] caused a marked increase in ROS levels in DU145 cells compared with the control, thereby contributing to apoptosis induction. Additionally, molecular docking studies of copper complexes [Cu(L1)Cl], [Cu(L2)Cl], and [Cu(L3)Cl] revealed significant binding affinities of -8.0, -8.3, -8.0 kcal mol-1, respectively, toward the target protein, and hence aligning with the result of in vitro studies.
Supplementary Information
Supplementary data (1H NMR, 13C NMR, FTIR, UV-Vis, EPR and HRMS spectra, ADMET data, molecular docking data, and additional supporting figures and tables) are available free of charge at http://jbcs.sbq.org.br as PDF file.
Supplementary PDF
Data Availability Statement
The data supporting the findings of this study are available within the article and its Supplementary Information section.
Acknowledgments
We sincerely acknowledge Indian Institute of Technology, Chennai (CHN, HRMS, and EPR analyses), Indian Institute of Science, Bangalore (NMR spectra), the Department of Biosciences and Bioengineering, Indian Institute of Technology (anticancer screening), the Nepal Academy of Science and Technology (FTIR and 2D NMR), Institute of Engineering, Pulchowk, Tribhuvan University (solid-state UV-Vis spectra). Grammarly was used only for English language editing and grammar checking during manuscript preparation. The authors reviewed and approved all edits and take full responsibility for the scientific content of the manuscript.
References
-
1 Amin, K. M.; Taha, A. M.; George, R. F.; Mohamed, N. M.; Elsenduny, F. F.; Arch. Pharm. 2018, 351, 1700199. [Crossref]
» Crossref -
2 Mahmoud, W. H.; Mostafa, M. S.; Omar, M. M.; Mohamed, G. G.; Egypt. J. Chem. 2021, 64, 3019. [Crossref]
» Crossref -
3 Abdel-Kader, N. S.; Moustafa, H.; El-Ansary, A. L.; Sherif, O. E.; Farghaly, A. M.; New J. Chem. 2021, 45, 7714. [Crossref]
» Crossref -
4 Hollauer, H. V. P.; Novas, R. C. V.; Guedes, G. P.; Buarque, C. D.; Escobar, L. B. L.; Acta Crystallogr., Sect. E: Struct. Rep. Online 2023, 79, 842. [Crossref]
» Crossref -
5 Yildirim, M.; Poyraz, S.; Ersatir, M.; Med. Chem. Res. 2023, 32, 617. [Crossref]
» Crossref -
6 Kalaiarasi, G.; Rajkumar, S. R. J.; Dharani, S.; Małecki, J. G.; Prabhakaran, R.; RSC Adv. 2018, 8, 1539. [Crossref]
» Crossref -
7 Rahman, K. N. A.; Haribabu, J.; Balachandran, C.; Bhuvanesh, N. S. P.; Karvembu, R.; Sreekanth, A.; Polyhedron 2017, 135, 26. [Crossref]
» Crossref -
8 Rapheal, P. F.; Manoj, E.; Kurup, M. R. P.; Polyhedron 2007, 26, 818. [Crossref]
» Crossref -
9 Stepanenko, I.; Babak, M. V.; Spengler, G.; Hammerstad, M.; Popovic-Bijelic, A.; Shova, S.; Büchel, G. E.; Darvasiova, D.; Rapta, P.; Arion, V. B.; Biomolecules 2021, 11, 862. [Crossref]
» Crossref -
10 Eisenhauer, H. R.; Link, K. P.; J. Am. Chem. Soc. 1953, 75, 2044. [Crossref]
» Crossref -
11 Scovill, J. P.; Phosphorus, Sulfur Silicon Relat. Elem. 1991, 60, 15. [Crossref]
» Crossref -
12 Imran, A.; Shehzad, M. T.; al Adhami, T.; Rahman, K. M.; Hussain, D.; Alharthy, R. D.; Shafiq, Z.; Iqbal, J.; Bioorg. Chem. 2021, 115, 105164. [Crossref]
» Crossref -
13 Refat, M. S.; El-Deen, I. M.; Anwer, Z. M.; El-Ghol, S.; J. Mol. Struct. 2009, 920, 149. [Crossref]
» Crossref -
14 Daina, A.; Michielin, O.; Zoete, V.; Sci. Rep. 2017, 7, 42717. [Crossref]
» Crossref -
15 Banerjee, P.; Eckert, A. O.; Schrey, A. K.; Preissner, R.; Nucleic Acids Res. 2018, 46, W257. [Crossref]
» Crossref -
16 Pires, D. E.; Blundell, T. L.; Ascher, D. B.; J. Med. Chem. 2015, 58, 4066. [Crossref]
» Crossref -
17 Cheng, H.; Nair, S. K.; Murray, B. W.; Almaden, C.; Bailey, S.; Baxi, S.; Behenna, D.; Cho-Schultz, S.; Dalvie, D.; Dinh, D. M.; Edwards, M. P.; Feng, J. L.; Ferre, R. A.; Gajiwala, K. S.; Hemkens, M. D.; Jackson-Fisher, A.; Jalaie, M.; Johnson, T. O.; Kania, R. S.; Kephart, S.; Lafontaine, J.; Lunney, B.; Liu, K. K. C.; Liu, Z.; Matthews, J.; Nagata, A.; Niessen, S.; Ornelas, M. A.; Orr, S. T. M.; Pairish, M.; Planken, S.; Ren, S.; Richter, D.; Ryan, K.; Sach, N.; Shen, H.; Smeal, T.; Solowiej, J.; Sutton, S.; Tran, K.; Tseng, E.; Vernier, W.; Walls, M.; Wang, S.; Weinrich, S. L.; Xin, S.; Xu, H.; Yin, M. J.; Zientek, M.; Zhou, R.; Kath, J. C.; J. Med. Chem. 2016, 55, 2005. [Crossref]
» Crossref -
18 Morris, G. M.; Huey, R.; Lindstrom, W.; Sanner, M. F.; Belew, R. K.; Goodsell, D. S.; Olson, A. J.; J. Comput. Chem. 2009, 30, 2785. [Crossref]
» Crossref -
19 Baul, T. S. B.; Hlychho, B.; Das Pramanik, S. D.; Lyčka, A.; Roy, P.; Mahmoud, A. G.; da Silva, M. F. C. G.; J. Inorg. Biochem. 2024, 261, 112693. [Crossref]
» Crossref -
20 Figueroa, D.; Asaduzzaman, M.; Young, F.; J. Pharmacol. Toxicol. Methods 2018, 94, 26. [Crossref]
» Crossref -
21 Yadav, A. K.; Singh, N.; Silwal, M.; Adhikari, A.; Yadav, P. N.; Results Chem. 2024, 11, 101794. [Crossref]
» Crossref -
22 Shrestha, R. M.; Mahiya, K.; Shrestha, A.; Mohanty, S. R.; Yadav, S. K.; Yadav, P. N.; J. Mol. Struct. 2024, 1299, 136945. [Crossref]
» Crossref -
23 Abou-Melha, K. S.; J. Coord. Chem. 2008, 61, 2053. [Crossref]
» Crossref -
24 Arjunan, V.; Sakiladevi, S.; Marchewka, M. K.; Mohan, S.; Spectrochim. Acta, Part A 2013, 109, 79. [Crossref]
» Crossref -
25 Singh, N. K.; Shrestha, S.; Shashi, N.; Chaudhary, R. K.; Kumbhar, A.; Pokharel, Y. R.; Yadav, P. N.; Asian J. Chem. 2021, 33, 557. [Crossref]
» Crossref -
26 Shrestha, R. M.; Mahiya, K.; Shrestha, A.; Mohanty, S. R.; Yadav, S. K.; Yadav, P. N.; Inorg. Chem. Commun. 2024, 161, 112142. [Crossref]
» Crossref -
27 Nasr, T.; Bondock, S.; Youns, M.; Eur. J. Med. Chem. 2014, 76, 539. [Crossref]
» Crossref -
28 Varma, M.; Shravage, B.; Tayade, S.; Kumbhar, A.; Butcher, R.; Jani, V.; Sonavane, U.; Joshi, R.; Kulkarni, P. P.; J. Mol. Struct. 2021, 1235, 130265. [Crossref]
» Crossref -
29 Winata, A. W.; Rahayu, D. U. C.; Handayani, S.; Dianhar, H.; IOP Conf. Ser.: Mater. Sci. Eng. 2020, 902, 012069. [Crossref]
» Crossref -
30 Joseph, L.; Sajan, D.; Reshmy, R.; Sasi, B. S. A.; Erdogdu, Y.; Thomas, K. K.; Spectrochim. Acta, Part A 2012, 99, 234. [Crossref]
» Crossref -
31 Darla, M. M.; Krishna, B. S.; Rao, K. U.; Reddy, N. B.; Srivash, M. K.; Adeppa, K.; Sundar, C. S.; Reddy, C. S.; Misra, K.; Res. Chem. Intermed. 2015, 41, 1115. [Crossref]
» Crossref -
32 Vekariya, R. H.; Patel, K. D.; Rajani, D. P.; Rajani, S. D.; Patel, H. D.; J. Assoc. Arab Univ. Basic Appl. Sci. 2016, 23, 10. [Crossref]
» Crossref -
33 Toan, V. N.; Thanh, N. D.; Tri, N. M.; Huong, N. T. T.; Bioorg. Med. Chem. Lett. 2020, 30, 127664. [Crossref]
» Crossref -
34 Yadav, A. K.; Silwal, M.; Singh, N.; Adhikari, A.; Yadav, P. N.; Indian J. Chem. 2025, 64, 598. [Crossref]
» Crossref -
35 Geisow, M.; Biologicals 1993, 21, 125. [Crossref]
» Crossref -
36 Garribba, E.; Micera, G.; J. Chem. Educ. 2006, 83, 1229. [Crossref]
» Crossref -
37 Drouza, C.; Spanou, S.; Keramidas, A. D. In Topics From EPR Research; Maghraby, A. M., ed.; IntechOpen: London, 2018. [Crossref]
» Crossref -
38 Karabulut, B.; Düzgün, F.; Spectrochim. Acta, Part A 2010, 75, 1200. [Crossref]
» Crossref - 39 GraphPad Prism, version 9.0.0; GraphPad Software LLC, San Diego, CA, 2020.
-
40 Ahmed, A.; Lal, R. A.; Arabian J. Chem. 2017, 10, S901. [Crossref]
» Crossref -
41 Hathaway, B. J.; Billing, D. E.; Coord. Chem. Rev. 1970, 5, 143. [Crossref]
» Crossref -
42 Vurusaner, B.; Poli, G.; Basaga, H.; Free Radical Biol. Med. 2012, 52, 7. [Crossref]
» Crossref -
43 Fan, L. M.; Li, J. M.; J. Pharmacol. Toxicol. Methods 2014, 70, 40. [Crossref]
» Crossref -
44 Hefti, F. F.; BMC Neurosci. 2008, 9, S7. [Crossref]
» Crossref -
45 Lagorce, D.; Douguet, D.; Miteva, M. A.; Villoutreix, B. O.; Sci. Rep. 2017, 7, 46277. [Crossref]
» Crossref -
46 Muehlbacher, M.; Spitzer, G. M.; Liedl, K. R.; Kornhuber, J.; J. Comput.-Aided Mol. Des. 2011, 25, 1095. [Crossref]
» Crossref -
47 Nahid, N. A.; Johnson, J. A.; Expert Opin. Drug Metab. Toxicol. 2022, 18, 769. [Crossref]
» Crossref -
48 Wang, F.; Zhang, X.; Wang, Y.; Chen, Y.; Lu, H.; Ye, X.; Chen, W.; Drug Metab. Dispos. 2023, 51, 543. [Crossref]
» Crossref -
49 Fernandes, J.; Gattass, C. R.; J. Med. Chem. 2009, 52, 1214. [Crossref]
» Crossref -
50 Van de Waterbeemd, H. In Comprehensive Medicinal Chemistry II; Taylor, J. B.; Triggle, D. J., eds.; Elsevier: Amsterdam, 2007, p. 669. [Crossref]
» Crossref -
51 Tan, C. S.; Kumarakulasinghe, N. B.; Huang, Y. Q.; Ang, Y. L. E.; Choo, J. R. E.; Goh, B. C.; Soo, R. A.; Mol. Cancer 2018, 17, 29. [Crossref]
» Crossref
Edited by
-
Editor handled this article:
Giovanni Wilson Amarante (Executive)