Metabolomics-Driven Identification of Resistance Biomarkers in Dwarf Cashew (Anacardium occidentale L.) under Black Mold Stress
Abstract
This study employed an integrated untargeted metabolomics approach to identify resistance-associated biomarkers in dwarf cashew (Anacardium occidentale L.) genotypes under black mold stress-a severe foliar disease caused by Pilgeriella anacardii Arx & Müller. Metabolomic profiling was performed using ultra-performance liquid chromatography coupled with quadrupole time-of-flight mass spectrometry (UPLC-QTOF-MSE) and nuclear magnetic resonance (NMR) spectroscopy. This methodology enabled a comprehensive analysis of four dwarf cashew genotypes with varying resistance to P. anacardii: ‘CCP 76’ and ‘BRS 189’ were susceptible, ‘BRS 226’ was intermediate, and ‘BRS 265’ was resistant. Orthogonal partial least squares discriminant analysis (OPLS-DA) revealed clear metabolic segregation between resistant, susceptible, and intermediate genotypes, with high predictive power (R2Y ≥ 0.98; Q2 ≥ 0.95). Resistant clones (BRS 265 and BRS 226) showed pronounced metabolic reprogramming, marked by increased accumulation of flavonoid glycosides (quercetin-3-D-glucoside, isoquercetin), flavan-3-ols ((+)-catechin, gallocatechin), galloylated glucose derivatives (pentaand tetra-O-galloyl-glucosides), and biflavonoids (amentoflavone, agathisflavone). These compounds function as antioxidants, membrane disruptors, metal chelators, enzyme inhibitors, and immune response modulators. Pathway enrichment analysis highlighted the activation of flavonoid and flavonol biosynthesis as central to resistance. Elevated sucrose levels in resistant genotypes suggest a role in energy supply and systemic signaling. Altogether, this metabolomic fingerprint supports a complex biochemical defense strategy and offers robust biomarkers for marker-assisted selection.
Keywords:
metabolomics; mass spectrometry; nuclear magnetic resonance; cashew farming; phytopathology
Introduction
The cashew tree (Anacardium occidentale L.) is a species indigenous to Brazil, belonging to the Anacardiaceae family.1 Widely cultivated across all regions of Brazil, the largest plantations are concentrated in the Northeast, where the semi-arid climate favors its growth.2 Cashew farming has become a crucial contributor to the economy of Brazil, generating employment and income during the off seasons of staple crops like beans and corn,2 while also enhancing food security for local communities. Beyond its economic impact, the cashew tree holds significant cultural value, featuring prominently in regional festivals and traditional culinary practices.1
Cashew has considerable commercial relevance due to its derived products, such as almonds, cashew nut liquid (LCC) and the peduncle sold in natura form, concentrated juices, sweets, cashew and animal feed.3 In 2022, the Brazilian Institute of Geography and Statistics (IBGE)4 reported that the production value of cashew nuts reached R$ 588.963.00, with the State of Ceará emerging as the largest producer, yielding 95.714 tons.
However, the cultivation of dwarf cashew trees faces significant threats from various diseases, including powdery mildew (Erysiphe quercicola),3 anthracnose (Colletotrichum spp.),5 black mold (Pilgeriella anacardii Arx & Muller),6 and resinous rot (Lasiodiplodia theobromae).5 Black mold is of great concern as cashew trees are its sole known host.5 This disease is prevalent along the northeastern coast of Brazil, exacerbated by the expansion of dwarf cashew cultivation in areas more susceptible to infection.6 Symptoms include black and brown spots on the undersides of leaves, and in highly susceptible clones, premature leaf drop can occur.5 The disease cycle typically begins with the onset of the rainy season, reaching its peak towards the end.3 The impact of these diseases on productivity and fruit quality can be substantial, affecting not only the local economy but also the livelihoods of farmers.5
The incidence of black mold in dwarf cashew trees (Anacardium occidentale L.), primarily caused by the fungus Pilgeriella anacardii and related species, is intensified during the rainy season, a period in which high humidity creates favorable conditions for pathogen development and spread. Meteorological data for the Metropolitan Region of Fortaleza (MRF) show a progressive increase in rainfall from February to April 2019: approximately 100-150 mm in January, 150 200 mm in February, 200-250 mm in March, and 250-300 mm in April, indicating an environment highly conducive to infection and disease progression.7
Studies conducted by Cardoso and co-workers5 confirm that fungal diseases such as black mold exhibit greater severity and spread during the rainy season, affecting vegetative growth and productivity of commercial cashew clones, including dwarf genotypes widely cultivated in Ceará. Additionally, morphological evidence of Pseudoidium anacardii, another fungus associated with foliar diseases in cashew, reveals intensified growth on leaves and inflorescences under high humidity, suggesting a similar pattern of sensitivity to climatic conditions.
This study aims to investigate the metabolic profile of different dwarf cashew clones (‘CCP 76’, ‘BRS 189’, ‘BRS 226’, ‘BRS 265’) under conditions of biotic stress caused by black mold, using ultra-performance liquid chromatography coupled with quadrupole time-of-flight mass spectrometry (UPLC-QTOF-MSE) and nuclear magnetic resonance (NMR) spectroscopy, focusing on the identification of specific compounds that can act as biomarkers of defense against P. anacardii. The literature shows that the technique of UPLC-QTOF-MSE and NMR spectroscopy has been widely used in the elucidation of components of plant metabolites.8-10 Through UPLC-QTOF-MSE, it can be determined the metabolic profile of cashew apple extracts at different maturation stages, demonstrating the effectiveness of this method in the identification of phenolic compounds and their biosynthetic pathways. Similarly, Alves Filho et al.11 applied integrated NMR and UPLC-QTOF-MSE approaches to analyze the metabolic variability of cashew seeds, highlighting anacardic acids as potential markers associated with higher germination vigor, indicating their role in stress response mechanisms.
In their work, Kumar et al.12 identified the metabolomic profile of Entada phaseoloides using UPLC-QTOF-MSE combined with NMR for comprehensive structural elucidation of saponins. The literature also shows that the structural elucidation of metabolites, made by NMR, obtained excellent results, especially when combined with UPLC-QTOF-MSE, as demonstrated by Noleto Dias et al.13 in their comprehensive metabolomic study of Clusia minor organs.
To obtain dwarf cashew clones with greater resistance to the impacts caused by phytopathology’s, metabolomic studies have been used to identify biomarkers of resistance to biotic stress.8,14,15 Biomarkers are chemical structures that can be analyzed experimentally and indicate the occurrence of normal or pathological functions of a living organism.16
The literature16,17 reports the secondary metabolites that are present in plants of the Anacardiaceae family, such as organic acids, flavonoids, glycosylated flavonoids, tannins and anacardic acids. Studies17 show that these metabolites are associated with plant physiology, performing functions of growth, reproduction and protection against pathogen attacks.
It is hoped that the results of this research will provide valuable information on the metabolic adaptations of dwarf cashew genotypes, contributing to the selection and improvement of resilient cultivars that can withstand biotic stress and increase the sustainability of cashew crops.
Experimental
Reagents and solutions
All chemicals and solvents were sourced as follows: ultrapure water (18.2 MΩ cm resistivity) was prepared using a Millipore Milli-Q® purification system (Billerica, MA, USA). LC-MS grade acetonitrile and high-performance liquid chromatography (HPLC)-grade hexane (≥ 95% purity) were obtained from Tedia Co. (Fairfield, OH, USA), while ethanol (96% purity) and formic acid (98% purity, LC-MS grade) were acquired from Tedia Brazil (Rio de Janeiro, RJ, Brazil). Chromatographic-grade methanol (LC-MS grade, ≥ 99.9% purity) and acetonitrile were supplied by Merck KGaA (Darmstadt, Germany). Deuterated reagents for NMR analyses, including methanol-d4 (99.9% D), deuterium oxide (D2O, 99.9% D), dimethyl sulfoxide-d6 (DMSO-d6, 99.9% D), and sodium-3-trimethylsilylpropionate-d4 (TMSP-d4, 98% D), were procured from Cambridge Isotope Laboratories (Tewksbury, MA, USA). The internal standard, 9-anthracenecarboxylic acid (≥ 98% purity), was purchased from Sigma-Aldrich (St. Louis, MO, USA).
Plant materials
Leaves of dwarf cashew (Anacardium occidentale L.) clones ‘CCP 76’, ‘BRS 189’, ‘BRS 226’ and ‘BRS 265’ were collected from an experimental field managed by Embrapa Agroindústria Tropical in Pacajus, Ceará, Brazil (geographic coordinates: 4°10’S, 38°27’W; altitude: 60 m above sea level). Sampling was conducted during the peak incidence of black mold (February-April 2019), coinciding with the highest rainfall period in the region. No agrochemicals with potential activity against black mold were applied in the area. To maintain unambiguous traceability of all samples, and document environmental conditions during collection, we recorded a unique code for each biological replicate and extracted contemporaneous meteorological data (daily rainfall, mean temperature, and relative humidity) for the sampling window. These variables are compiled in Table 1 alongside the sample codes. The table enables explicit consideration of weather as a potential confounder, supports reproducibility and cross-season comparisons, and provides the environmental context used to interpret genotype-specific metabolomic patterns.
Climatic parameters and seasonal conditions recorded during the sample collection period of the four clones of A. occidentale L. (‘CCP 76’, ‘BRS 189’, ‘BRS 226’ and ‘BRS 265’), including the average monthly temperature, the average monthly rainfall and the corresponding season of the year
To ensure representative sampling, four leaves were collected from each quadrant of the canopy per plant (16 leaves per plant). Biological quintuplicates (five plants per clone) were processed, yielding a total of 60 samples. Immediately after collection, leaves were wrapped in aluminum foil, flash-frozen in liquid nitrogen (N2) to halt metabolic activity and transported in insulated polystyrene containers. Samples were subsequently dried in a forced-air circulation oven at 40 °C for 72 h. Dried leaves were homogenized using a mechanical grinder.
Sample preparation
Sample preparation for NMR analysis
Ethanol-soluble metabolites were extracted from dwarf cashew leaves using a biphasic solvent system. Briefly, 500 mg of lyophilized leaf powder (pooled from five biological replicates, 100 mg each) were combined with 8 mL of 70% (v/v) ethanol in a glass centrifuge tube. The mixture was vortex-mixed (1 min) and sonicated (20 min, 25 °C) to facilitate metabolite dissolution. A 4 mL aliquot of hexane (HPLC grade) were then added, and the solution was vigorously agitated (1 min) followed by centrifugation (3.000 rpm, 10 min, 25 °C) to separate polar (ethanol/water) and nonpolar (hexane) phases.
The ethanolic phase was carefully aspirated using a Pasteur pipette, transferred to a sterile glass vial, and concentrated to dryness under reduced pressure using a SpeedVac™ concentrator (Thermo Fisher Scientific, Waltham, MA, USA) at 30 °C for 5 h. The dried extract (10 mg) was reconstituted in 600 μL of deuterated dimethyl sulfoxide (DMSO-d6, 99.9% D; Cambridge Isotope Laboratories, Tewksbury, MA, USA), homogenized by vortexing (30 s), and filtered through a 0.20 μm polytetrafluoroethylene (PTFE) membrane. The resulting solution was transferred to a 5 mm NMR tube (Wilmad-LabGlass, Vineland, NJ, USA) for analysis.
Sample preparation for UPLC-QTOF-MSE analysis
Metabolite extraction was carried out via a biphasic solvent system modified from established protocols.15,18 Dried leaf powder (50 mg) from each clone was suspended in 4 mL HPLC-grade hexane within sealed 10 mL glass vials. The mixture was homogenized by vortexing (1 min) and ultrasonication (20 min), followed by sequential addition of 4 mL ethanol/water (7:3, v/v) and repetition of homogenization steps. Phase separation was achieved by centrifugation (3.000 rpm, 1,006 × g, 10 min).
The polar (ethanol/water) phase was aspirated, and 1.800 μL aliquots were spiked with 200 μL 9-anthracenecarboxylic acid (internal standard, 100 mg L-1). Solutions were filtered through 0.20 μm hydrophilic PTFE membranes into pre-labeled autosampler vials and stored at -20 °C until analysis. To ensure the robustness of the results, a total of 77 injections were performed. Of this amount, 60 were biological samples (from 4 clones, with 5 biological replicates for each clone and 3 distinct collection periods). The remaining 17 injections were composed of 11 blanks and 6 quality control (QC).
Analytical techniques
NMR analysis conditions
The NMR spectra were obtained in an Agilent 600 MHz spectrometer equipped with a 5 mm (1H 9F/15N 31P) inverse sensing One Probe™ with actively shielded Z-gradient. The 1H NMR analyses were performed under quantitative parameters: strong pulse calibrated at 90° (8.20 μs); acquisition time of 1.704 s and relaxation delay of 1.00 s; and fixed receiver gain value of 30 for all acquisitions to receive the signals at the same amplitude; temperature controlled at 298 K. The spectra were processed and analyzed using Mnova software (v12.0, Mestrelab Research S.L., Santiago de Compostela, Spain). Chemical shifts are reported in parts per million (ppm, δ) relative to DMSO-d6, with residual solvent peaks at δ 1H 2.50 ppm for protons and δ 13C 39.52 ppm for carbons. The spectra were processed by applying exponential multiplication to the FID (free induction decay) with a factor of 0.3 Hz and performing a Fourier transform with 16k points. Manual phase correction was applied, followed by baseline correction across the entire spectral range. The identification of constituents was performed using one-dimensional and two-dimensional NMR experiments, following standard pulse sequences from the library of the spectrometer, as previously demonstrated.18 Experimental details of 2D NMR are provided in the Supplementary Information section.
UPLC analytical conditions
Chromatographic analyses were performed on an ACQUITY UPLC™ system (Waters Corporation, USA) equipped with a binary solvent manager and an autosampler. Plant extract aliquots (5 μL) were injected at 20 °C onto an ACQUITY UPLC BEH C18 column (150 mm × 2.1 mm, 1.7 μm; Waters®) maintained at 40 °C. The mobile phase consisted of (A) ultrapure water containing 0.1% (v/v) formic acid and (B) acetonitrile with 0.1% (v/v) formic acid. A linear gradient elution was applied as follows: 2% B for 0-1 min, ramped to 95% B from 1-20 min, and then held for 2 min at 2% B to re-equilibrate the column. The flow rate was 400 μL min-1, and the injection volume was 5 μL. All samples, including blanks, were injected three times in a randomized order.
Mass spectrometry (ESI-QTof-MSE) analytical conditions
Mass spectrometric detection was performed on a Xevo™ QTof-MS instrument (Waters Corporation, USA), equipped with a ZSpray™ source operating in negative electrospray ionization (ESI-) mode. Data were acquired in the mass range of 100-1100 Da with a scan time of 0.25 s, configured for MSE Centroid mode. Collision energy was set to 6 V for MS1, while MS2 used a ramp from 20 to 40 V. Operating parameters included a capillary voltage of 2.6 kV, a sampling cone voltage of 35 V, a source temperature of 150 °C, and an extraction cone voltage of 1.5 V.
High-purity nitrogen, supplied by an NM30LA-MS generator (Peak Scientific Instrument™, Scotland), served as the cone and desolvation gas at 350 °C and 500 L h-1, respectively. Argon (≥ 99.9% purity, White Martins, Brazil) was used as the collision gas at 1.3 × 10⁻² mbar. Mass accuracy was ensured through continuous leucine-enkephalin infusion (400 ng mL-1, [M - H]- m/z 554.2615) into the LockSpray system at 20 μL min-1 every 20 s. The instrument was calibrated using a sodium formate solution, and data acquisition and processing were performed with MassLynx™ 4.1 software (Waters Corporation, USA). Quercetin-3-O-rhamnoside (tR = 5.64 min; [M - H - Rha]- m/z 301.0348) was used as an external control standard, injected every ten samples.
The identification of compounds in leaf extracts was performed based on the five confidence levels proposed by Blaženović et al.19 for LC-MS-based metabolomic studies. A total of 38 metabolites were annotated, classified into different confidence levels according to their structural confirmation.
UPLC-QTOF-MSE data processing
Data processing was performed using Progenesis QI software v.2.1 (NonLinear Dynamics, Waters) with the following parameters: automatic alignment of all runs, centroid mode, peak resolution set at 10,000 Full Width at Half Maximum (FWHM), and negative electrospray ionization. Metabolite identification was based on comparison with analytical standards and database queries, considering accurate mass, isotopic pattern, retention time, and MS/MS fragmentation. Annotation was conducted using MetaScope with a customized polyphenol database from PubChem20 and complementary metabolites from Chemspider,21 MoNA,22 KEGG23 and NuBBE DB For untargeted identification, the following criteria were applied: precursor and fragment mass error < 5 ppm, isotopic pattern match > 90%, identification score > 50%, and highest fragmentation score > 90%. Only metabolites detected consistently in all biological replicates (5/5) with a coefficient of variation (CV) < 30% were retained as putatively annotated.
Chemometric analysis of UPLC-QTOF-MSE data
Chemometric analysis was employed to evaluate metabolite variability in ethanolic leaf extracts of four dwarf cashew genotypes (CCP 76 susceptible, BRS 189 susceptible, BRS 226 intermediate and BRS 265 resistant) exhibiting distinct resistance profiles to black mold.
Data processing and multivariate analysis were performed using EZInfo software (version 12.0; Umetrics, Umeå, Sweden).24 An initial unsupervised principal component analysis (PCA) with Pareto scaling was employed to explore inherent variability, assess sample distribution, and detect natural clustering patterns within the dataset.
To enhance group separation and extract class-discriminative features, orthogonal partial least squares-discriminant analysis (OPLS-DA) was subsequently applied. This supervised method isolates variation in the predictor matrix (X, metabolites) that is orthogonal to the response matrix (Y, categorical groups), thereby improving the interpretability and robustness of the models.25,26
Model validity was rigorously assessed using a combination of 7-fold cross-validation and permutation testing. The Hotelling’s T2 statistic, represented as 95% confidence ellipses in the score plots, was used to visualize model reliability and detect potential outliers. Model performance was evaluated through the R2X and Q2 metrics, where R2X represents the explained variance (goodness of fit) and Q2 indicates the predictive capability (model robustness).
Key discriminant metabolites were identified based on a combination of S-Plots-highlighting variables by retention time (tR) and mass-to-charge ratio (m/z)-alongside variable importance in projection (VIP > 1.0) and univariate statistical significance (p-value < 0.05). Loading and coefficient plots further facilitated biological interpretation by representing variable correlations contributing to class separation.
Statistical analysis
Results are reported as mean ± standard deviation from at least three independent experiments. Statistical significance was determined using SPSS software27 via Student’s t-test, with p-value < 0.05 deemed significant. Additionally, the OPLS-DA model validation parameters (goodness-of-fit R2Y, together with goodness-of-prediction Q2Y) were checked, considering a Q2Y prediction ability of > 0.5 as the acceptability threshold. Thereafter, the OPLS-DA model was checked for outliers, CV-ANOVA p-value threshold < 0.05 for model significance, and a permutation testing (N > 200) was performed to exclude model overfitting.25,26 The permutation plot shows the correlation coefficient between the original Y-variable and the permuted Y-variable on the X-axis versus the cumulative R2 and Q2 on the Y-axis, and then originates a regression curve, where the intercept is the measure of the overfitting.
Metabolic pathway analysis
Metabolic pathway analysis was performed using MetaboAnalyst 6.028 with the KEGG pathway library as reference. Since Anacardium occidentale lacks curated pathway annotation in KEGG, Hevea brasiliensis was selected as the reference model due to phylogenetic proximity (both within the Malvid clade), ecological similarity, and comparable profiles of secondary metabolism, particularly flavonoids, terpenoids, and phenolic compounds relevant to plant defense. Pathway enrichment was carried out using the hypergeometric test, appropriate for over-representation analysis of discrete metabolite sets. Topological analysis employed the relative-betweenness centrality algorithm to prioritize metabolites with greater influence in network connectivity. Multiple testing correction was applied using the False Discovery Rate (FDR) method. Significance thresholds were set at FDR ≤ 0.05 for statistical confidence and impact values ≥ 0.1 to ensure biological relevance. This workflow ensured robust interpretation of the metabolic alterations associated with resistance to P. anacardii in A. occidentale, providing biologically meaningful and statistically reliable pathway insights.
Results and Discussion
Integrated multimodal analytical strategy reveals chemical diversity and resistance-related metabolite signatures in Anacardium occidentale leaves under black mold stress
To elucidate the chemical complexity of cashew (Anacardium occidentale L., Anacardiaceae) leaf extracts, an integrated analytical workflow combining UPLC QTOF-MSE and 1H NMR spectroscopy (1D and 2D experiments) was implemented. This multimodal approach synergizes high-resolution mass spectral data with NMR-derived structural insights, enabling robust metabolite annotation and enhancing the reproducibility of compound identification in intricate botanical matrices.
Phytochemical profiling was conducted on four genetically distinct cashew leaf clones (BRS 189, BRS 226, BRS 265 and CCP 76) utilizing UPLC-QTOF-MSE in negative ionization mode and 1H NMR analysis. The orthogonal integration of datasets from these platforms provided complementary structural evidence, enabling comprehensive annotation of primary metabolites (e.g., carbohydrates, amino acids) and specialized secondary metabolites, including phenolic acids, flavonoids, and alkylphenols (see Table 2). UPLC-QTOF-MSE analysis further resolved 32 major phytochemical constituents, with detailed annotations (e.g., accurate mass, fragmentation patterns, putative annotations) summarized in Table 2. Notably, the combined analytical strategy revealed a pronounced chemical diversity across clones, underscoring the metabolic plasticity of A. occidentale.
Annotation of phytochemical constituents in Anacardium occidentale L. (Anacardiaceae) leaf ethanol extracts via UPLC-QTOF-MSE analysis in negative ionization mode. Annotations were supported by high-resolution MS/MS spectral data (MSE mode), isotopic pattern accuracy (< 10 ppm mass error), and fragmentation pattern alignment with reference database Progenesis QI and others (e.g., KNAPSACK, Scifinder, and PubChem). Chemical class categorizes compounds with putative identities ranked by spectral match confidence (level 1-4)21
These findings highlight the efficacy of integrating UPLC-QTOF-MSE and NMR for untargeted metabolomics in plant systems, offering a reproducible framework for elucidating complex phytochemical profiles in agronomically significant species.
1D and 2D NMR analysis
Accurate metabolite identification in cashew leaf extracts using multidimensional NMR spectroscopy
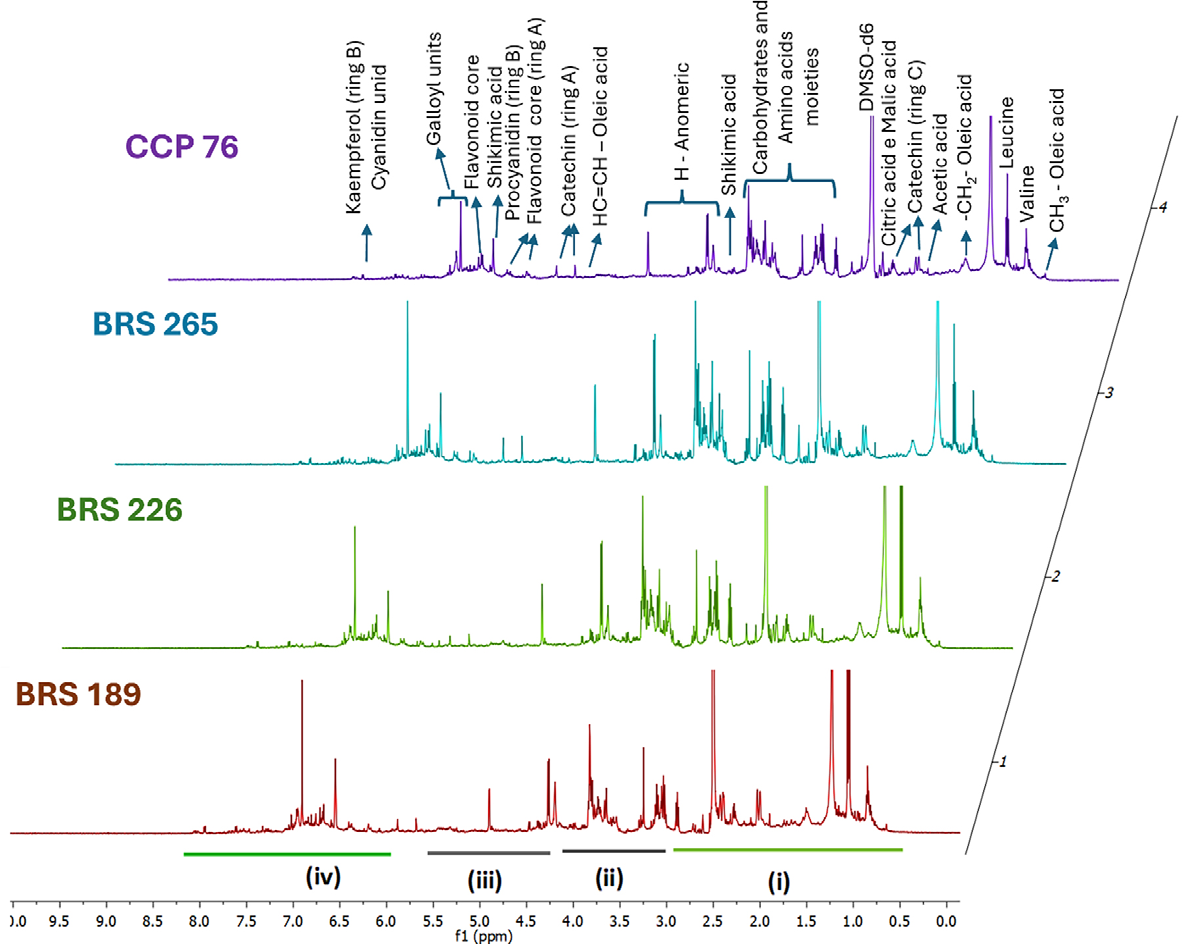
Accurate identification of metabolites in complex biological samples is a cornerstone of metabolomic research. One-dimensional proton nuclear magnetic resonance (1H NMR) spectroscopy is widely used for metabolite profiling in plant extracts.6 However, in cashew (Anacardium occidentale L.) leaf extracts, significant spectral overlap, as observed in representative 1H NMR spectra (Figure 1), limits unambiguous signal assignment, consistent with challenges reported for complex plant matrices.38 To address this, a suite of two-dimensional (2D) NMR experiments, including 1H-1H correlation spectroscopy (COSY), 1H-13C heteronuclear single quantum coherence (HSQC), and 1H-13C heteronuclear multiple bond correlation (HMBC), was employed. These techniques facilitated precise proton and carbon signal assignments through homonuclear and heteronuclear correlations, significantly enhancing metabolite annotation accuracy.
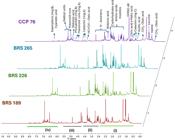
1H NMR spectrum (600 MHz) in DMSO-d6 at 25 °C fingerprints of cashew leave extracts from clones CCP 76, BRS 265, BRS 226, and BRS 189 at 298 K in DMSO-d6. The spectra were divided into four regions: (i) δ 1H 0.5-2.9 ppm, (ii) δ 1H 3.0-4.0 ppm, (iii) δ 1H4.1-5.6 ppm, and (iv) δ 1H 6.0-8.5 ppm.
The 1H NMR spectra of cashew leaf extracts revealed distinct metabolite classes, with aliphatic hydrogen signals at δ 1H 0.5-2.9 ppm, carbinolic hydrogen signals at δ 1H 3.0 4.0 ppm, anomeric hydrogen signals at δ 1H 4.1 5.6 ppm, and aromatic hydrogen signals at δ 1H 6.0 8.5 ppm. The integration of 2D NMR experiments, shown in Figures S1a and S1b (Supplementary Information (SI) section), provided complementary structural information, enabling robust metabolite identification. This approach was further supported by referencing spectral databases, including the Spectral Database for Organic Compounds (SDBS)39 and the NMR discovery platform from Chemical Abstracts Service (CAS).40
The use of multidimensional NMR spectroscopy is highly recommended for structural elucidation in complex natural product extracts, as it overcomes limitations of 1D NMR and enhances metabolomic analysis. This comprehensive strategy ensures reliable metabolite identification, critical for advancing plant metabolomics research.
The highlighted peaks in Figure 1 were observed to correspond to specific proton chemical shift values (δH) in DMSO-d6, as follows: oleic acid (δ 1H 1H 0.89, 1.23/1.42, and 5.32 ppm for CH3-, -CH2-, and HC=CH lipid, respectively), valine (δ 1H 1H 0.95 and 0.99 ppm for γ-CH3 and γ’-CH3), alanine (δ 1H 1.03 ppm for β-CH3), acetic acid (δ 1H 1H 1.90 ppm for CH3COO-), glutamate (δ 1H 2.03 ppm for β-CH3), citric acid (δ 1H 2.53 and 2.72 ppm for diastereotopic protons -CH2-), malic acid (δ 1H 4.27 ppm for α-CH), and shikimic acid (δ 1H 4.19 ppm for the methylene group and δ 1H 6.55 ppm for the vinyl protons (C=CH) in the cyclic α,β-unsaturated system). The meta-coupled doublets around δ 1H 5.78 ppm were attributed to the aromatic protons H-6 and H-8 at 5.88 ppm (d, J 2.3 Hz) and 5.69 ppm (d, J 2.3 Hz) of the catechin ring A18 which were confirmed by comparison with an analytical standard. Additionally, the flavonol core of quercetin and kaempferol was found to exhibit signals at δ 1H 6.19 and 6.40 ppm (ring A), consistent with previously reported data in the literature.41,42
Details of these metabolites, including their molecular structures, 1H and 13C chemical shifts, multiplicities, and coupling constants, are summarized in Table S1, SI section. Most compounds identified by NMR have also been detected previously using mass spectrometry, as shown in Table 2, and are commonly observed in cashew species.29
The 1H and 13C NMR data for compounds 24 (quercetin), 25 (quercetin-3-(6-O-galloyl)-glycoside), 30 (quercetin-3 O-rhamnoside), 28 (kaempferol-3-O-glycoside), and 29 (kaempferol) showed chemical shifts characteristic of flavonols. Comprehensive structural assignments for each compound were achieved by integrating UPLC-QTOF-MSE with 1D and 2D NMR experiments, and the resulting data were fully consistent with the proposed structures (Figures S1a-S1b; Table S1; SI section).
Furthermore, the fragmentation pattern observed in the MS/MS study was also crucial for the determination of the aglycone moiety coupled to the carbohydrate moieties (see mass spectrometry data in Table 2). For example, the fragmentation patterns observed were characteristic of these compounds, specifically involving rhamnosyl (146 Da) and glucosyl (162 Da) groups. For instance, the mass spectra of compound 30, quercetin-3-O-rhamnoside, revealed a deprotonated ion m/z 447.0927 [M - H]-, with the MS/MS spectra showing a prominent fragment ion at m/z 301.0315.8 This fragmentation pattern indicates the loss of a rhamnosyl moiety, as evidenced by the mass difference (∆m/z: 447 - 146 = 301). Similarly, for compound 28 (kaempferol-3-O-glycoside), the observed mass loss corresponded to a glucosyl portion (∆m/z: 447 - 162 = 285 [kaempferol - 1]-), which is also consistent with previously reported data.8 In the case of compound 25 (m/z 615.0959), the loss of 152 and 162 Da in the MS spectra suggested the presence of both galloyl and glucosyl units.31 These data, combined with the 1D and 2D NMR information (Table S1, SI section) and the mass spectrometry data (Table 2), were essential for confirming the presence of these secondary metabolites in the leaf’s samples of the analyzed clones.
The 1H NMR spectra of the clones exhibited significant signal overlaps in the aromatic, carbinolic, and aliphatic regions (Figure 1), which limited the structural analysis. To address this challenge, the 1H-1H COSY contour map showed in Figure S1a (SI section) and Table S1 (SI section) was thoroughly analyzed to identify protons that effectively couple with one another. The COSY experiment provided frequency coordinates for the peaks, accurately reflecting the chemical shifts of the coupled spins. This analysis was improved by an edited 1H-13C HSQC experiment.43 This analysis was enhanced by edited 1H-13C HSQC experiments,44 which differentiate proton signals directly in HSQC spectra due to phase differences among proton groups, such as methyl, methine, and methylene groups Figure S1b (SI section).
The analysis of the 1H-1H COSY contour map revealed coupling between neighboring protons belonging to the same spin system in amino acids, cyclohexenecarboxylic acid, flavonol, and flavanol derivatives. For instance, as highlighted in Figure S1a (SI section), this analysis enabled a clear differentiation of the signals from shikimic acid, specifically identifying the methylene group at δ 1H 4.19 ppm and the vinyl protons at δ 1H 6.55 ppm within the cyclic α,β-unsaturated system. Additionally, signals corresponding to kaempferol’s ring B were detected at δ 1H 7.96 and 6.98 ppm.
We identified and annotated 12 compounds by integrating NMR and UPLC-QTOF-MSE, while an additional 39 metabolites were detected by UPLC alone. For metabolites not resolved by mass spectrometry, identity was confirmed by comparison with analytical standards (e.g., amino acids and acetic acid). This orthogonal workflow is critical for robust metabolite characterization: NMR affords unambiguous structural information, whereas UPLC-QTOF-MSE provides high sensitivity and broad coverage. The combined evidence minimizes false positives and increases confidence in assignments.45 Thereby strengthening the metabolic annotation of clone extracts in DMSO-d6. To our knowledge, this is the first metabolomic investigation of cashew clones conducted in DMSO-d6, establishing a reference for future studies.
1H NMR-based metabolic profiling of Anacardium occidentale leaf extracts under black mold stress
The 1H NMR-based metabolic fingerprints of leaf extracts from four dwarf cashew genotypes, BRS 265 (resistant), CCP 76 (susceptible 1), BRS 189 (susceptible 2), and BRS 226 (intermediate), revealed pronounced differences in the composition and abundance of specialized metabolites under black mold stress (Figure 1). The spectra were divided into four characteristic regions: (i) δ 1H 0.5 2.9 ppm (aliphatic region), (ii) δ 1H 3.0 4.0 ppm (hydroxylated aliphatic region), (iii) δ 1H 4.1-5.6 ppm (anomeric and olefinic region), and (iv) δ 1H 6.0-8.5 ppm (aromatic region), each representing distinct metabolite classes.
The aromatic region (δ 1H 6.0-8.5 ppm) was particularly informative in distinguishing the resistant BRS 265 from the susceptible genotypes. BRS 265 exhibited an enriched and highly resolved set of signals between δ 1H 6.2 and 7.8 ppm, indicative of a diversified and elevated pool of phenolic compounds. Resonances corresponding to kaempferol derivatives (δ 1H ca. 6.4-6.7 ppm) and quercetin derivatives (δ 1H ca. 7.2-7.8 ppm) were significantly more intense in ‘BRS 265’ compared to ‘CCP 76’ and ‘BRS 189’. This polyphenolic enrichment likely reflects an adaptive biochemical strategy, given the well-documented antifungal, antioxidant, and signaling functions of flavonoids in plant defense mechanisms.
In contrast, the susceptible genotypes ‘CCP 76’ and ‘BRS 189’ showed markedly reduced intensity and complexity in this region, indicating a lower capacity for the biosynthesis or accumulation of phenylpropanoid-derived compounds under black mold stress. The intermediate genotype ‘BRS 226’ presented an aromatic profile qualitatively similar to ‘BRS 265’ but quantitatively attenuated, suggesting partial deployment of defense-associated metabolic pathways.
The ‘BRS 265’ clone also demonstrated a distinct metabolic signature in the hydroxylated aliphatic region, with prominent resonances around δ 1H 3.2-3.9 ppm. These signals are characteristic of hydroxymethine and hydroxymethylene protons from glycosylated flavonoids, phenolic glycosides, and osmoprotective carbohydrates. The intense signals in ‘BRS 265’, compared to lower responses in ‘CCP 76’ and ‘BRS 189’, underscore an enhanced glycosylation activity, which may serve dual protective roles, improving metabolite stability and modulating bioactivity against pathogenic invasion.
Anomeric signals around δ 1H 4.5-5.4 ppm were noticeably more abundant in BRS 265, suggesting a higher presence of glycosylated secondary metabolites and free soluble sugars. Such metabolites are frequently associated with plant defense, acting both as signaling molecules and structural barriers that limit pathogen spread. Notably, while ‘CCP 76’ showed certain anomeric signals, their intensity was significantly lower, correlating with its susceptible phenotype.
A clear inverse relationship was observed in the aliphatic region. ‘BRS 189’, the most susceptible genotype, exhibited the highest concentration of aliphatic signals, particularly at δ 1H ca. 0.85, 1.25, and 2.1 ppm, corresponding to saturated fatty acids and triterpenes. This lipophilic dominance is often linked to baseline metabolic functions rather than induced defense responses. In contrast, ‘BRS 265’ displayed a comparatively reduced aliphatic profile, reflecting a metabolic shift from primary lipid biosynthesis toward secondary metabolite production under stress. The collective NMR evidence highlights that the metabolic phenotype of ‘BRS 265’ is characterized by: polyphenol enrichment, especially flavonoids (kaempferol and quercetin derivatives) enhanced glycosylation, reflected in both hydroxylated and anomeric regions; reduced lipophilic metabolite dominance, suggesting a shift towards defensive specialization.
This contrasts sharply with ‘CCP 76’ and ‘BRS 189’, whose metabolic fingerprints are skewed towards lower aromatic content and higher aliphatic signals, correlating with their susceptible phenotypes. The intermediate profile of ‘BRS 226’ suggests partial deployment of defense strategies but is insufficient to reach the metabolic robustness observed in ‘BRS 265’.
These findings are consistent with the hypothesis that resistance in ‘BRS 265’ involves the constitutive or induced accumulation of specialized metabolites with antifungal properties, particularly polyphenols and their glycosylated forms, which are critical for inhibiting the establishment and progression of black mold infection.
UPLC-QTOF-MSE-based metabolic profiling of Anacardium occidentale leaf extracts under black mold stress
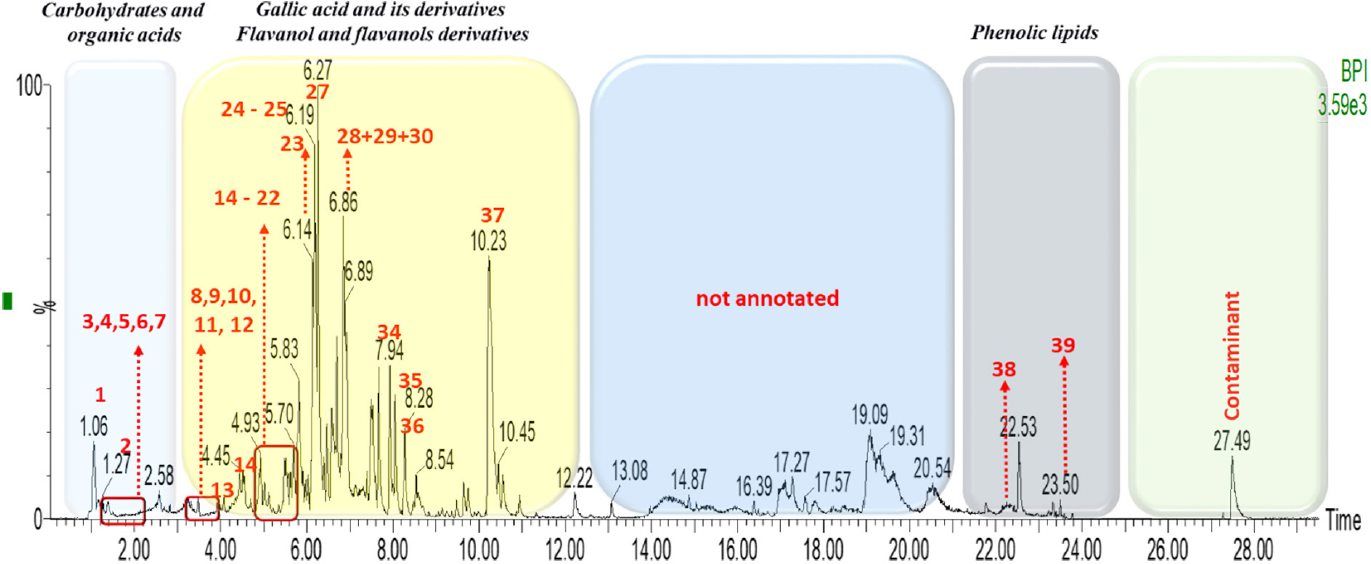
UPLC-QTOF-MSE analysis of ethanolic leaf extracts from four dwarf cashew clones (Anacardium occidentale L., Anacardiaceae) revealed a diverse array of primary and specialized metabolites. The Base Peak Intensity (BPI) chromatogram (Figure 2), acquired in negative ionization mode (ESI-), resolved distinct peaks across a retention time (tR) range of 1.0-28.0 min, with metabolites spanning a mass-to-charge (m/z) range of 110-1190. Representative BPI chromatogram was obtained from a quality control (QC) sample, composed of pooled leaf extracts of four dwarf cashew genotypes (‘CCP 76’, ‘BRS 189’, ‘BRS 226’ and ‘BRS 265’). Peaks are annotated based on retention time and grouped into major chemical classes (Table 2), including carbohydrates and organic acids, gallic acid and its derivatives, flavonoids and flavanol derivatives, phenolic lipids, and one contaminant signal. The shaded regions indicate areas of chemical specialization. Several intense signals between 12 and 22 min remain unannotated due to lack of fragmentation data or reference spectra. This chromatographic profile illustrates the wide chemical diversity present in cashew leaves and supports subsequent.
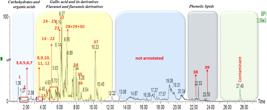
Representative base peak intensity (BPI) chromatogram (ESI- mode) of QC (Quality Control) sample from leaf extracts of four dwarf cashew genotypes (‘CCP 76’, ‘BRS 189’, ‘BRS 226’, and ‘BRS 265’), highlighting chemical classes and major compound clusters.
Carbohydrates and small organic acids
Mass spectra (MS and MS/MS) were acquired in negative ion mode to investigate the chemical composition of the cashew clones throughout the sampling period (Figure 2 and Table 2). At the early stages of the chromatographic run, carbohydrates and small organic acids were predominantly detected, consistent with previous reports.8
The first eluted compound (peak 1, tR = 1.05 min) was annotated as unknown observed in its deprotonated form at m/z 195.0505. Peak 2 (tR = 1.26 min) was annotated as sucrose, detected as the deprotonated molecule [C12H22O11 - H]- at m/z 341.1099.8 In plants, sucrose is the primary transport form of assimilated carbon during photosynthesis,46 providing both carbon skeletons and energy to non-photosynthetic tissues.
Peaks 3 and 4 corresponded to shikimic acid (tR = 1.33 min) and malic acid (tR = 1.34 min), respectively, both detected in their deprotonated forms. Malic acid exhibited a molecular ion at m/z 133.0129, while shikimic acid was observed at m/z 173.0441. Malic acid plays a critical role in enhancing plant growth by increasing chlorophyll content and protecting photosynthetic structures under stress conditions, thus promoting biomass accumulation.47 The shikimate pathway, in turn, is essential for the biosynthesis of key nutrients, including vitamins and aromatic amino acids such as phenylalanine, tyrosine, and tryptophan.48
The molecular ion [M - H]- at m/z 191.0183 (peak 5, tR = 1.36 min) was associated with citric acid. Citric acid produces the m/z 111.0078 fragment, that acid is a key intermediate in the tricarboxylic acid (TCA) cycle, vital for energy production and metabolic regulation in plants. Furthermore, citric acid contributes to nutrient uptake, storage, and acts as a signaling molecule modulating diverse physiological responses.47
Gallic acid and its derivatives
The deprotoneted ion [M - H]- at m/z 169.0117, along with a fragment ion at m/z 124.9915 ([M - H - CO2]-) resulting from CO2 loss, was assigned to gallic acid (peak 7, tR = 1.39 min), consistent with metabolites previously reported in cashew tree clones.8 Gallic acid plays several crucial roles in plants, acting as a potent antioxidant that protects cells from oxidative stress, and contributing to plant defense against pathogens and herbivores.47,49
Peaks 6, 8, 12, 15, 17, 20, and 26 were identified as glycosylated derivatives of gallic acid, tentatively annotated as 6-O-galloyl-D-glucose (tR = 1.38 min, m/z 331.0652), galloyl-shikimic acid (tR = 3.25 min, m/z 325.0527), 1,6-di-O-galloyl-D-glucose (tR = 4.09 min, m/z 483.0787), hydroxy-methoxyphenyl-O-(O-galloyl)-hexose (tR = 4.52 min, m/z 453.1032), 1,2,6-tri-O-galloyl-D-glucose (tR = 5.02 min, m/z 635.0891), 1,2,3,6-tetra-O-galloyl-D-glucopyranose (tR = 5.83 min, m/z 787.0960), and 1,2,3,4,6-penta-O-galloyl-D-glucose (tR = 6.27 min, m/z 939.1102), respectively.
The diagnostic ions observed in the mass spectrometry analysis were predominantly associated with the deprotonated gallic acid ion (m/z 169.0117) and its characteristic fragments. Additionally, the deprotonated molecular ion of shikimic acid was detected at m/z 173.0441. A consistent fragmentation pattern was observed across all galloyl derivatives, mainly driven by the loss of the sugar moiety (-179 Da). Another key fragment at m/z 162 is likely related to the loss of a dehydrated hexose unit, suggesting cleavage of a sugar fragment.
Further fragmentation yielded ions at m/z 151.0023 ([M - H - H2O]-) and m/z 125.0239 ([M - H - CO2]-), corresponding to the loss of water and carbon dioxide, respectively. These fragmentation routes indicate alternative degradation pathways for gallic acid under collision-induced dissociation.8,32
In addition, peak 35 (tR = 8.00 min) was tentatively identified as ethyl gallate based on the detection of the deprotonated molecular ion at m/z 197.0429. MS/MS fragmentation yielded ions at m/z 124.0122 and 169.0133, the latter being indicative of the gallic acid moiety.
Flavonols and flavonoid derivatives
A diverse range of flavonoid compounds, including proanthocyanidins, quercetin, myricetin, kaempferol, and catechin derivatives, has been identified in cashew leaf extracts.8,50 Quercetin, myricetin, and kaempferol derivatives are classified as flavonols, whereas catechin belongs to the flavan-3-ol subclass.51 Proanthocyanidins, also referred to as condensed tannins, represent the second most abundant class of plant polyphenols after lignin.52 These natural flavan-3-ol polymers play critical biological roles in plant defense against both biotic and abiotic stresses and contribute significantly to human health and food sensory properties.53,54 Additionally, their potential role as carbon sequestration agents highlights their relevance in climate change mitigation.
Structurally, flavonoids are composed of three rings, where the C2 position of a benzopyran core (rings A and C) is connected to a phenyl group (ring B). This molecular backbone typically undergoes fragmentation through mechanisms such as quinone methide (QM) cleavage, heterocyclic ring fission (HRF), and retro-Diels-Alder (RDA) reactions, which are key to elucidating the structural features of these compounds.8,18
For instance, catechin (peak 14, tR = 4.44 min) exhibited a deprotonated molecular ion [M - H]- at m/z 289.0716, yielding key fragments at m/z 245.0793 [M - H - 44]- due to the neutral loss of CH2=CH-OH, and at m/z 125.0236 [M - H - 165]- resulting from HRF-related heterocyclic ring cleavage.18 Similarly, peak 9 (tR = 3.31 min) was tentatively assigned to epigallocatechin or gallocatechin, based on the [M - H]- ion at m/z 305.0660. Its MS/MS spectrum revealed a characteristic fragment at m/z 125.0239 [M - H - 165]-, corresponding to HRF of ring A.54
Peak 11 was putatively annotated as a procyanidin dimer (A- or B-type) based on the precursor ion at m/z 577.1405 (tR = 3.99 min), which generated diagnostic fragments at m/z 451.1073 [M - H - 126]-, m/z 425.0892 [M - H - 152]- and m/z 407.0775 [M - H - 170]-.55,56
Epigallocatechin gallate was identified at peak 18 (tR = 5.12 min) based on a [M-H]- ion at m/z 457.0786, producing two key fragments: m/z 169.0120 [C7H6O5-H]-, corresponding to the gallic acid moiety, and m/z 305.0670 [epigallocatechin-H]-.57,58
Quercetin (peak 24) was unambiguously identified via the [M - H]- ion at m/z 301.0328 (tR = 6.19 min). Glycosylated flavonol derivatives (peaks 21, 23, 25, 27, 30, and 31) were characterized by the presence of a diagnostic aglycone fragment at m/z 301 [M - sugar]-, resulting from the neutral loss of sugar moieties, as well as other characteristic product ions listed in Table 2. These compounds consistently displayed RDA fragments at m/z 151 [1,3A]-, 121 [1,2B]-, and 107 [0,4A]-, further supporting the presence of the quercetin backbone.56
Peaks 19 and 22 were annotated as myricetin-3 O galactoside (tR = 5.49 min, m/z 479.0787) and myricetin-3-O-xyloside (tR = 6.01 min, m/z 449.0731), respectively. Their annotation is supported by a prominent fragment at m/z 316.0284, corresponding to the myricetin aglycone.56
Peak 29 (tR = 6.70 min) presented a [M - H]- ion at m/z 285.0379, consistent with the presence of kaempferol aglycone.59 Peaks 28 (tR = 6.59 min, m/z 447.0990), 32 (tR = 7.12 min, m/z 417.0816), and 33 (tR = 7.50 min, m/z 431.0959) were identified as kaempferol-3-O-glucoside, kaempferol-3-O-pentoside derivatives and kaempferol- 3 O-rhamnoside , respectively.7 In all cases, the presence of a fragment at m/z 285.0374 [kaempferol - H]- confirmed the kaempferol core. The consistent observation of this fragment under ESI-QTOF conditions is attributed to the facile cleavage of sugar moieties from glycosylated flavonoids.
Finally, peak 37 (tR = 10.23 min) was tentatively identified as amentoflavone or its isomer agathisflavone, with a [M - H]- ion at m/z 537.0887. Its MS/MS spectrum exhibited a major RDA-derived fragment at m/z 493.0877 [M - H - CO2]-, along with additional fragments at m/z 417.0593 [M - H - C7H4O2]-, m/z 375.0487 [M - H - C9H6O3]-, and m/z 117.0343 (C8H5O-), consistent with previously reported fragmentation patterns for this biflavonoid.60
Phenolic lipids
Peaks 38 and 39, detected at the end of the chromatographic run with m/z 341.2097 (anacardic acid 15:3) and 345.2427 (anacardic acid 15:1), were assigned to hydrophobic phenolic lipids. The MS/MS spectra revealed a characteristic fragment ion corresponding to [M - H - 44]-, which indicates the neutral loss of CO2 from the phenolic carboxyl group, a typical fragmentation pathway of anacardic acids.
A comprehensive list of the annotated metabolites, including their deprotonated ions [M-H]-, retention times (tR), molecular formulas, MS/MS fragments, mass errors (ppm), peak annotations, and confidence levels, is presented in Table 2.
Chemometric analysis of UPLC-QTOF-MSE data
PCA analysis
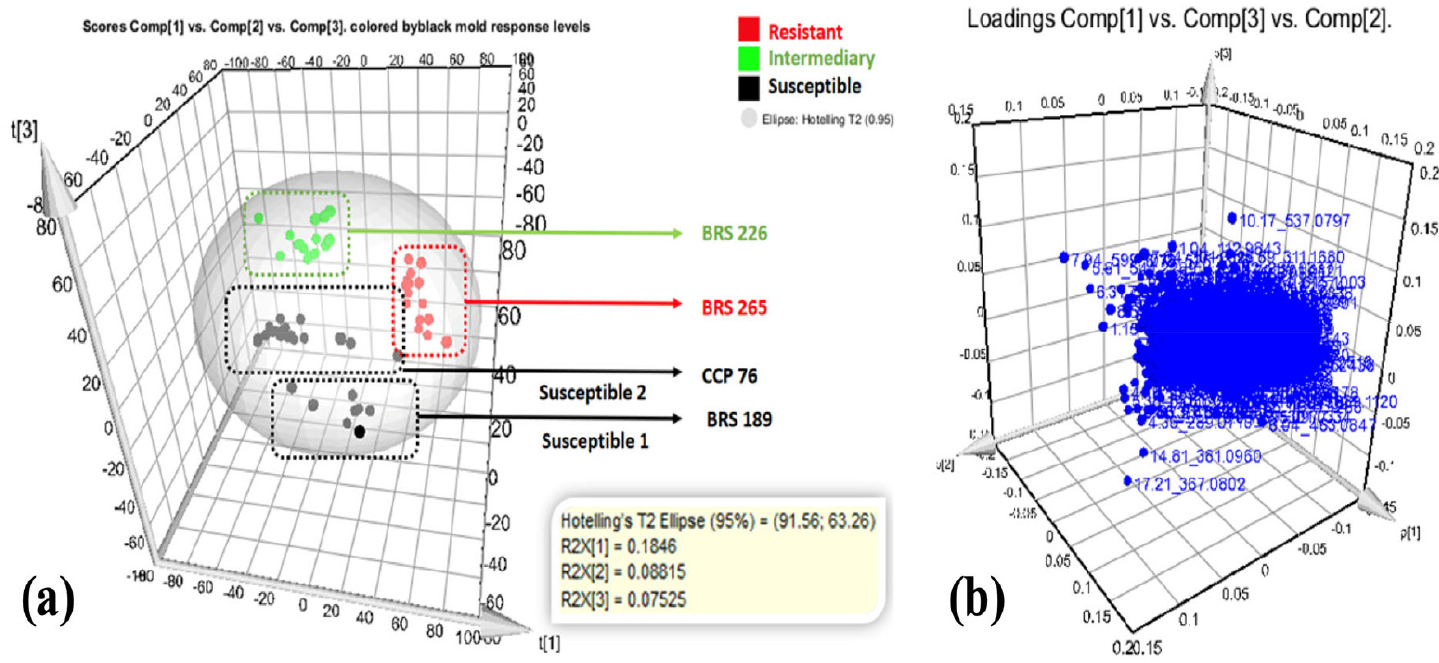
The principal component analysis (PCA) performed on the metabolomic dataset enabled clear discrimination among the cashew genotypes based on their resistance P. anacardii. The three-dimensional PCA score plot (Figure 3a) displays the distribution of the genotypes according to the first three principal components (PC1, PC2, and PC3), which together explain approximately 34.9% of the total variance (R2X: PC1 = 18.46%, PC2 = 8.82%, and PC3 = 7.52%). The pooled QC injections form a tight, centrally located cluster in the 3D PCA space (PC1-PC3), fully contained within the Hotelling’s T2 95% ellipse, indicating excellent analytical repeatability and negligible drift.
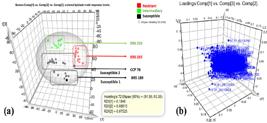
(a) Three-dimensional PCA score plot (PC1 vs. PC2 vs. PC3) displaying the clustering of cashew genotypes based on metabolomic profiles associated with resistance to black mold (P. anacardii). Genotypes BRS 226 (intermediary resistance, green), BRS 265 (resistant, red), and susceptible genotypes CCP 76 and BRS 189 (black) are distinctly grouped. Hotelling’s T2 ellipse (95% confidence interval) is included, and explained variance (R2X) for each component is indicated in parentheses. (b) Three-dimensional PCA loading plot (PC1 vs. PC2 vs. PC3) illustrating the complexity and high dimensionality of the metabolomic dataset from cashew leaves. The dense clustering of variables highlights the difficulty of identifying specific biomarkers for resistance to black mold (P. anacardii).
The absence of QC outliers supports stable retention-time alignment and consistent ion response after preprocessing. Consequently, the clear separation among BRS 226, BRS 265, CCP 76, and BRS 189 reflects true biological variation rather than batch or run-order effects, thereby validating the robustness of downstream multivariate interpretations (Figure S2, SI section).
These results are consistent with recent metabolomics studies that successfully applied PCA to distinguish cashew genotypes resistant to or susceptible to diseases such as anthracnose, enabling the identification of potential biomarkers related to resistance or susceptibility.8
The score plot clearly discriminates the genotypes based on their phenotypic response to black mold, corroborating prior phytopathological field studies (data not shown) that had previously characterized the commercial clones, and reinforcing the consistency between metabolic and phenotypic data. The genotype BRS 226, classified as intermediately resistant, forms a distinct cluster primarily located in the positive region of PC3. In contrast, the resistant genotype BRS 265 is positioned in the positive quadrant of PC2, distinctly separated from the other groups. The susceptible genotypes ‘CCP 76’ and ‘BRS 189’ cluster together in the lower region of the plot, predominantly characterized by negative values for PC2 and PC3. These two form subgroups, suggesting metabolic similarity yet distinct from the resistant and intermediately resistant genotypes. A similar pattern of group separation has been observed in proteomic studies comparing resistant and susceptible cashew genotypes challenged with Lasiodiplodia theobromae, where proteins involved in defense mechanisms and energy metabolism were differentially expressed in resistant plants.61
Additionally, Hotelling’s T2 ellipse at a 95% confidence level was applied to detect potential outliers. No sample fell outside the confidence boundaries, indicating robust data structure and high intra-group homogeneity. This result confirms the reliability of the analytical approach adopted for the metabolomic discrimination of genotypes. Similar robustness was previously reported in proteomic profiling of stem tissues from susceptible genotypes like ‘CCP 76’, where the distribution of stress-related proteins supported the consistency of the applied methodologies.61 Overall, these findings reinforce the potential of PCA-based chemometric approaches as efficient and rapid tools for the preliminary screening of cashew genotypes for resistance to black mold, providing valuable insights for breeding programs focused on disease resistance.
The three-dimensional PCA loading plot highlights a dense concentration of variables clustered near the origin, reflecting the high degree of overlap and complexity in the dataset. This is a common challenge in high-dimensional metabolomic studies, where the large number of variables often hinders the clear identification of those that are truly responsible for group differentiation, such as resistance versus susceptibility to pathogens.62
While PCA is a powerful exploratory tool, its discriminative power is limited in the presence of highly redundant and irrelevant information. The 3D loading plot (Figure 3b) clearly illustrates the intrinsic limitation of PCA in delivering straightforward interpretative clarity, especially when the goal is to identify specific resistance-related biomarkers.63
To overcome these limitations, orthogonal projections to latent structures discriminant analysis (OPLS-DA) emerges as a robust alternative. Unlike PCA, OPLS-DA explicitly separates the variation that is predictive of group differences from orthogonal (non-correlated) variance. This results in improved group separation and highlights biologically meaningful variables. Several studies have demonstrated the effectiveness of OPLS-DA in discriminating against resistant and susceptible plant genotypes, including cashew clones resistant to anthracnose,8 and cotton resistant to leaf spot caused by Aspergillus tubingensis.36
By reducing model complexity, OPLS-DA facilitates the identification of the most relevant chemical or biological variables,7 thus enabling the accurate discovery of biomarkers associated with resistance to black mold in cashew.
In summary, the complementary application of OPLS-DA is crucial to enhance the interpretability of the complex metabolomic data observed and to mitigate the challenges posed by the high dimensionality revealed in the PCA loading plot.
Biomarkers levels: metabolic signatures associated with resistance to P. anacardii in dwarf cashew genotypes
OPLS-DA
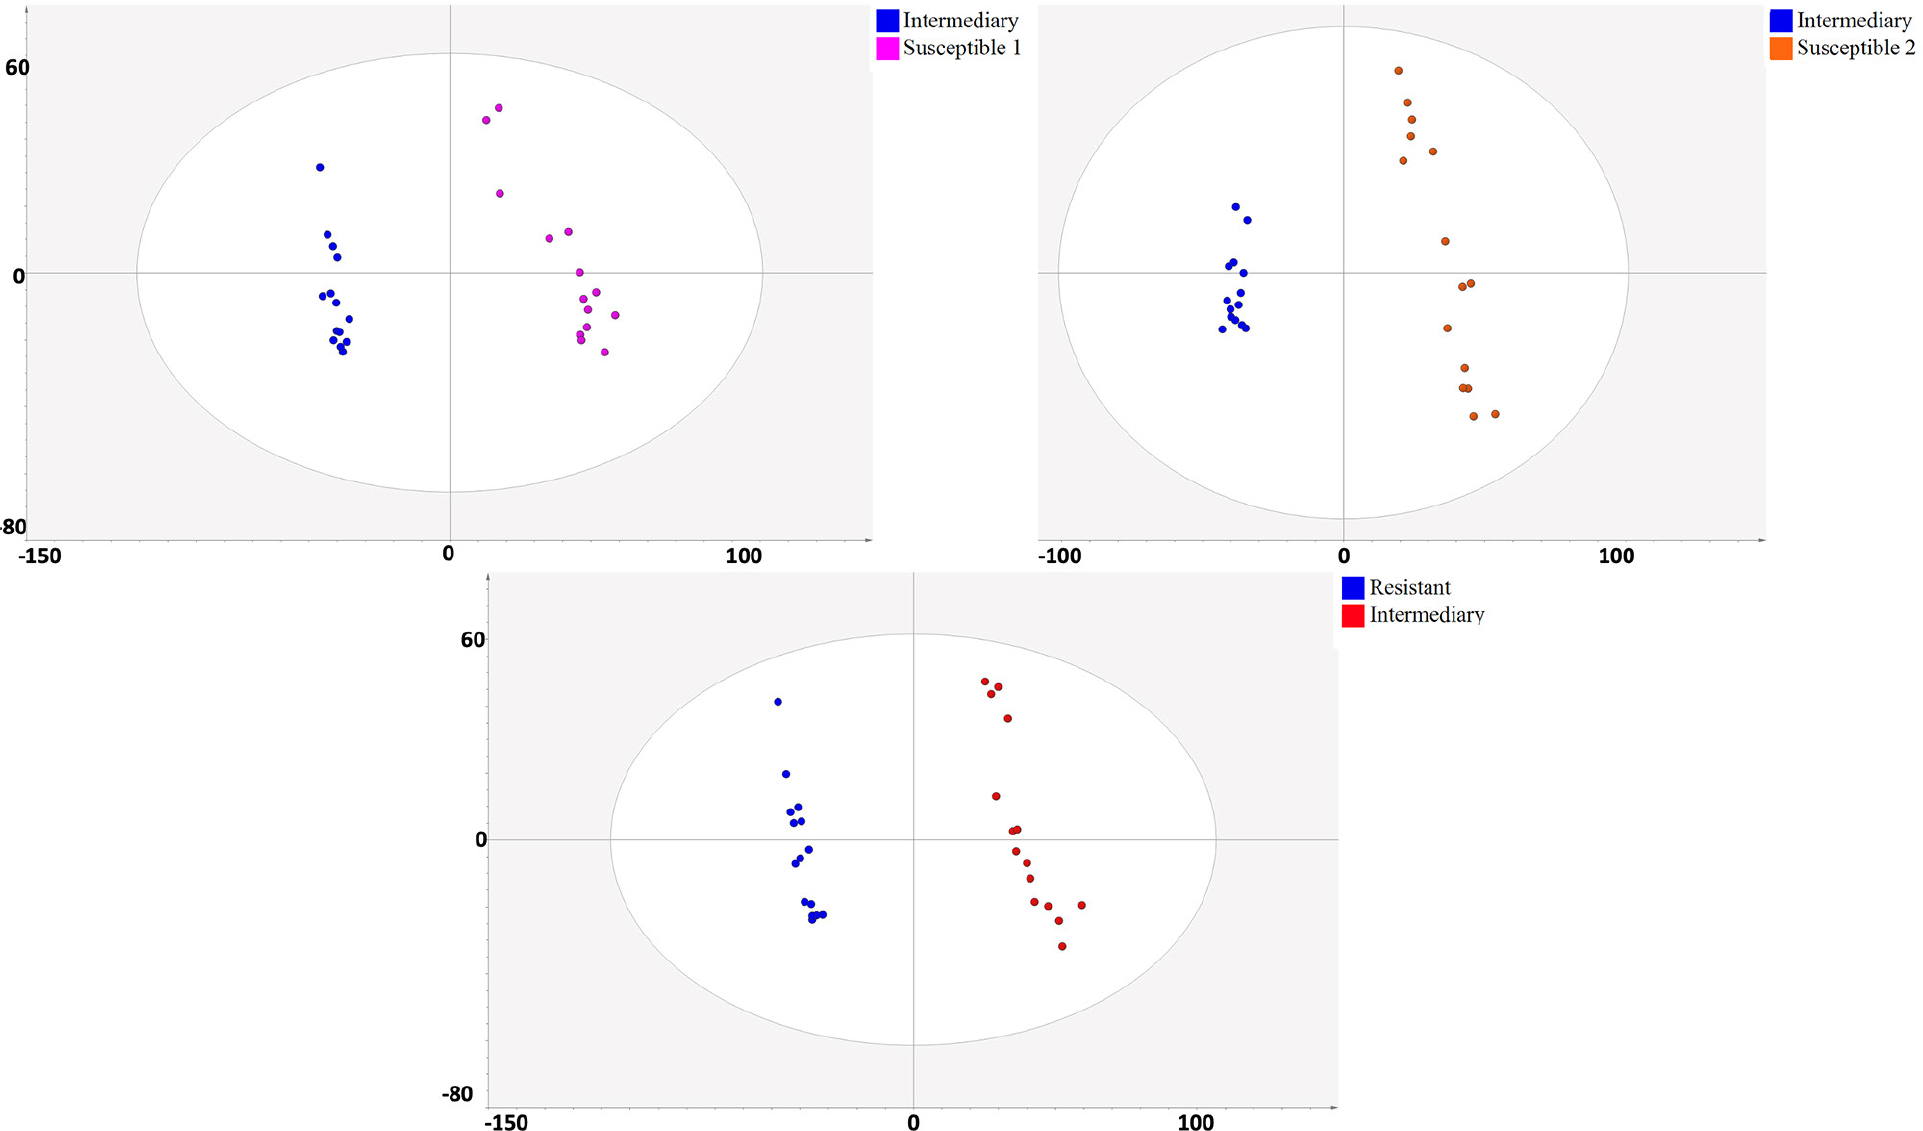
OPLS-DA revealed a clear metabolic segregation among resistant, susceptible, and intermediate dwarf cashew genotypes under P. anacardii stress, highlighting a pronounced metabolic reprogramming associated with resistance phenotypes (Figure 4, Table 3). The models exhibited excellent robustness and predictive power, with R2Y and Q2 values consistently above 0.95 across pairwise comparisons: resistant vs. susceptible 1 (R2Y = 0.99; Q2 = 0.95), resistant vs. susceptible 2 (R2Y = 0.98; Q2 = 0.96), and resistant vs. intermediate (R2Y = 0.99; Q2 = 0.97), indicating highly reliable class discrimination.64 Validation of the OPLS-DA models was supported by highly significant CV-ANOVA results (p = 2.74 × 10⁻¹³, p = 1.45 × 10⁻¹⁶, and p = 1.45 × 10⁻¹⁸ for the models shown in Figure 4). The absence of overfitting was further confirmed by permutation testing (200 permutations). Figure S3 (SI section) displays the permutation test results for each OPLS-DA model from Figure 4, while Figure S4 (SI section) presents the corresponding loading plots, illustrating the variables contributing to genotype discrimination.
Putative resistance biomarkers in dwarf cashew genotypes under black mold stress annotated by multivariate and univariate analyses
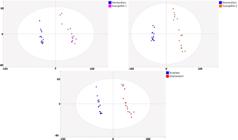
Multivariate analyses discriminating resistant (BRS265) and susceptible 1 (CCP 76), susceptible 2 (BRS 189) and intermediate (BRS 226) dwarf cashew genotypes under black mold stress. OPLS-DA score plot showing clear separation between resistant, susceptible and intermediate genotypes.
Metabolomic profiling revealed a consistent enrichment of specialized metabolites in resistant genotypes, particularly flavonoids, galloylated sugars, phenolic acids, and biflavonoids, which are known to play key roles in plant defense. Nineteen metabolites were identified as putative biomarkers of resistance (Table 3) based on MSI Level 1 and Level 2 criteria.65
According to Table 3, flavonoids were notably activated in resistant genotypes, as evidenced by the significant accumulation of flavonols such as isoquercetin (quercetin-3-D-glucoside, m/z 463.0886) and myricetin-3-O-galactoside (m/z 479.0820), with fold changes of 6.9 and 2.3, respectively (p-value < 0.05). These glycosylated flavonoids improve compound solubility and stability while contributing to oxidative stress mitigation and disruption of fungal membrane integrity.66,67
Among the most discriminant metabolites, isoquercetin consistently displayed the highest VIP scores (4.83 5.48) across all comparisons, while (+)-catechin (m/z 289.0710; fold change = 6.1; VIP = 8.97; p-value = 1.36 × 10⁻⁸) and gallocatechin/epigallocatechin (m/z 305.0668; fold change = 4.0; VIP ca. 3.4) also exhibited strong discriminatory power. These flavan-3-ols are critical precursors for proanthocyanidins (condensed tannins), which reinforce cell wall integrity and inhibit fungal enzymes such as polygalacturonases and cellulases.68,69
Galloylated glucose derivatives, notably 1,2,3,4,6-penta-O-galloyl-D-glucose (m/z 939.1120; VIP = 8.83) and 1,2,3,6-tetra-O-galloyl-glucopyranose (VIP = 3.09; fold change = 3.0), were markedly upregulated in resistant genotypes. These compounds are known for their ability to chelate metal ions, depriving fungal pathogens of essential micronutrients like iron, a mechanism analogous to siderophore interference but reversed for host defense.69 Moreover, galloylated metabolites exert membrane-disrupting effects and inhibit adenosine triphosphate (ATP) synthesis in fungal cells.68
Multifunctional role of biflavonoids in resistance
Biflavonoids such as amentoflavone/agathisflavone (m/z 537.0897; VIP = 8.37) were significantly accumulated in resistant genotypes, particularly in the comparison resistant vs. susceptible 2. These compounds serve dual roles in plant defense. First, they act as direct antifungal agents, potentially targeting fungal NADPH oxidase and polyketide synthase (PKS) enzymes, thereby inhibiting mycotoxin (e.g., aflatoxin) biosynthesis. Second, biflavonoids modulate immune responses by activating mitogen-activated protein kinase (MAPK) cascades.
This leads to the phosphorylation of transcription factors such as WRKY8, promoting the expression of defense-related genes independently of salicylic acid signaling.70 Similar MAPK-driven immune responses have been described in multiple plant species, including Arabidopsis (MAPKK7) and Prunus persica (MAPKK5), reinforcing both local and systemic acquired resistance (SAR).70
Other metabolites such as rutin (quercetin-3-rutinoside; fold change = 2.3), myricitrin (myricetin-3-O-rhamnoside; fold change = 5.8), and plantaginin, a methylated flavonoid glycoside (VIP = 3.17-3.85; p-value < 1×10⁻⁹), were consistently enriched in resistant genotypes. Methylation enhances lipophilicity, facilitating interactions with microbial membranes and potentiating antifungal effects.71,72
The elevation of sucrose (VIP = 2.40; p-value = 0.0267) in resistant versus intermediate genotypes suggests a role beyond primary metabolism, acting both as an energy source to fuel defense responses and as a signaling molecule to activate systemic resistance pathways.73
Together, the metabolomic fingerprint of resistant dwarf cashew genotypes reflect a sophisticated, multilayered defense strategy. This is driven by the coordinated accumulation of phenylpropanoid derivatives, including flavonols, flavan-3-ols, biflavonoid, and hydrolyzable tannins, which function synergistically as antioxidants, structural fortifiers, metals chelators, and antimicrobial agents.73 This integrated chemical defense not only mitigates oxidative stress but also fortifies cell walls and interferes with fungal metabolism, ultimately constraining the progression of P. anacardii. These findings reinforce the paradigm that durable plant resistance arises from the interplay of multiple metabolic hubs rather than the action of single metabolites.
This study provides comprehensive metabolomic evidence that resistance to P. anacardii (black mold) in dwarf cashew genotypes is underpinned by a robust and multifaceted biochemical defense network. The metabolic fingerprint associated with resistant genotypes is characterized by the significant overaccumulation of specialized metabolites, including flavonoid glycosides, flavan-3-ols, biflavonoids, and galloylated compounds, all of which are widely recognized for their roles in plant immunity.
The consistent upregulation of flavonoids, particularly quercetin-3-D-glucoside (isoquercetin) and myricetin-3-O galactoside, underscores their central role in the resistance phenotype these compounds are not merely antioxidants but also act as direct antifungal agents by disrupting fungal membrane integrity, impairing enzymatic systems, and interfering with quorum sensing mechanisms.66,67 Their glycosylated forms enhance solubility and stability, improving their bioavailability during pathogen attack.
Moreover, the accumulation of rutin (quercetin-3 rutinoside) and myricitrin (myricetin-3-O-rhamnoside) highlights an adaptive strategy where resistant genotypes channel flavonoid biosynthesis towards highly active glycosylated derivatives, offering a dual benefit: mitigation of oxidative stress and direct inhibition of fungal proliferation.71
Flavan-3-ols such as (+)-catechin and gallocatechin/epigallocatechin displayed exceptionally high VIP values and fold changes in resistant genotypes. Their role transcends antioxidant activity. These molecules are precursors of proanthocyanidins (condensed tannins), which contribute to reinforcing cell walls through lignin-like polymerization, thus forming a physical barrier against pathogen ingress.69,74
Additionally, flavan-3-ols act as inhibitors of pathogen-derived hydrolytic enzymes, such as cellulases and polygalacturonases, thereby impeding fungal penetration and colonization.72 The correlation between elevated catechin levels and resistance mirrors findings in other woody species like Quercus robur and Theobroma cacao, where tannin-based defenses are pivotal.
The marked accumulation of galloylated sugars, particularly 1,2,3,6-tetra-O-galloyl-glucopyranose and 1,2,3,4,6-penta-O-galloyl-D-glucose, reflects a potent chemical strategy against fungal pathogens. Galloyl groups are known to precipitate microbial proteins, disrupt cell membranes, and chelate essential micronutrients like iron, thereby restricting fungal growth through nutrient deprivation.69,74
This mechanism operates analogously but antagonistically to siderophore-mediated iron acquisition used by fungi: while siderophores scavenge iron for the pathogen, galloylated compounds sequester iron within plant tissues, creating a hostile environment for pathogen development.
A particularly novel finding is the significant accumulation of biflavonoids such as amentoflavone or agathisflavone in resistant genotypes. These compounds play multifunctional roles. From a biochemical standpoint, they directly inhibit fungal enzymes involved in virulence and secondary metabolism, including NADPH (nicotinamide adenine dinucleotide phosphate, reduced form) oxidases and polyketide synthases, thereby suppressing toxin production.
Beyond direct antifungal activity, biflavonoids act as potent immune modulators. They have been shown to activate mitogen-activated protein kinase (MAPK) cascades, which are central to plant innate immunity.69 This activation leads to phosphorylation of transcription factors such as WRKY8, which in turn upregulates defense-related genes independently of salicylic acid (SA) pathways. This is particularly relevant because it suggests that biflavonoids not only contribute to local resistance but also prime systemic acquired resistance (SAR), a phenomenon well-documented in model plants like Arabidopsis thaliana and Nicotiana benthamiana.46,70
Sucrose was consistently elevated in resistant genotypes, suggesting that primary metabolism is intimately linked with defense responses. Sucrose serves a dual function: it provides the metabolic energy required for biosynthesis of defense compounds and acts as a signaling molecule, activating defense pathways such as SAR.73 Its role as a signaling hub bridges primary metabolism with specialized metabolic responses. This multilayered defense strategy aligns with the emerging paradigm in plant immunity that effective resistance is the result of a metabolomic network, rather than isolated metabolites.74
The chemical arsenal identified in resistant dwarf cashew genotypes likely reflects an evolutionary response to pathogen pressure in tropical environments, where high humidity favors fungal proliferation. The biosynthetic investment in flavonoid diversity, galloylation, and biflavonoid production underscores the ecological importance of metabolic plasticity in plant defense.
Understanding the metabolomic basis of resistance provides actionable insights for breeding programs aimed at enhancing disease resistance in cashews. Moreover, the identified metabolites, especially biflavonoids and galloylated compounds, represent promising candidates for bio-inspired fungicides or plant defense activators.
Functional validation of these compounds through gene expression studies, enzyme inhibition assays, and pathogen challenge experiments will be critical next steps to confirm their roles and unravel their mechanisms of action.
Biosynthetic pathways of secondary metabolites in cashew resistance
To elucidate the biochemical mechanisms underlying the resistance of Anacardium occidentale clone BRS 265 to P. anacardii, a comprehensive pathway analysis was performed using MetaboAnalyst version 6.0, employing the KEGG database with Hevea brasiliensis as the reference organism. The statistical framework incorporated a hypergeometric test for enrichment analysis, relative-betweenness centrality for topological evaluation, and a false discovery rate (FDR) correction to mitigate type I errors.
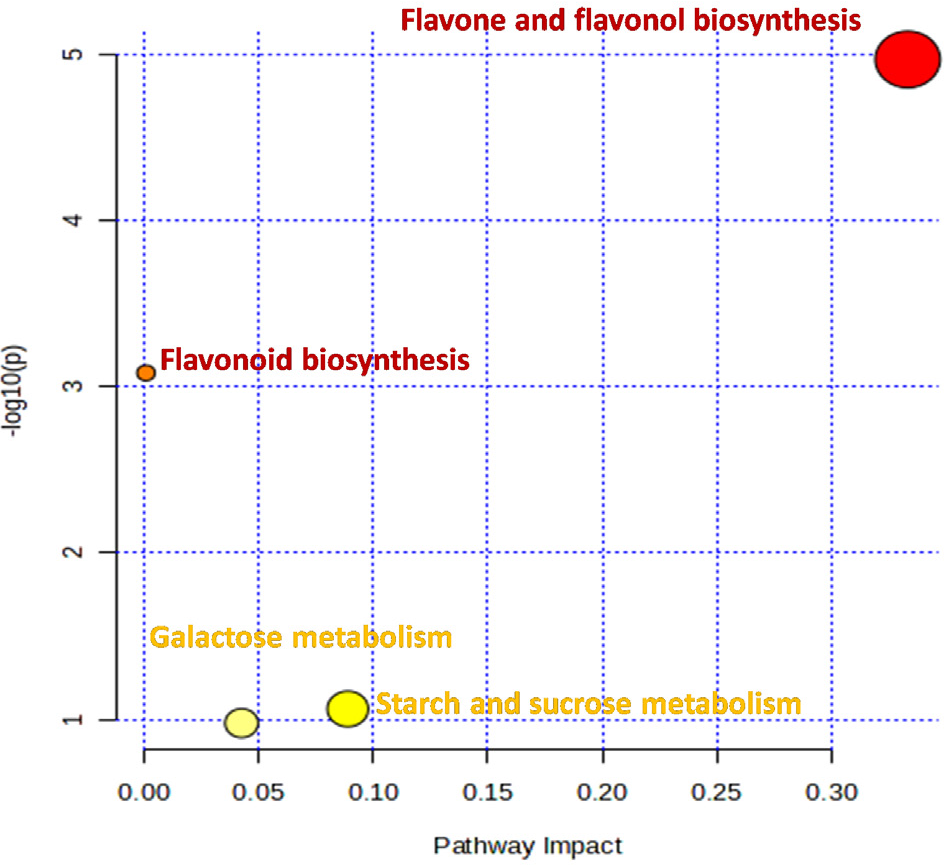
The pathway impact analysis (Figure 5, Table 4) revealed a prominent modulation of flavonoid-related metabolic routes. Specifically, the flavone and flavonol biosynthesis pathway emerged as the most significantly enriched (FDR = 9.85 × 10⁻⁴) and exhibited the highest topological impact (0.333), strongly indicating its central role in the metabolic reprogramming of the resistant clone. This pathway is pivotal for the biosynthesis of flavonoids with known antifungal properties, including apigenin, luteolin, and kaempferol derivatives, which have been extensively documented as key defense compounds in plants against fungal pathogens.
Pathway enrichment and topological analysis of differential metabolitesa in dwarf cashew under black mold stress
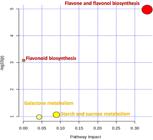
xPathway enrichment analysis of dwarf cashew genotypes under black mold (P. anacardii) stress and topology analysis of metabolites differentially accumulated in resistant dwarf cashew genotypes under black mold stress. The x-axis represents the pathway impact, based on topological analysis, while the y-axis shows the -log10(p-value) from the enrichment analysis. Circle size corresponds to the impact score, and color intensity reflects statistical significance (from yellow to red).
Bubble plot with pathway impact (topology) on the x-axis and significance (-log10 p) on the y-axis; bubble radius scales with impact and color encodes significance (warmer = more significant). Two flavonoid-related pathways dominate the response: flavone and flavonol biosynthesis shows the highest topological impact (impact = 0.333) and strongest enrichment (-log10 p = 4.97; raw p = 1.07 × 10⁻⁵; FDR = 9.96 × 10⁻⁴; 3 hits), followed by flavonoid biosynthesis (-log10 p = 3.08; raw p = 8.24 × 10⁻⁴; FDR = 3.83 × 10⁻²; 3 hits; minimal topological impact = 7.8 × 10⁻⁴). Starch and sucrose metabolism (impact = 0.089) and galactose metabolism (impact = 0.043) exhibit low significance (-log10 p ≈ 1) and do not remain significant after multiple-testing correction. Together, these results indicate a selective remodeling of flavonoid pathways under pathogen pressure. See Table 4 for full statistics and methods for criteria defining differential metabolites.
Additionally, the flavonoid biosynthesis pathway was also significantly enriched (FDR = 0.0383), though with a lower impact score (7.8 × 10⁻⁴). Despite its modest topological contribution, statistical significance reinforces the centrality of flavonoid metabolism in orchestrating resistance. This suggests a coordinated activation of both core and specialized branches of the flavonoid biosynthetic network, potentially enhancing the accumulation of diverse classes of phenolic compounds involved in antimicrobial defense, oxidative stress mitigation, and reinforcement of cell walls.
Conversely, primary metabolic pathways such as starch and sucrose metabolism (FDR = 1.0; impact = 0.088) and galactose metabolism (FDR = 1.0; impact = 0.042) exhibited neither statistical significance nor substantial topological influence. These findings indicate that, under the imposed biotic stress, the metabolic adjustments in the resistant genotype are predominantly confined to secondary metabolism rather than central carbon fluxes. The marginal alterations observed in carbohydrate-related pathways may reflect ancillary adjustments associated with energy redistribution or osmotic balance rather than being direct determinants of resistance.
Collectively, the enrichment of flavonoid-centric pathways underscores the central role of specialized metabolism in mediating resistance to P. anacardii. The elevated pathway impact associated with flavone and flavonol biosynthesis suggests that these metabolic routes are not only statistically overrepresented but also structurally critical within the metabolic network, functioning as hubs that orchestrate biochemical responses to pathogen challenge. This metabolic reprogramming likely culminates in the enhanced synthesis of antimicrobial flavonoids, which act synergistically with other defense mechanisms to suppress fungal colonization.
These results align with a broader body of literature highlighting the role of flavonoids in plant immunity, particularly in perennial tropical species, and provide a mechanistic foundation for future breeding strategies targeting metabolic traits associated with disease resistance in cashew.
Conclusions
The untargeted metabolomic analysis presented herein uncovered a complex network of resistance-associated metabolites that discriminate resistant from susceptible dwarf cashew genotypes under black mold stress. Among the compounds identified, quercetin-3-O-(6”-galloyl)-D-glucopyranoside and amentoflavone/agathisflavone emerged as strong candidates for resistance biomarkers, based on their elevated abundance and established bioactivities related to plant defense. These findings offer a solid biochemical foundation for the implementation of MAS strategies, which could significantly accelerate breeding programs aimed at developing black mold-resistant cashew cultivars. Furthermore, the convergence of resistance traits with enriched flavonoid and polyphenol pathways opens avenues for novel agronomic interventions. In particular, the exogenous application of polyphenolic compounds-such as tannic acid, successfully used in rice and wheat-holds promise for enhancing resistance in cashew agroecosystems. Collectively, these insights provide valuable tools and strategies for sustainable disease management and genetic improvement of Anacardium occidentale.
Supplementary Information
Supplementary Information
Supplementary data (2D NMR spectra of cashew leaf extracts, 1H and 13C chemical shift tables, PCA score plots, OPLS-DA permutation tests, and VIP/Loading Plot analyses highlighting metabolites associated with resistance to black mold) are available free of charge at http://jbcs.sbq.org.br as PDF file.
Acknowledgments
The authors gratefully acknowledge financial support from the CNPq (303791/2016-0) and INCT BioNat, National Institute of Science and Technology (grant No. 465637/2014-0). This study was financed in part by the CAPES - Finance Code 001. This research was supported by resources supplied by Embrapa (SEG 03.14.01.012.00.00).
Data Availability Statement
Data are available from the corresponding author upon request.
References
-
1 Freire, J. C. P.; Oliveira Jr., J. K. O.; Santiago, C. P. L.; Freire, S. C. P.; Lima, E. O. L.; Revista UNINGÁ Review 2017, 29, 123. [Crossref]
» Crossref -
2 Farias, J. C.; Mayo, S. J.; Vieira, I. R.; Andrade, I. M.; Plant Syst. Evol. 2024, 310, 3. [Crossref]
» Crossref -
3 Martins, M. V. V.; Lima, J. S.; Viana, F. M. P.; Cardoso, J. E.; Araújo, F. S. A.; Ootani, M. A.; Revista Ceres 2017, 64, 574. [Crossref]
» Crossref -
4 Instituto Brasileiro de Geografia e Estatística (IBGE); Produção de Castanha-de-caju (cultivo) [Link] accessed in November 2025
» Link -
5 Freire, F. C. O.; Cardoso, J. E.; dos Santos, A. A.; Viana, F. M. P.; Crop Prot. 2002, 21, 489. [Crossref]
» Crossref -
6 Cardoso, J. E.; Cavalcanti, J. J. V.; Cavalcante, J. B. M.; Aragão, L. M.; Felipe, E. M.; Crop Prot 1999, 18, 23. [Crossref]
» Crossref -
7 FUNCEME. [Link] accessed in November 2025
» Link -
8 Alves, P. C. C.; Guedes, J. A. C.; Serrano, L. A. L.; Martins, M. V. V.; de Sousa, D. B.; Silva, G. S.; Ribeiro, P. R. V.; Zampieri, D. S.; Zocolo, G. J.; J. Braz. Chem. Soc. 2023, 34, 1652. [Crossref]
» Crossref -
9 Zhao, L.; Hu, Y.; Xu, D.; Cai, K.; Colloids Surf., B 2014, 119, 115. [Crossref]
» Crossref -
10 Cunha, A. G.; Brito, E. S.; Moura, C. F. H.; Ribeiro, P. R. V.; Miranda, M. R. A.; J. Chromatogr. B 2017, 1051, 24. [Crossref]
» Crossref -
11 Alves Filho, E.; Silva, L. M.; Lima, Y.; Ribeiro, P.; Silva, E.; Zocolo, G.; Canuto, K.; Morais, S.; Castro, A. C.; de Brito, E.; Metabolites 2019, 9, 121. [Crossref]
» Crossref -
12 Kumar, P.; Siva, B.; Katragunta, K.; Beedkar, S. D.; Ramakrishna, S.; Barua, C. C.; Babu, K. S.; J. AOAC Int. 2021, 104, 827. [Crossref]
» Crossref -
13 Noleto-Dias, C.; Farag, M. A.; Porzel, A.; Tavares, J. F.; Wessjohann, L. A.; Mohamed Farag, C. A.; Phytochem. Anal. 2024, 35, 445. [Crossref]
» Crossref -
14 de Sousa, D. B.; da Silva, G. S.; Guedes, J. A. C.; Serrano, L. A. L.; Martins, M. V. V.; Rodrigues, T. H. S.; de Brito, E. S.; Zampieri, D.; Lima, M. A. S.; Zocolo, G. J.; J. Braz. Chem. Soc. 2022, 33, 1423. [Crossref]
» Crossref - 15 dos Reis Luz, L.; Porto, D. D.; Castro, C. B.; Silva, M. F. S.; Alves Filho, E. G.; Canuto, K. M.; de Brito, E. S.; Becker, H.; do Ó Pessoa, C.; Zocolo, G. J.; J Chromatogr. B: Anal. Technol. Biomed. Life Sci. 2018, 1099, 97. [Crossref]
-
16 Pilon, A. C.; Selegato, D. M.; Fernandes, R. P.; Bueno, P. C. P.; Pinho, D. R.; Carnevale Neto, F.; Freire, R. T.; Castro-Gamboa, I.; Bolzani, V. S.; Lopes, N. P.; Quim. Nova 2020, 43, 329. [Crossref]
» Crossref -
17 Correia, S. J.; David, J. P.; David, J. M.; Quim. Nova 2006, 29, 1287. [Crossref]
» Crossref -
18 Gondim, T. A.; Guedes, J. A. C.; Alves Filho, E. G.; da Silva, G. S.; Nina, N. V. S.; do Nascimento Filho, F. J.; Atroch, A. L.; da Silva, G. F.; Lopes, G. S.; Zocolo, G. J.; Anal. Methods 2023, 16, 1158. [Crossref]
» Crossref -
19 Blaženović, I.; Kind, T.; Ji, J.; Fiehn, O.; Metabolites 2018, 8, 31. [Crossref]
» Crossref -
20 PubChem. [Link] accessed in November 2025
» Link -
21 ChemSpider. [Link] accessed in November 2025
» Link -
22 MassBank of North America (MoNA). [Link] accessed in November 2025
» Link -
23 KEGG: Kyoto Encyclopedia of Genes and Genomes. [Link] accessed in November 2025
» Link - 24 EZInfo, version 12.0; Umetrics, Umeå, Sweden, 2023.
-
25 Artêncio, M. M.; Cassago, A. L. L.; da Silva, R. K.; Giraldi, J. M. E.; da Costa, F. B.; Rev. Bras. Farmacogn 2023, 33, 1251. [Crossref]
» Crossref -
26 Cassago, A. L. L.; Souza, F. V. D.; Zocolo, G. J.; da Costa, F. B.; Biochem. Syst. Ecol. 2022, 100, 104380. [Crossref]
» Crossref -
27 IBM SPSS Statistics, version 27.0; IBM Corp., Armonk, NY, 2021. [Crossref]
» Crossref -
28 Pang, Z., Zhou, G., Ewald, J., Chang, L., Hacariz, O., Basu, N.; Xia, J.; Nucleic Acids Res. 2024, 52, W1. [Crossref]
» Crossref -
29 Leite, A. K. F.; Fonteles, T. V.; Miguel, T. B. A. R.; Silva, G. S.; Brito, E. S.; Alves Filho, E. G.; Fernandes, F. A. N.; Rodrigues, S.; Food Res. Int. 2021, 147, 110530. [Crossref]
» Crossref -
30 Veenhoven, J.; Saverwyns, S.; van Keulen, H.; van Bommel, M.; Lynen, F.; Carbohydr. Polym. 2024, 323, 121373. [Crossref]
» Crossref -
31 Erşan, S.; Güçlü Üstündaǧ, Ö.; Carle, R.; Schweiggert, R. M.; J. Food Compos. Anal. 2016, 62, 103. [Crossref]
» Crossref -
32 Castro, C. B.; Luz, L. R.; Guedes, J. A. C.; Porto, D. D.; Francilene, M.; Silva, S.; Silva, G. S.; Ribeiro, P. R. V.; Canuto, K. M.; Brito, E. S.; Zampieri, D. S.; Pessoa, C. Ó.; Zocolo, G. J.; J. Braz. Chem. Soc. 2020, 31, 775. [Crossref]
» Crossref -
33 Young, D. A.; Am. J. Bot. 1979, 66, 502. [Crossref]
» Crossref -
34 Zhang, Z.; Huang, W.; Zhao, L.; Xiao, L.; Huang, H.; Sci. Hortic. 2024, 324, 112617. [Crossref]
» Crossref -
35 Drioiche, A.; Ailli, A.; Remok, F.; Saidi, S.; Gourich, A. A.; Asbabou, A.; Al Kamaly, O.; Saleh, A.; Bouhrim, M.; Tarik, R.; Kchibale, A.; Zair, T.; Biomedicines 2023, 11, 2372. [Crossref]
» Crossref -
36 Khizar, M.; Shi, J.; Saleem, S.; Liaquat, F.; Ashraf, M.; Latif, S.; Haroon, U.; Hassan, S. W.; Rehman, S.; Chaudhary, H. J.; Quraishi, U. M.; Munis, M. F. H.; PLoS One 2020, 15, e0228675. [Crossref]
» Crossref -
37 Michodjehoun-Mestres, L.; Souquet, J. M.; Fulcrand, H.; Bouchut, C.; Reynes, M.; Brillouet, J. M.; Food Chem. 2009, 112, 851. [Crossref]
» Crossref -
38 Dona, A. C.; Kyriakides, M.; Scott, F.; Shephard, E. A.; Varshavi, D.; Veselkov, K.; Everett, J. R.; Comput. Struct. Biotechnol. J. 2016, 14, 135. [Crossref]
» Crossref -
39 Spectral Database for Organic Compounds SDBS. [Link] accessed in November 2025
» Link -
40 CAS NMR database. [Link] accessed in November 2025
» Link -
41 Ma, X.; Tian, W.; Wu, L.; Cao, X.; Ito, Y.; J. Chromatogr. A 2005, 1070, 211. [Crossref]
» Crossref -
42 Ni, H. F.; Yang, H. R.; Chen, R. S.; Hung, T. H.; Liou, R. F.; Eur. J. Plant. Pathol. 2012, 133, 819. [Crossref]
» Crossref -
43 Keeler, J. H.; Understanding NMR Spectroscopy; Apollo: University of Cambridge Repository, UK, 2016. [Crossref]
» Crossref -
44 Sakhaii, P.; Bermel, W.; J. Magn. Reson. 2015, 259, 82. [Crossref]
» Crossref -
45 Kuhn, S.; Colreavy-Donnelly, S.; de Souza, J. S.; Borges, R. M.; Faraday Discuss. 2019, 218, 339. [Crossref]
» Crossref -
46 Aluko, O. O.; Li, C.; Wang, Q.; Liu, H.; Int. J. Mol. Sci. 2021, 22, 4704. [Crossref]
» Crossref -
47 Chen, F.; Ma, R.; Chen, X.-L.; Metabolites 2019, 9, 169. [Crossref]
» Crossref -
48 Macheroux, P.; Schmid, J.; Amrhein, N.; Schaller, A.; Planta 1999, 207, 325. [Crossref]
» Crossref -
49 Farghaly, F. A.; Salam, H. K.; Hamada, A. M.; Radi, A. A.; Sci. Hortic. 2021, 278, 109867. [Crossref]
» Crossref -
50 Sruthi, P.; Roopavathi, C.; Madhava Naidu, M.; Food Biosci. 2023, 51, 102246. [Crossref]
» Crossref -
51 Solomon Josiah, S.; Umar, H. I.; Saliu, I. O.; Akinmoladun, A. C.; Phytomedicine Plus 2021, 1, 100077. [Crossref]
» Crossref -
52 Yu, K.; Song, Y.; Lin, J.; Dixon, R. A.; Plant Commun. 2023, 4, 100498. [Crossref]
» Crossref -
53 Zheng, X.; Zhang, X.; Zeng, F.; Foods 2025, 14, 155. [Crossref]
» Crossref -
54 Escobar-Avello, D.; Lozano-Castellón, J.; Mardones, C.; Pérez, A. J.; Saéz, V.; Riquelme, S.; Von Baer, D.; Vallverdú-Queralt, A.; Molecules 2019, 24, 3763. [Crossref]
» Crossref -
55 Liu, H.; Zou, T.; Gao, J. M.; Gu, L.; Food Chem. 2013, 141, 488. [Crossref]
» Crossref -
56 Sinan, K. I.; Zengin, G.; Zheleva-Dimitrova, D.; Gevrenova, R.; Picot-Allain, M. C. N.; Dall’Acqua, S.; Behl, T.; Goh, B. H.; Ying, P. T. S.; Mahomoodally, M. F.; Antioxidants 2021, 10, 1771. [Crossref]
» Crossref -
57 Guedes, J. A. C.; Santiago, Y. G.; dos Reis Luz, L.; Silva, M. F. S.; Ramires, C. M. C.; de Lima, M. A. C.; de Oliveira, V. R.; do Ó Pessoa, C.; Canuto, K. M.; de Brito, E. S.; Lima, M. F.; Alves, R. E.; Zampieri, D.; do Nascimento, R. F.; Zocolo, G. J.; Phytochem. Lett. 2020, 40, 26. [Crossref]
» Crossref -
58 Osuntokun, O. T.; Idowu, T. O.; Cristina, G. M.; Biochem. Pharmacol.2018, 7, 1000240. [Crossref]
» Crossref -
59 March, R. E.; Miao, X. S.; Int. J. Mass. Spectrom. 2004, 231, 157. [Crossref]
» Crossref -
60 Yao, H.; Chen, B.; Zhang, Y.; Ou, H.; Li, Y.; Li, S.; Shi, P.; Lin, X.; Molecules 2017, 22, 325. [Crossref]
» Crossref -
61 Cipriano, A. K. A. L.; Gondim, D. M. F.; Vasconcelos, I. M.; Martins, J. A. M.; Moura, A. A.; Moreno, F. B.; Monteiro Moreira, A. C. O.; Melo, J. G. M.; Cardoso, J. E.; Paiva, A. L. S.; Oliveira, J. T. A.; J. Proteomics 2014 113, 90. [Crossref]
» Crossref -
62 Maghfiroh, K. Q.; Erfianti, T.; NurAfifah, I.; Amelia, R.; Kurnianto, D.; Sadewo, B. R.; Maggandari, R.; Aji, B. R.; Budiman, A.; Suyono, E. A.; Malays. J. Nutr. 2023, 29, 453. [Link] accessed in November 2025
» Link -
63 Li, Z.; Yang, F.; Yang, R.; Int. J. Biol. Macromol. 2015, 75, 378. [Crossref]
» Crossref -
64 Worley, B.; Halouska, S.; Powers, R.; Anal. Biochem. 2013, 433, 102. [Crossref]
» Crossref -
65 Sumner, L. W.; Amberg, A.; Barrett, D.; Beale, M. H.; Beger, R.; Daykin, C. A.; Fan, T. W. M.; Fiehn, O.; Goodacre, R.; Griffin, J. L.; Hankemeier, T.; Hardy, N.; Harnly, J.; Higashi, R.; Kopka, J.; Lane, A. N.; Lindon, J. C.; Marriott, P.; Nicholls, A. W.; Reily, M. D.; Thaden, J. J.; Viant, M. R.; Metabolomics 2007, 3, 211. [Crossref]
» Crossref -
66 Agati, G.; Azzarello, E.; Pollastri, S.; Tattini, M.; Plant. Sci. 2012, 196, 67. [Crossref]
» Crossref -
67 Cushnie, T. P. T.; Lamb, A. J.; Int. J. Antimicrob. Agents 2005, 26, 343.[Crossref]
» Crossref -
68 Ullah, A.; Munir, S.; Badshah, S. L.; Khan, N.; Ghani, L.; Poulson, B. G.; Emwas, A.; Jaremko, M.; Molecules 2020, 25, 5243. [Crossref]
» Crossref -
69 Hammerbacher, A.; Kandasamy, D.; Ullah, C.; Schmidt, A.; Wright, L. P.; Gershenzon, J.; Front. Plant Sci. 2019, 10, 422913. [Crossref]
» Crossref -
70 Zhang, X.; Dai, Y.; Xiong, Y.; DeFraia, C.; Li, J.; Dong, X.; Mou, Z.; Plant J. 2007, 52, 1066. [Crossref]
» Crossref -
71 Treutter, D.; Plant Biol. 2005, 7, 581. [Crossref]
» Crossref -
72 Buer, C. S.; Imin, N.; Djordjevic, M. A.; J. Integr. Plant Biol. 2010, 52, 98. [Crossref]
» Crossref -
73 Moghaddam, M. R. B.; Van Den Ende, W.; J. Exp. Bot. 2012, 63, 3989. [Crossref]
» Crossref -
74 Piasecka, A.; Jedrzejczak-Rey, N.; Bednarek, P.; New Phytol. 2015, 206, 948. [Crossref]
» Crossref
Edited by
-
Editor handled this article:
César Ricardo Teixeira Tarley (Associate)