Unravelling Sources of BPA Exposure in Southern Brazil: Contributions of Drinking Water and Thermal Paper to Daily Intake Assessment through Human Biomonitoring
Abstract
Bisphenol A (BPA) is an endocrine-disrupting chemical used in polycarbonate plastics, epoxy resins, and thermal paper, and has been linked to health problems. Human exposure occurs mainly through ingestion and dermal contact, and BPA is detected in various biological and environmental matrices. This study quantified and evaluated BPA in urine, drinking water, and thermal paper samples collected from commercial establishments in southern Brazil. The analytical method applied was liquid chromatography coupled to mass spectrometry (LC-MS/MS). BPA was detected in 100% of urine samples, with concentrations ranging from 0.11 to 63.69 ng mL-1, indicating continuous exposure. In drinking water, concentrations varied from < 0.04 to 21.66 ng L-1, remaining within European Union regulatory limits. In contrast, 15% of thermal paper samples showed BPA above the permitted limit, with values ranging from 5,035.9 to 24,218.8 ng mg-1. Toxicological risk assessment indicated that, under previously established intake limits, exposure through drinking water and thermal paper would be considered safe. However, with the new tolerable daily intake (TDI) set by the European Food Safety Agency (EFSA) in 2023 (0.2 ng kg-1 body weight per day), exposure became a concern for a significant part of the study population. These findings highlight potential health risks and regulatory gaps in Brazil, emphasizing the need for stricter measures and safer alternatives to BPA in consumer products. They also reinforce the importance of monitoring BPA exposure and aligning national regulations with international safety standards.
Keywords:
bisphenol A; exposure; biomonitoring; drinking water; thermal paper
Introduction
Endocrine disruptors (EDs) are exogenous chemical substances capable of interfering with hormonal regulation and the functioning of the endocrine system, negatively impacting human and animal health and reproduction.1 Over 800 synthetic compounds are known or suspected to act as EDs,2 with bisphenol A (BPA) being one of the most studied due to its widespread presence in the environment and its association with various adverse health effects.3 Exposure to BPA is a public health concern because it mimics estrogen and disrupts endocrine signaling. Once ingested, BPA is rapidly absorbed and metabolized mainly into BPA-glucuronide and BPA-sulfate, with BPA-glucuronide commonly used as a biomarker in urine.4-6
BPA is a key intermediate in manufacturing plastics, paints, binders, flame retardants, brake fluids, and thermal paper, with about 95% of global production used in plastics, being 71% in polycarbonate synthesis and 29% in epoxy resins.7 Polycarbonate plastics are used in electronic products, digital media, household items, bottles, containers, and coatings, while epoxy resins are common in protective architectural coatings, shipbuilding, automotive industries, printed circuit boards,8 and inner linings of metal food packaging.9 With an estimated production of 8 million tons per year, BPA ranks among the most produced chemicals worldwide.10
Due to its widespread use and environmental persistence, human exposure to BPA occurs through multiple routes. BPA can leach into drinking water from plastic materials, and this migration is influenced by temperature, pH, alcohol content, and lipids, since plasticizers interact non-permanently with polymers facilitating BPA release.11 Thermal papers contain BPA in free, unpolymerized form, and during thermal printing, BPA reacts to form the image and transfers to skin upon handling.12 Other exposure routes include ingestion of contaminated food and inhalation of BPA in dust or air.13
BPA presence in drinking water can also result from leaching of epoxy coatings in distribution systems, especially when water stagnates in pipes, as well as direct contamination of surface water used for public supply.14 While conventional water treatment plants can remove 76-99% of BPA,8 residual levels may still be detected, since these processes are not specifically designed to eliminate endocrine disruptors.15 However, evidence suggests that dermal exposure through contact with thermal paper represents a more significant source of contamination than drinking water itself.16 In Brazil, Alves et al.17 found BPA in 79% of raw water samples with concentrations from 0.7 to 3257.1 ng L-1, reinforcing ingestion as an important exposure route.
In response to the widespread presence of BPA, the European Union has set regulatory measures. The Directive 2020/2184 limits BPA in drinking water to 2.5 µg L-1.18 Proposed amendments to this directive introduce an environmental quality standard of 0.034 ng L-1 for surface water.19 In addition, by 2025, BPA use in food contact materials, including epoxy coatings in containers and pipelines, will be banned in the European Union.20
Thermal paper is also a significant exposure source. International studies report significant levels of free BPA transferable to the skin upon contact with receipts.21 In Brazil, a multicenter study performed in 2018 found BPA in 90.9% of Brazilian thermal papers, with concentrations up to 20.27 mg g-1, and over 90% showing estrogenic and antiandrogenic activity (through the E-Screen bioassay), highlighting dermal exposure relevance.22 The EU banned thermal paper with BPA ≥ 0.02% by weight since 2020 to reduce skin exposure (Regulation (EU) 2016/2235).23
Detecting BPA in biological samples such as urine is critical to understanding exposure magnitude and main sources. Human biomonitoring is an essential tool to assess combined exposure from all sources by measuring internal body burden and comparing it with safety reference values.24 Reflecting growing concern, European Food Safety Agency (EFSA) recently reduced the tolerable daily intake of BPA from 4 µg kg-1 day-1 to 0.2 ng kg-1 day-1 in 2023.25
Building on a recent publication26 from our research group that evaluated the daily intake of BPA in a Southern Brazilian cohort through biomonitoring, the present study aimed to assess the contributions of drinking water consumption and contact with thermal paper, both sampled within the same geographic region, to BPA exposure in this population. In this context, identifying the most significant sources of exposure may offer valuable insights to inform mitigation strategies with potential health benefits for the population.
Experimental
Materials and reagents
Standard stock solutions of BPA and BPA-d16 (1 mg mL-1 in methanol) were purchased from Sigma-Aldrich (St. Louis, USA). Dansyl chloride, sodium bicarbonate, acetic acid, acetone, formic acid, ammonium acetate, sodium dodecyl sulfate, and β-glucuronidase from Helix pomatia type HP-2 (aqueous solution, ≥ 100.000 units mL-1) were also obtained from Sigma-Aldrich. Methanol, acetonitrile, dichloromethane, and isopropanol were purchased from Merck (Darmstadt, Germany). Ethyl acetate was obtained from Honeywell (Morris Plains, USA). Ultra-pure deionized water was supplied by a Milli-Q Reference system from Millipore (Billerica, MA, USA). Solid-phase extraction (SPE) cartridges Oasis HLB® (60 mg, 3 mL) were purchased from Waters (Milford, USA). Activated charcoal was obtained from Dinâmica (Indaiatuba, Brazil). Syringe filter (polytetrafluoroethylene, PTFE) hydrophilic, 13 mm, 0.22 µm) was purchased from Nova Analítica (São Paulo, Brazil). Polyethylene syringes (1 mL) were purchased from Medix (Paraná, Brazil). Fiberglass membranes, 90 mm GF-1, were acquired from Macherey-Nagel (Germany).
Solutions used in the analysis of urine samples
For urine analysis (n = 100), the BPA stock solution was diluted in methanol to obtain an intermediate solution at 100 µg mL-¹, which was further diluted to 10 µg mL-1. From this second intermediate solution, BPA working solutions were prepared in methanol at concentrations ranging from 2, 3, 5, 10, 20, 50, 70, 100, 200, 400 and 500 ng mL-1. BPA-d16 followed a similar process, being diluted to an intermediate solution of 100 µg mL-1 and subsequently to 1 µg mL-1. The internal standard (IS) working solution (BPA-d16) was adjusted to 300 ng mL-1. All solutions were stored at −18 ºC. Calibration and quality control (QC) samples were prepared using human urine from adults with no detectable BPA. Blank samples were obtained by treating urine with activated charcoal (60 mg per 1000 µL of urine), followed by vortex mixing, incubation at 25 ºC, and repeated centrifugation to remove the charcoal. Calibration and QC samples did not receive β-glucuronidase prior to extraction. The 1.0 M ammonium acetate solution containing β-glucuronidase (2000 units) was prepared using 0.77 g of ammonium acetate, 8.4 mL of purified water, 0.6 mL of glacial acetic acid, and 1.02 mL of β-glucuronidase HP-2 (aqueous solution, ≥ 100,000 units mL-1). The 0.1 M acetic acid solution was prepared by diluting 2.86 mL of glacial acetic acid in 500 mL of purified water. Solvent mixtures were prepared as follows: methanol/water (3:7, v/v) with 150 mL of methanol and 350 mL of purified water; dichloromethane/methanol (1:1, v/v) with 250 mL of each solvent. The 100 mM sodium bicarbonate solution was obtained by dissolving 0.042 g of sodium bicarbonate in 5 mL of purified water. The dansyl chloride solution (1 mg mL-1) was prepared by dissolving 0.0125 g of dansyl chloride in 5 mL of acetone.
Solutions used in the analysis of drinking water
An intermediate solution of BPA at 500 µg mL-1 was prepared by diluting the stock solution with methanol. Working solutions were prepared by dilution of the intermediate solutions with methanol and had concentrations of 2.5; 50; 500; 5,000 and 50,000 ng mL-1. Calibration samples had concentrations of 5, 15, 50, 150, 500, and 1500 ng L-1 and were obtained by diluting the working standard solutions with methanol. The working solution of IS was prepared in methanol and had concentrations of 75 ng L-1 for BPA-d16. The low-concentration quality control solution (QCMEL) contained 50 ng L-1 of BPA, and the high-concentration solution (QCMEH) contained 1500 ng L-1 of BPA, both prepared by diluting the working standard solution with methanol. Sodium bicarbonate solution was prepared at a concentration of 0.1 M in ultrapure water. Dansyl chloride solution was prepared at 2.5 mg mL-1 in acetone.
Solutions used in the analysis of thermal paper
An intermediate solution of BPA at 100 µg mL-1 was prepared by diluting the stock solution with methanol. The intermediate solution was diluted with methanol to obtain a second intermediate solution at the concentration of 10 µg mL-1. BPA working solutions were prepared in methanol from the second intermediate solution at concentrations of 0.5, 1, 2.5, 5, and 10 µg mL-1. The low-concentration thermal paper quality control solution (TPQCL) contained 1.2 µg mL-1 of BPA, and the high-concentration thermal paper control solution (TPQCH) contained 7.5 µg mL-1 of BPA, both prepared by diluting the working standard solution with methanol. All solutions were stored at −18 ºC, when not in use.
Collection of urine samples
Urine samples were collected from 100 volunteers belonging to a university community in southern Brazil healthy volunteers in Novo Hamburgo, Brazil. The study was approved by the Institutional Review Board of Feevale University (54223221.5.0000.5348), and all participants provided informed consent. Volunteers were eligible if they were over 18 years old and willing to participate. Sample collection was conducted exclusively in the morning, with urine collected in sterilized polypropylene bottles and stored at −80 °C until processing. Urine samples were collected between June 2022 and March 2024.
Determination of BPA in urine
The protocol and liquid chromatography coupled to mass spectrometry (LC-MS/MS) parameters used for urine analysis are detailed in Souza et al.26 Briefly, urine samples (1 mL) were deconjugated with 100 µL of β-glucuronidase solution. After enzymatic hydrolysis, the urine samples were diluted with purified water SPE with Oasis HLB® cartridges (60 mg per 3 mL). The dried extract was derivatizated with dansyl chloride. Analyses were performed using an LC-MS/MS system composed of an Acquity UPLC I-Class chromatograph coupled to a Xevo TQS-micro triple quadrupole mass spectrometer, from Waters (Milford, USA). The chromatographic separation used an Acquity UPLC HSS T3 (2.1 × 100 mm, 1.8 μm) column, also from Waters. The method was linear from 0.10 to 25 ng mL-1, with calibration curves presenting correlation coefficients greater than 0.99. The method presented intra- and inter-assay precision of 3.77-12.62% and 5.3-18.1%, respectively, with 96.6-103.4% of accuracy and matrix effect of −1.2 to 3.5%.
BPA exposure assessment using urine concentrations
Equation 1 was used to determine the urinary BPA concentration adjusted for creatinine (UEcrea), where CBPA represents the urinary BPA concentration measured for each volunteer, and CCREA corresponds to the urinary creatinine concentration, quantified using a modified Jaffé method.
Additionally, equations 2 and 3 were applied to estimate the 24 h urinary creatinine excretion (CEsmoothed). Normalization of urinary BPA concentrations by creatinine corrects for variations in urine dilution, since creatinine is excreted at a relatively constant rate. This adjustment allows more accurate and comparable estimates of BPA exposure across individuals. Information on body weight (BW), age, and height was individually provided by each volunteer.27
The daily intake (DI) of BPA under the assumption of steady-state excretion was calculated using equation 4.
Collection of drinking water samples
Drinking water samples were collected from a public water supply point, as close as possible to the water treatment plant (29°41’24.9”S 51°07’41.6”W) in the city of Novo Hamburgo, Brazil, using a cold-water tap. The water had been previously treated by the local sanitation company and was intended for public consumption. The samples tap left running for 5 min before sample collection and stored in amber glass bottles, were kept refrigerated until delivery to the laboratory. A total of 24 sampling cycles were conducted biweekly over 12 months, from September 2021 to September 2022.
Determination of BPA in drinking water
BPA was extracted from aliquots of 200 mL of drinking water using automated SPE with Oasis® HLB cartridges (60 mg, 3 mL). The steps of the automated SPE procedure are outlined in Supplementary Information section. The dried extract was reconstituted with 100 µL of 0.1 M sodium bicarbonate and 100 µL of 2.5 mg mL-1 dansyl chloride, with 50 µL of an internal standard solution added. The mixture was vortexed for 2 min and incubated at 60 °C for 5 min at 900 rpm. A 10 µL aliquot were injected into the LC-MS/MS system. Analyses were conducted using an Acquity I-Class liquid chromatography system coupled with a Xevo TQ-S micro triple quadrupole mass spectrometer (both from Waters, Milford, USA). Chromatographic separation was achieved on an Acquity UPLC HSS T3 column (2.1 × 100 mm, 1.8 µm), maintained at 30 °C, with a mobile phase of ultrapure water with 0.1% formic acid (A) and acetonitrile with 0.1% formic acid (B) in gradient mode, starting with 35% A and decreasing to 5% A over 6 min. The total run time was 9 min, with the autosampler temperature set to 10 °C. Desolvation temperature and gas flow were set to 400 °C and 800 L h-1, respectively, with the source temperature at 150 °C. The mass detection system utilized positive electrospray ionization mode, and data acquisition was carried out in multiple reaction monitoring (MRM) mode. The monitored MRM transitions for the dansylated BPA were 695.2→156.2 m/z (quantification) and 695.2→171.2 m/z (qualification), with cone voltage set to 56 V and collision energies of 80 and 50 V, respectively. The method showed linearity from 5 to 1500 ng L-1, with calibration curves exhibiting correlation coefficients greater than 0.99, using a 1/x2 weighting factor. Intra-assay and inter-assay precision were 2.0-3.44%, with accuracy ranging from 98.37 to 103.05%. The extraction yield (EY) was 92.4-97.9%, with corrected matrix effect values ranging from −9.73 to −3.51%.
BPA exposure assessment using drinking concentrations
The daily intake (DI) due to drinking water ingestion was determined using equation 5, as outlined by the US EPA.28,29
The formula variables are described as follows: “C” is the concentration of the chemical in water (mg L-1), “IR” is the water consumption rate (3.2 L day-1, for a sedentary person and 4.6 L day-1 for a moderate physical activity at warm temperature (28-32 ºC), “EF” is the frequency of exposure in days per years (365 days years-1), “ED” is the duration of exposure in years (73.3 years in 2024 according to United Nations Department of Economic and Social Affairs, UNDESA),30 “BW” is the average body weight in kg (60 kg, according to the World Health Organization (WHO))31 and “AT” is the average time (AT = ED × 365 days years-1).
Collection of thermal paper samples
In this study, 100 thermal paper receipt samples were collected from various commercial establishments in the city of Novo Hamburgo, Brazil, during January 2025. The samples were obtained randomly and included receipts from markets, pharmacies, restaurants, general stores, gas stations, bookstores, stores, parking lots, among others. Each sample was carefully placed in an individual envelope, properly labeled, and stored at room temperature, away from direct sunlight, until analysis.
Determination of BPA in thermal paper
For the determination of BPA in the thermal paper samples, the receipts were cut into small pieces, approximately 2 mm in size, ensuring that areas without printing were analyzed to avoid interference from other compounds. The extraction procedure was conducted following the protocol described by Geens et al.32 A 30 mg portion of thermal paper, from the non-printed area, was cut and weighed into a 5 mL polypropylene tube. To this, 2 mL of methanol were added, and the mixture was subjected to vortex mixing, followed by sonication for 10 min. Following sonication, a 100 µL aliquot were diluted with 5 mL of methanol. An aliquot of 10 µL were injected into the column. The chromatographic analysis was performed using a Shimadzu Class VP system with a fluorescence detector. Chromatographic separation was achieved with a LiChrospher C18 column (4.0 × 125 mm, 5 μm) from Merck (Darmstadt, Germany). The mobile phase consisted of 1% acetic acid in water, acetonitrile, and methanol (60:35:5, v/v/v), with a flow rate of 0.9 mL min-1. The method exhibited linearity between 0.5 and 10 µg mL-1, with a limit of detection of 0.15 µg mL-1, corresponding to a concentration of 0.05 mg per 100 mg of BPA in a 30 mg thermal paper sample. The accuracy was from 102.70 to 109.90%, and precision between 1.88 and 1.96%.
BPA exposure assessment using thermal paper concentrations
The DI associated to exposure to thermal paper was calculated using equation 6, according to Semerjian et al.33
The formula variables are described as follows: “k” is the transfer coefficient from paper to skin, ranging between 1,072; 1,838;34 or 21,522 ng s-1 21 based on whether the skin was dry, wet, or very greasy;35 “C” is the concentration of BPA in thermal paper samples (µg g-1); “HF” is the handling frequency, estimated at 2 times per day for general population and 96 times for cashiers (based for a work shift of 8 h per day) (times day-1); “HT” is the handling time per event, estimated at 5 s for general population and 10 s for cashiers (based for a work shift of 8 h per day) (s time-1);33 “AF” is the absorption fraction of BPA through the skin, which may be 2.3 or 8.6% for skin explants,35 and 27% for living hands exposure following BPA application;32 “PC” is the average body weight in kilograms (set at 60 kg for both sexes).31
Estimation of the contribution of drinking water and thermal paper to the exposure to BPA
DIurine was considered as reference as it considers all sources of exposure. The values of DIwater and DIthermal paper were compared to DIurine and expressed as percentages.
Results and Discussion
Exposure using urinary concentrations
The participants were characterized as an urban population, mostly female (95%), with a median age of 24 years (22-29 years) and most of whom (66%) had a regular diet.
BPA was detected in 100% of the samples analyzed, with 99% of them showing quantifiable concentrations ranging from 0.11 to 63.69 ng mL-1. The median BPA level found was 0.86 ng mL-1. Urinary BPA concentrations, UEcrea and DI, according to exposure frequency and diet, are summarized in Table 1 and a more detailed discussion of these findings was recently published.26 Briefly, based on the urinary concentrations, the DI of BPA ranged from 0.002 to 1.58 µg kg-1 bw per day. These values are significantly below the currently accepted TDI of 4 µg kg-1 bw per day.36 The low exposure levels observed may be attributed to the gradual replacement of BPA with its analogs,37 although its widespread industrial use accounts for its presence in all samples.
Recently, the EFSA re-evaluated the scientific data on BPA and significantly lowered the TDI to 0.2 ng kg-1 bw per day.25 Under this new threshold, all participants would present exposures higher than the new threshold.
Exposure using drinking water concentrations
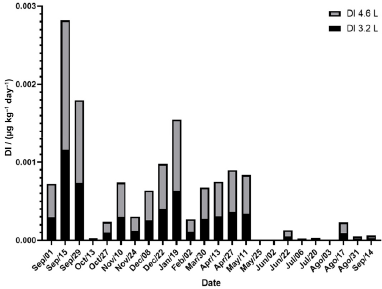
In the present study, BPA was detected in 100% of the samples analyzed, with concentrations ranging from < limit of quantification (LOQ) to 21.66 ng L-1 (Table 2). Studies carried out in different countries have identified the presence of BPA in drinking water, with values ranging from in 0-51.23 ng L-1 (Madrid),38 0.06-66.40 ng L-1 (Malaysia),39 < 1.06-683.0 ng L-1 (Milan),40 2-2,843.0 ng L-1 (India),15 and < 0.05-2,573.3 ng L-1 (Brazil).41 To estimate exposure, two scenarios were considered based on daily water intake: the sedentary scenario, with an average consumption of 3.2 L day-1, and the MFA (moderate physical activity) scenario, with an average consumption of 4.6 L day-1.
In this study, the highest concentrations were recorded in September 2021 and January 2022. Similar seasonal patterns were observed by Kumawat et al.,15 who analyzed BPA levels in drinking water and reported peak concentrations during the summer. Rajasärkkä et al.42 identified the release of BPA in water supply systems coated with epoxy resin in Finland, with the highest concentrations detected in hot water, reaching up to 23,174 ng L-1. These findings suggest that elevated temperatures accelerate resin degradation and promote contaminant leaching. Additionally, factors such as inadequate adhesion and progressive material degradation contributed to BPA release, particularly in hot water systems.42 Although heated water systems were not analyzed in the present study, these mechanisms may partially explain the higher BPA levels detected during warmer periods. In the Brazilian context, while January corresponds to the peak of summer and elevated temperatures, September marks the beginning of spring, a transitional period where temperatures start to rise compared to winter. The observed seasonal variation in BPA levels suggests that environmental factors and sporadic contamination sources may influence concentration dynamics. The occurrence of peak values in specific periods underscores the necessity of further investigations to identify potential contamination sources and assess their implications for water quality and public health.
Furthermore, the highest BPA concentration recorded in this study (21.66 ng L-1) exceeded the maximum level of 2.5 ng L-1 established by the European Union for drinking water by approximately 766%, indicating a potential concern from a regulatory perspective. However, when assessing potential health risks based on estimated DI, the maximum DI value (0.0017 µg kg-1 per day) accounted for only 0.0425% of the reference dose (RfD) of 4 µg kg-1 per day defined by the U.S. EPA. These findings highlight the importance of considering both concentration-based thresholds and exposure-based risk estimates in BPA assessments, as they may lead to different interpretations regarding public health implications. A summary of the detected concentrations is presented in Figure 1.
Daily intake (DI) values found in drinking water samples from September 2021 to September 2022.
All the samples analyzed in this study showed BPA concentrations significantly lower than health-based reference values, with a maximum value of 0.02166 µg L-1. This corresponds to only 0.87% of the parametric value established by the European Directive 2020/2184 of the European Parliament,18 which sets a limit of 2.5 µg L-1 for BPA in drinking water. These results indicate that, according to European Union standards, the water evaluated complies with current safety criteria. However, it is important to note that, to date, Brazilian legislation does not establish a specific maximum limit for BPA in drinking water, underscoring the importance of monitoring emerging contaminants in national water quality assessments and evaluating potential exposure risks.
Although the overlap between the sampling periods for drinking water and urine occurred only between June and September 2022, both collections were conducted over a sufficiently broad time frame to capture the expected variability in BPA exposure. It should be noted that the study did not assess whether volunteers consumed bottled water or water from other sources. However, no major changes were reported in the municipal water treatment and distribution processes during the study period, which supports the representativeness of the water samples and the validity of comparing the environmental and biological data obtained.
Exposure using thermal paper concentrations
A total of 100 thermal paper samples were collected from various commercial establishments, including markets, pharmacies, restaurants, bookstores, general stores, gas stations, and a range of other retail locations, as detailed in Table 3. Among the analyzed stores were cosmetics shops, clothing stores, chocolate boutiques, jewelry stores, lingerie shops, shoe stores, hardware stores, fabric stores, and cell phone accessory outlets. The sampling strategy was designed to ensure representative coverage of different regions of the city, aiming to capture the greatest possible diversity in both locations and types of thermal paper in use. Regarding the establishments analyzed, 27% of the samples were from markets, 12% from pharmacies, 9% from restaurants, 17% from general stores, 7% from petrol stations, 17% from stores and 1% other. Most of the samples analyzed (91%) consisted of white thermal paper, 7% were yellow thermal paper and only 2% were pink thermal paper. About the brands of thermal paper, 46% of the samples did not show any brand identification, 20% were brand A, 16% brand B, 6% brand C, 1% brand D, 6% brand E, 2% brand F, 1% brand G, 1% brand H and 1% brand I. In addition, 37% of the samples contained the inscription ‘BPA FREE’, while 63% did not have any kind of written identification.
The concentrations of BPA found in this study ranged from < limit of detection (LOD) to 24,218.8 ng mg-1. These values are comparable to those reported by Molina-Molina et al.,22 in thermal paper receipts from Brazil, France, and Spain (170-20,270 ng mg-1), although some differences may be due to variations in sample preparation, extraction solvents, and analytical methods. Additionally, BPA concentrations in this study align with findings from Argentina,43 Turkey (110-21,650 ng mg-1),44 and Switzerland (5,600-30,400 ng mg-1),45 reflecting widespread BPA contamination across diverse regions and matrices.
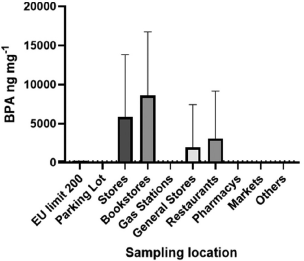
The concentrations of BPA in the samples analyzed are represented in Figure 2 and compared with the maximum permitted limit for BPA (200 ng mg-1), as established by the EU and in force since 2020.
As presented in Figure 2, all thermal paper samples with detectable BPA levels substantially exceeded the maximum limit set by the European Union (200 ng mg-1), represented by the initial bar positioned near zero. The highest mean concentrations were found in samples from gas stations and bookstores, reaching values close to 15,000 ng mg-1. Even in categories with lower average concentrations, such as restaurants and general stores, BPA levels remained well above the regulatory threshold. These results indicate a widespread use of thermal paper containing BPA across different commercial establishments and underscore the extent to which current exposures may surpass established safety standards.
BPA was detected in 15% of the samples analyzed, 47% of which came from stores, 27% from bookstores, 13% from restaurants and 13% from general stores. In terms of sample characteristics, 80% had no paper brand and 73% were white. All the thermal papers that had BPA concentrations higher than the LOD did not display the information “BPA FREE”. The levels of BPA detected in these samples ranged from 5,035.9 to 24,218.8 ng mg-1, with all values exceeding the maximum limit set by the EU.
Thermal exposure to BPA from handling thermal paper differs between the general population and occupationally exposed workers, such as cashiers. The general population is exposed sporadically and for shorter durations, typically during occasional contact with receipts. In contrast, cashiers, who work at fixed cashier stations in all establishments analyzed in this study, experience frequent and prolonged contact with thermal paper throughout their shifts, leading to higher potential BPA absorption. This study considers these differences by applying specific absorption fractions (AF) and transfer coefficients (k) for each group to estimate the DI of BPA, as detailed in Table 4.
Average daily intakes for the general population that presented thermal paper concentration value above the limit of quantification, considering different paper transfer coefficient and absorption factors
The analysis of dermal exposure to BPA through the handling of thermal papers revealed marked differences between the general population and cashiers working in commercial establishments. Although only 15% of the thermal paper samples analyzed contained quantifiable levels of BPA, the estimated potential exposure for individuals who handle these papers frequently and over extended periods remains significant.
For the general population, even in the most conservative exposure scenarios with an absorption factor of 27% and a transfer coefficient of 21,522 ng s-1, the estimated DI did not exceed 0.01604 µg kg-1 bw per day, indicating a low potential for health concern.
In contrast, cashiers were found to have substantially higher exposure levels. Under the worst-case scenario, the DI reached 1.59 µg kg-1 bw per day, representing approximately 40% of the former TDI of 4 µg kg-1 bw per day established by EFSA.46 However, when considering the current EFSA TDI (2023) of 0.2 ng kg-1 bw per day,25 the estimated exposure exceeds the safety threshold by nearly 8,000 times. Even though only a fraction of the papers contained BPA, the cumulative exposure for occupationally exposed workers may reach unacceptable levels, particularly in the absence of protective barriers such as gloves.
Recent studies indicate a significant reduction in the use of BPA in thermal paper in recent years, largely due to regulatory restrictions and market-driven substitutions with alternative compounds. Zhang et al.47 observed a sharp decline in BPA concentrations in taxi receipts issued between 2015 and 2017 in China, with 2015 levels being approximately six times higher than those detected in 2017. Similarly, Demierre et al.48 reported a drastic decrease in the presence of BPA in thermal papers in Switzerland: from 82.2% of samples in 2014 to 48.6% in 2019, and just 10.8% in 2021, suggesting the effectiveness of regulatory interventions and industry shifts toward less controversial alternatives.
The trend is further supported by Hormann et al.,34 who demonstrated that new compounds have been adopted as color developers, which explains the absence of quantifiable BPA in 85% of their thermal paper samples. Moreover, the printed surface of receipts was found to contain approximately 8.7 times more BPA than the unprinted side, indicating that thermal printing remains the primary vector of BPA exposure.
Among BPA substitutes, bisphenol S (BPS) has emerged as a widely used alternative. According to the European Chemicals Agency (ECHA, NR/20/22),49 between 2014 and 2022, the production of BPS-based thermal paper rose significantly, reaching 187 kilotons in 2019, an 80% increase over the previous year, while the use of BPA dropped by 43%, down to 136 kilotons. Demierre et al.48 also observed a growing presence of BPS in thermal paper: 3.1% in 2014, 14.6% in 2019, and 19.1% in 2021, despite the BPA ban. In addition to BPS, other alternatives such as N-(p-toluenesulfonyl)-N’-(3-p-toluenesulfonyloxyphenyl)urea (Pergafast 201), 4-hydroxyphenyl-4’-isopropoxyphenyl-sulfone (D-8), bis(2-chloroethyl)ether-4,4’-dihydroxydiphenyl sulfone copolymer (D-90), 4-[[4-(2-propen-1-yloxy)phenyl]sulfonyl]-phenol (BPS-MAE), and 2,2’-diallyl-4,4’-sulfonyldiphenol (TGSA) have been introduced as color developers, particularly in adhesive label applications. These data highlight a major shift in thermal paper formulation, reinforcing the need for continued monitoring of BPA substitute compounds and further investigation into their toxicological and environmental impacts.
Assessment of the relative contribution of drinking water and thermal paper to the concentration of contaminants in urine
The quantification of contaminants in various environmental and biological matrices is essential for identifying potential sources of human exposure. In this study, we assessed the relative contribution of drinking water and thermal paper to the total BPA burden detected in urine. To estimate the proportional impact of each exposure pathway on urinary concentrations, we applied equation 7, adapted from the U.S. Environmental Protection Agency (EPA),50 using the median values observed: 0.02 µg kg-1 bw per day via urine, and 0.0001 µg kg-1 bw per day from drinking water for sedentary individuals, or 0.0002 µg kg-1 bw per day for individuals with moderate physical activity.
Although the relative contribution of drinking water to overall BPA exposure was estimated to range between 0.5 and 1%, this pathway should not be entirely disregarded. Given that water consumption is continuous, daily, and lifelong, even low-level exposures may become relevant over extended periods. It is also important to note that the water was sampled from a single collection point, representing primarily the characteristics of the water produced by the treatment plant, which may be altered during distribution to the end consumer.
Regarding thermal paper, the impact on urinary BPA levels varies depending on the population group. For the general population, the contribution was like that of drinking water (approximately 0.9%), suggesting a limited role in overall exposure. However, for cashiers, who have frequent occupational contact with receipts, the contribution of thermal paper was markedly higher, with values exceeding 7500% of the median urinary intake. This finding indicates a potentially significant occupational exposure route, as shown in Table 5.
Combined relative contribution of exposures to the daily intake (DI) due to drinking water intake and thermal paper handling to BPA daily intakes estimated by biomonitoring in our study cohort (n = 100)
The present study has limitations. Particularly, other potential BPA exposure sources, particularly dietary intake, were not assessed. Since food is widely recognized as the primary source of BPA for the general population, future research should aim to include this exposure route to more accurately reflect real-world scenarios.
Conclusions
The findings of this study confirm the widespread presence of bisphenol A across multiple environmental and biological matrices-including drinking water, thermal paper, and human urine-indicating continuous human exposure to this compound. Although the BPA concentrations detected in drinking water samples remain within current regulatory thresholds, recent reductions in the TDI by EFSA suggest that exposure may be underestimated. Furthermore, the considerable levels of BPA detected in thermal paper highlight the relevance of dermal contact as a significant exposure route, particularly for occupationally exposed individuals. The progressive replacement of BPA with analogs such as BPS and Pergafast 201 emphasizes the importance of ongoing examination regarding the toxicological and environmental impacts of substitute compounds. Given the growing body of evidence linking BPA to potential health risks, this study reinforces the urgency of implementing stricter regulatory strategies and promoting the development of alternative materials to minimize public exposure to potentially harmful substances.
Acknowledgments
C. F. S., G. P. P., C. D. L. and A. P. B. were recipients of a graduate scholarships from CAPES, Brazil. M. F. B., M. V. A., R. Z. H. and R. L. are recipients of research scholarships from CNPq, Brazil.
Supplementary Information
Supplementary Information
Data Availability Statement
All data are available in the text.
References
-
1 Lopardo, L.; Petrie, B.; Proctor, K.; Youdan, J.; Barden, R.; Kasprzyk-Hordern, B.; Environ. Int. 2019, 125, 1. [Crossref]
» [Crossref] -
2 Claessens, J.; Pirard, C.; Charlier, C.; Sci. Total Environ. 2022, 815, 152734. [Crossref]
» [Crossref] -
3 Karzi, V.; Tzatzarakis, M. N.; Vakonaki, E.; Alegakis, T.; Katsikantami, I.; Sifakis, S.; Rizos, A.; Tsatsakis, A. M.; J. Appl. Toxicol. 2018, 38, 1144. [Crossref]
» [Crossref] -
4 Correia-Sá, L.; Kasper-Sonnenberg, M.; Schütze, A.; Pälmke, C.; Norberto, S.; Calhau, C.; Domingues, V. F.; Koch, H. M.; Environ. Sci. Pollut. Res. 2017, 24, 27502. [Crossref]
» [Crossref] -
5 Dekant, W.; Völkel, W.; Toxicol. Appl. Pharmacol. 2008, 228, 114. [Crossref]
» [Crossref] -
6 Willhite, C. C.; Ball, G. L.; McLellan, C. J.; J. Toxicol. Environ. Health, Part B 2008, 11, 69. [Crossref]
» [Crossref] -
7 Careghini, A.; Mastorgio, A. F.; Saponaro, S.; Sezenna, E.; Environ. Sci. Pollut. Res. 2015, 22, 5711. [Crossref]
» [Crossref] -
8 Arnold, S. M.; Clark, K. E.; Staples, C. A.; Klecka, G. M.; Dimond, S. S.; Caspers, N.; Hentges, S. G.; J. Exposure Sci. Environ. Epidemiol. 2013, 23, 137. [Crossref]
» [Crossref] -
9 Wang, H.; Liu, Z.; Zhang, J.; Huang, R.-P.; Yin, H.; Dang, Z.; Environ. Sci. Pollut. Res. 2020, 27, 3247. [Crossref]
» [Crossref] -
10 Baralla, E.; Pasciu, V.; Varoni, M. V.; Nieddu, M.; Demuro, R.; Demontis, M. P.; Sci. Total Environ. 2021, 785, 147263. [Crossref]
» [Crossref] -
11 Katsikantami, I.; Tzatzarakis, M. N.; Karzi, V.; Stavroulaki, A.; Xezonaki, P.; Vakonaki, E.; Alegakis, A. K.; Sifakis, S.; Rizos, A. K.; Tsatsakis, A. M.; Sci. Total Environ. 2020, 712, 135651. [Crossref]
» [Crossref] -
12 Ndaw, S.; Remy, A.; Jargot, D.; Robert, A.; Int. Arch. Occup. Environ. Health 2016, 89, 935. [Crossref]
» [Crossref] -
13 Banaderakhshan, R.; Kemp, P.; Breul, L.; Steinbichl, P.; Hartmann, C.; Fürhacker, M.; Chemosphere 2022, 286, 131842. [Crossref]
» [Crossref] -
14 Lane, R. F.; Adams, C. D.; Randtke, S. J.; Carter, R. E.; Water Res. 2015, 79, 68. [Crossref]
» [Crossref] -
15 Kumawat, M.; Sharma, P.; Pal, N.; James, M. M.; Verma, V.; Tiwari, R. R.; Shubham, S.; Sarma, D. K.; Kumar, M.; Sci. Rep. 2022, 12, 9252. [Crossref]
» [Crossref] -
16 Adjei, J. K.; Acquah, H.; Essumang, D. K.; Heliyon 2024, 10, e31815. [Crossref]
» [Crossref] -
17 Alves, M. C. P.; Pereira, A. R.; Sanson, A. L.; de Aquino, S. F.; Cad. Téc. Eng. Sanit. Ambient. 2023, 3, 95. [Crossref]
» [Crossref] -
18 European Parliament and Council; Directive (EU) 2020/2184 of 16 December 2020 on the quality of water intended for human consumption (recast); Official Journal of the European Union 2020. [Link] accessed in November 2025
» [Link] -
19 Loebel, O.; EurEau; Feedback on Initiative 13832: Food safety – restrictions on bisphenol A (BPA) and other bisphenols in food contact materials; 2024. [Link] accessed in November 2025
» [Link] -
20 European Commission; Draft Commission Regulation on the use of bisphenol A (BPA) and other Bisphenols and their Derivatives with Harmonised Classification for Specific Hazardous Properties in Certain Materials and Articles Intended to Come into Contact with Food, Amending Regulation (EU) No 10/2011, amending Regulation (EC) No 1895/2005 and repealing Regulation (EU) 2018/213. [Link] accessed in November 2025
» [Link] -
21 Biedermann, S.; Tschudin, P.; Grob, K.; Anal. Bioanal. Chem. 2010, 398, 571. [Crossref]
» [Crossref] -
22 Molina-Molina, J. M.; Jiménez-Díaz, I.; Fernández, M. F.; Rodriguez-Carrillo, A.; Peinado, F. M.; Mustieles, V.; Barouki, R.; Piccoli, C.; Olea, N.; Freire, C.; Environ. Res. 2019, 170, 406. [Crossref]
» [Crossref] -
23 European Commission; Commission Regulation (EU) 2016/2235 of 12 December 2016 amending Annex XVII to Regulation (EC) No 1907/2006 of the European Parliament and of the Council concerning the Registration, Evaluation, Authorisation and Restriction of Chemicals (REACH) as regards Bisphenol A; Official Journal of the European Union, 2016. [Link] accessed in November 2025
» [Link] -
24 Faÿs, F.; Palazzi, P.; Hardy, E. M.; Schaeffer, C.; Phillipat, C.; Zeimet, E.; Vaillant, M.; Beausoleil, C.; Rousselle, C.; Slama, R.; Appenzeller, B. M. R.; Sci. Total Environ. 2020, 747, 141185. [Crossref]
» [Crossref] -
25 Lambré, C.; Barat Baviera, J. M.; Bolognesi, C.; Chesson, A.; Cocconcelli, P. S.; Crebelli, R.; Gott, D. M.; Grob, K.; Lampi, E.; Mengelers, M.; Mortensen, A.; Rivière, G.; Silano, V.; Steffensen, I. L.; Tlustos, C.; Vernis, L.; Zorn, H.; Batke, M.; Bignami, M.; Corsini, E.; FitzGerald, R.; Gundert-Remy, U.; Halldorsson, T.; Hart, A.; Ntzani, E.; Scanziani, E.; Schroeder, H.; Ulbrich, B.; Waalkens-Berendsen, D.; Woelfle, D.; Al Harraq, Z.; Baert, K.; Carfì, M.; Castoldi, A. F.; Croera, C.; Van Loveren, H.; EFSA J. 2023, 21 e06857. [Crossref]
» [Crossref] -
26 de Souza, C. F.; Peteffi, G. P.; D. Loredo, C. D.; Bastiani, M. F.; Bondan, A. P.; Grassi, G. S.; Ferrareze, C. W.; Winter, P.; Hahn, R. Z.; Antunes, M. V.; Linden, R.; J. Braz. Chem. Soc. 2025, 36, e-20240226. [Crossref]
» [Crossref] -
27 Mage, D. T.; Allen, R. H.; Gondy, G.; Smith, W.; Barr, D. B.; Needham, L. L.; J. Expo. Sci. Environ. Epidemiol. 2004, 14, 457. [Crossref]
» [Crossref] -
28 U.S. Environmental Protection Agency (EPA); Risk Assessment Guidance for Superfund: Volume III – Part A, Process for Conducting Probabilistic Risk Assessment; Office of Emergency and Remedial Response, Washington, DC, 2001. [Link] accessed in November 2025
» [Link] -
29 Dourson, M .L.;Hertzberg, R. C.; Hartung, R.; Blackburn, K.; Toxicol. Ind. Health 1985, 1, 23. [Crossref]
» Crossref -
30 United Nations, Department of Economic and Social Affairs, Population Division; World Population Prospects 2024: Summary of Results; UN DESA/POP/2024/TR/NO. 9, United Nations: New York, 2024. [Link] accessed in November 2025
» [Link] -
31 Howard, G.; Bartram, J.; Williams, A.; Overbo, A.; Fuente, D.; Geere, J.; Domestic Water Quantity, Service Level and Health, 2nd ed.; World Health Organization: Geneva, 2020. [Crossref]
» [Crossref] -
32 Geens, T.; Goeyens, L.; Kannan, K.; Neels, H.; Covaci, A.; Sci. Total Environ. 2012, 435-436, 30. [Crossref]
» [Crossref] -
33 Semerjian, L.; Alawadhi, N.; Nazer, K.; PLoS One 2023, 18, e0283675. [Crossref]
» [Crossref] -
34 Hormann, A. M.; Vom Saal, F. S.; Nagel, S. C.; Stahlhut, R. W.; Moyer, C. L.; Ellersieck, M. R.; Welshons, W. V.; Toutain, P. L.; Taylor, J. A.; PLoS One 2014, 9, e110509. [Crossref]
» [Crossref] -
35 Bernier, M. R.; Vandenberg, L. N.; PLoS One 2017, 12, e0178449. [Crossref]
» [Crossref] -
36 European Food Safety Authority (EFSA); Scientific Opinion on the Risks to Public Health Related to the Presence of Bisphenol A (BPA) in Foodstuffs: Executive Summary; EFSA J. 2015, 13, 3978. [Link] accessed in November 2025
» [Link] -
37 Bocato, M. Z.; Cesila, C. A.; Lataro, B. F.; de Oliveira, A. R. M.; Campíglia, A. D.; Barbosa, F.; Environ. Res. 2020, 189, 109883. [Crossref]
» [Crossref] -
38 Valcárcel, Y.; Valdehíta, A.; Becerra, E.; López de Alda, M.; Gil, A.; Gorga, M.; Petrovic, M.; Barceló, D.; Navas, J. M.; Chemosphere 2018, 201, 388. [Crossref]
» [Crossref] -
39 Wee, S. Y.; Aris, A. Z.; Yusoff, F. M.; Praveena, S. M.; Sci. Rep. 2020, 10, 17755. [Crossref]
» [Crossref] -
40 Riva, F.; Castiglioni, S.; Fattore, E.; Manenti, A.; Davoli, E.; Zuccato, E.; Int. J. Hyg. Environ. Health 2018, 221, 451. [Crossref]
» [Crossref] -
41 Schmitt, G. T.; Caetano, M. O.; Marques, V. M.; Kieling, A. G.; Launay, M.; Acosta Muñiz, L. I.; Gomes, L. P.; J. Water Health 2023, 21, 1716. [Crossref]
» [Crossref] -
42 Rajasärkkä, J.; Pernica, M.; Kuta, J.; Lašňák, J.; Šimek, Z.; Bláha, L.; Water. Res. 2016, 103, 133. [Crossref]
» [Crossref] -
43 Nasello, S.; Beiguel, É.; Fitó-Friedrichs, G.; Irala, C.; Berenstein, G.; Basack, S.; Montserrat, J. M.; Environ. Sci. Pollut. Res. 2022, 29, 53382. [Crossref]
» [Crossref] -
44 Yalçin, M. S.; Geçgel, C.; Battal, D.; J. Turk. Chem. Soc., Sect. A 2016, 3, 167. [Crossref]
» [Crossref] -
45 Goldinger, D. M.; Demierre, A. L.; Zoller, O.; Rupp, H.; Reinhard, H.; Magnin, R.; Becker, T. W.; Bourqui-Pittet, M.; Regul. Toxicol. Pharmacol. 2015, 71, 453. [Crossref]
» [Crossref] -
46 Frederiksen, H.; Nielsen, J. K. S.; Mørck, T. A.; Hansen, P. W.; Jensen, J. F.; Nielsen, O.; Andersson, A. M.; Knudsen, L. E.; Int. J. Hyg. Environ. Health 2013, 216, 772. [Crossref]
» [Crossref] -
47 Zhang, J.; Wen, C.-y.; Li, Q.; Meteku, B. E.; Zhao, R.; Cui, B.; Li, X.; Zeng, J.; J. Chromatogr. A 2019, 1585, 27. [Crossref]
» [Crossref] -
48 Demierre, A. L.; Reinhard, H.; Zeltner, S.; Frey, S.; Regul. Toxicol. Pharmacol. 2024, 146, 105526. [Crossref]
» [Crossref] -
49 European Chemicals Agency; The Use of Bisphenol A and Its Alternatives in Thermal Paper in the EU during 2014-2022, ECHA-20-R-07-EN; European Chemicals Agency: Helsinki, Finland, 2020. [Link] accessed in November 2025
» [Link] -
50 U.S. Environmental Protection Agency; Fluoride: Exposure and Relative Source Contribution Analysis; Health and Ecological Criteria Division, Office of Water: Washington, D.C., 2010. [Link] accessed in November 2025
» [Link]
Edited by
-
Editor handled this article:
Andrea R. Chaves (Executive)