Investigating the Role of Molybdenum in the Corrosion Resistance of Electrodeposited Ni-Mo Alloys
Abstract
Ni-Mo alloys, promising candidates as environmentally safer alternatives to Cr coatings, were electrodeposited on a copper substrate. A full 22 factorial design was conducted to evaluate the effects of electrolyte pH (ranging from 4 to 8) and cathode rotation (10 to 50 rpm) on composition, microstructure, texture, and corrosion resistance. Results indicate that only pH significantly affects molybdenum content in the alloy, ranging from 15.81 to 49.65 at%. The increase in Mo content changed the surface morphology from nodular to compact, smooth, and crackled layer. Additionally, Ni-Mo alloys with Mo contents above 40 at% exhibited an anomalous growth along the less energetically favorable (2 2 0) crystallographic plane. Electrochemical measurements were carried out in 0.1 M NaCl, revealing an abnormal result: the alloy containing 39.47 at% Mo exhibited the lowest corrosion current (1.351 µA cm-2) and the highest charge transfer resistance (5.53 kΩ cm2). Overall, corrosion behavior appears to be predominantly governed by Mo content, while surface morphology and crystallographic texture exert a secondary influence. Thus, the alloy containing 39.47 at% Mo with nanocrystalline microstructure, is a promising material for anticorrosion coatings and surfaces.
Keywords:
passivation; electroplating; corrosion current; Ni-Mo alloys; anticorrosive coatings; Mo-containing alloys
Introduction
Chromium coatings are widely used for industrial applications to enhance visual appeal or improve the wear and corrosion resistance of metal surfaces.1,2 Traditionally, these coatings are electroplated from electrolyte solutions containing highly toxic and carcinogenic hexavalent chromium.3 Consequently, countries like the United States and China have imposed restrictions on CrVI in electrodeposition processes, driving the development of safer alternatives.4
Nickel based alloys, especially those incorporating molybdenum, have emerged as promising alternatives not only due to their notable corrosion resistance, especially within pitting corrosion media (e.g., seawater), but also as a less toxic and safer synthesis process compared to hard chrome coatings.5-9 It is well established that molybdenum plays a key role in enhancing corrosion resistance by promoting surface passivation.10,11 Indeed, studies have shown that the native air-formed oxide film on these alloys typically contains molybdenum oxides.12 These oxides are believed to improve the stability of the passive film by hindering the penetration of highly corrosive ions, such as chloride.13,14 Other studies, however, suggest that molybdenum contributes to the self-repair of the oxide layer.15,16 In this process, the precipitation of molybdenum species happens at transpassive potentials and their redissolution at passive potentials.15 Nevertheless, the role of Mo in preventing corrosion remains not fully understood due to its paradoxical effect on corrosion resistance: while higher Mo content enhances the intrinsic corrosion resistance of the films, it also increases the density of sites susceptible to corrosion initiation, such as crystallite boundaries, cracks, and triple junctions, thereby compromising the protective quality of the coatings.17-19 This feature indicates the existence of an optimal Mo content that balances defect and stable passive layer formation.8,12,20
Electrodeposition is a relatively simple and cost-effective technique for producing Ni-Mo alloys. During deposition, nucleation and growth occur through the “induced co-deposition” mechanism, in which nickel is first deposited and subsequently induces the reduction of molybdenum.21 The composition, microstructure, and thickness of the Ni-Mo alloys are strongly influenced by electrodeposition parameters, such as temperature, current density, pH, and cathode rotation.22-24 For example, Bigos et al.25 reported that Mo content increased in Ni Mo alloys up to pH 7, with films below this pH exhibiting compact and crack-free microstructures. In contrast, To et al.,26 reported the formation of microcracks within deposits at acidic pH. Moreover, increasing the pH was found to reduce the nodular density of the alloy morphology. In nickel-rich solutions (Ni/Mo molar ratio > 4), Mo reduction is limited by mass transport.27 Thus, changes in hydrodynamic conditions can decrease the diffusion layer thickness and enhance the transport of Mo ions to the cathode. For example, an increase in rotating speed of the disc electrode from 0 to 640 rpm, increased the Mo content from about 1.8 to 12.5%.25
Although these studies have provided valuable insights, a comprehensive understanding of the combined effects of Mo content and deposition parameters on the microstructure, composition, and corrosion performance of Ni-Mo alloys remain incomplete. To address this gap and gain deeper insight into the role of Mo in the morphology and corrosion resistance within seawater like systems, we employed an experimental design approach to systematically investigate the effects of electrolyte pH and cathode rotation on the corrosion behavior of Ni-Mo alloys.
Experimental
Electrolyte composition and deposition conditions
The electrodeposition of the Ni-Mo alloy was carried out in a two-electrode system. The electrolyte was prepared by dissolving 1.84 g of NiSO4·6H2O, 0.21 g of Na2MoO4, and 2.43 g of ammonium citrate in 50 mL of distilled water. Ammonium citrate acted as a stabilizing agent, and the concentrations of the metal salts were chosen based on previous studies.17 A copper plate (2.0 × 2.0 × 0.1 cm), which served as working electrode, was polished on both sides with sandpaper, followed by chemical treatment in 10% (m/v) NaOH and 1% (v/v) H2SO4 for 1 min each.18 A cylindrical platinum mesh (3.0 cm in diameter and 3.8 cm in height) was used as the counter-electrode. The Ni-Mo alloy was electrodeposited on both sides of the copper substrate at a constant current of 40 mA, supplied by a Rasatronic model RP0002 rectifier, for 60 min at room temperature.
The Ni-Mo alloy deposition efficiency (ε) was calculated by equation 1, where m is the alloy mass (g), t is the deposition time (s), i is the total current (A), wj is metal j mass fraction in alloy, estimated by energy dispersive X-ray (EDX), nj is number of electrons transferred for each metal j atom, Mj is metal j atomic mass in g mol-1 and F is the Faraday constant, 96485.34 C mol-1.
Effect of electrolyte pH and cathode rotation on Ni-Mo alloy composition
A full 22 factorial design with three replicates at the center point was chosen to investigate the effect of electrolyte pH and cathode rotation on the molybdenum mass fraction in the Ni-Mo alloy. The factor levels were defined based on preliminary tests, even though values above 50 rpm are unlikely to produce pronounced hydrodynamic effects and should be interpreted as screening-level variable with limited expected impact. The range was chosen based on our system limitation (platinum mesh dimensions) and unsuccessful electrodeposition tests with higher rotation values. The experimental design matrix, including both coded and actual factor values, is presented in Table 1. Statistical analysis was performed using Statistica (version 7.0, StatSoft Inc., USA, 2007). For cathode rotation, the copper substrate was attached to an Ametek rotor, with the rotation axis perpendicular to its surface, thus operating as a rotating disk electrode. The electrolyte pH was adjusted by the addition of ammonium hydroxide or sulfuric acid.
Ni-Mo alloys characterization
The crystal structure was examined by powder X-ray diffraction (XRD) using a Philips Analytical X-ray diffractometer (model X’Pert-MPD) with a copper Kα radiation source (λ = 1.541 Å) operated at 40 kV and 0.040 A. Data were collected over a 2θ range of 35-90° with a step size of 0.02° and a scanning rate of 0.033° s-1. The crystallite size (D) of the Ni-Mo alloys was calculated using Scherrer equation (equation 2), where K is the Scherrer constant (commonly taken as 0.9), λ is the X-ray beam wavelength, β is the full width at half maximum of the peak, and θC is the Bragg angle at peak center position.28
The morphology of the Ni-Mo alloys was obtained using a scanning electron microscope (SEM, LEO Electron Microscopy/Oxford model 440i) equipped with an energy dispersive X-ray (EDX) spectrometer (model 6070). The acceleration voltage was set to 20 kV, with a beam current of 0.6 × 10⁻⁶ A. Semiquantitative EDX analyses were conducted to map the elemental distribution and estimate the atomic fractions (at%) of the alloys.
Results and Discussion
Statistical analysis of pH electrolyte and cathode rotation on Mo content
The influence of the pH electrolyte and cathode rotation in the composition of the Ni-Mo alloy and deposition efficiency are shown in Table 2. The low molybdenum content variation obtained at the central point indicates a good reproducibility of the deposition process. According to the statistical analysis, only the electrolyte pH significantly affected the molybdenum content (p < 0.05). This observation is due to the relative low cathode rotation speeds, which were insufficient to overcome the mass transfer limitations of Mo in Ni-rich solutions (Ni/Mo ratio > 4).26,29
The distribution of electrochemically active species in the electrolyte is strongly dependent on pH. At near-neutral pH, the concentration of electro active molybdenum-citrate complexes is higher, promoting Mo reduction.25,30 It reflects the sharp increase in Mo content observed at pH 6 and 8 compared to pH 4 (Table 2). Additionally, the slight decrease in Mo content at pH 8 relative to pH 6 may result from the higher formation constant of NiII-citrate complexes in basic media than that of MoVI-citrate complexes, increasing the Ni reduction rate.25,26,30 Although Beltowska-Lehman and Indyka27 suggest that ammonium salts can improve Ni reduction through the formation of nickel-ammonia complexes, this effect appears negligible here, as indicated by the similar cathodic current efficiencies at pH 6 and 8. The alloy mass per unit of deposition area (malloy) is also listed in Table 2.
The cathodic current efficiency sharply decreased (from ca. 34% to ca. 15%) once the Mo content exceeded ca. 17% (Table 2). It may be ascribed to the progressive blocking of the cathode surface by multi-valence molybdenum oxides or increased hydrogen evolution resulting from the low hydrogen overvoltage on molybdenum.31 Specifically, several studies25,27,31 have shown that the over potential for the hydrogen evolution reaction significantly decreases when the Mo content exceeds 20 at%.
Ni-Mo alloys characterization
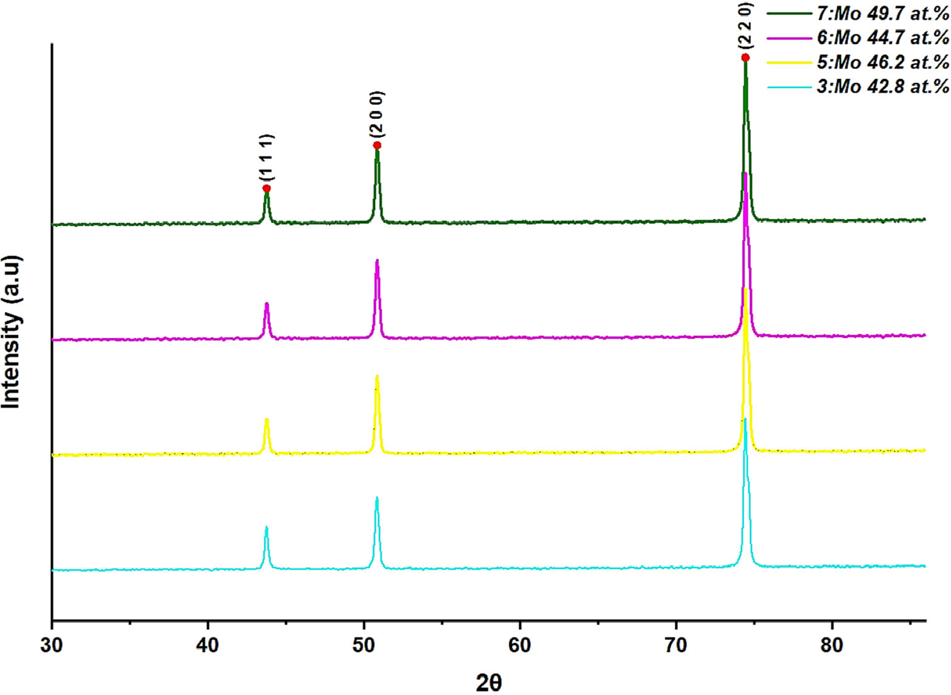
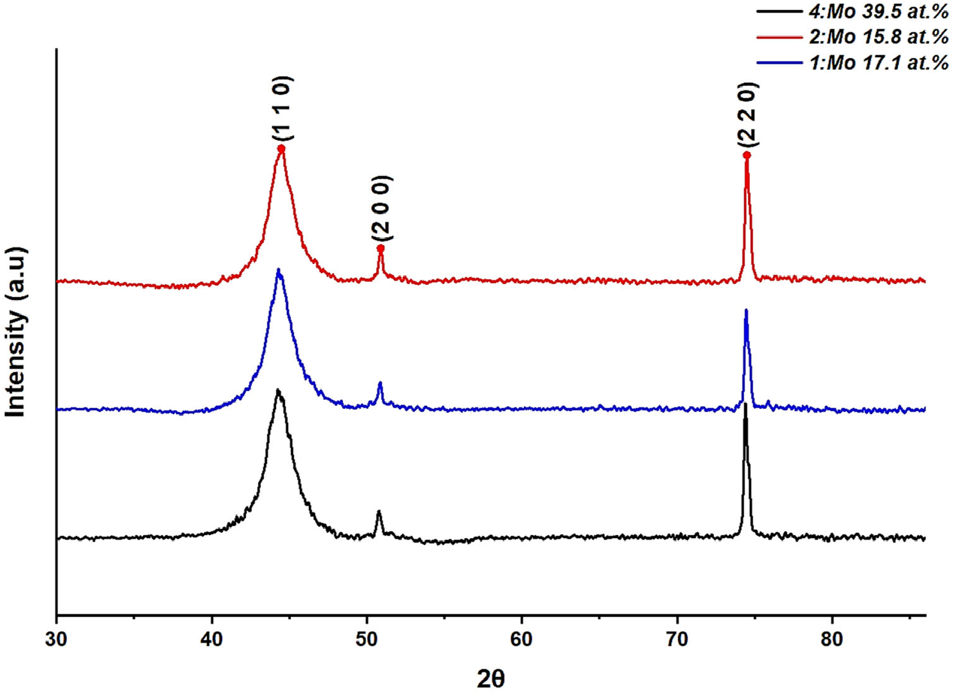
The experimental runs were characterized by XRD and illustrated in Figures 1 and 2. The XRD patterns show no distinct peaks corresponding to Mo or Ni-Mo inter metallic, which is consistent with the formation of a face-centered cubic of molybdenum in nickel (JCPDS card, No. 04-0850).32 Particularly, the diffraction peak located at 2θ = 44° corresponds to the (111) plane of Ni, while the peaks at 2θ = 51 and 75° correspond to Ni (200) and (220), respectively. At lower Mo contents (< 40 at%), the Ni-Mo alloys exhibit a nanocrystalline microstructure and (111) preferred orientation with comparable crystallite sizes (see Figure 2 and Table 3). In contrast, when the Mo content exceeds 40 at%, the (220) diffraction peak becomes more pronounced than the (111) peak, suggesting the anomalous development of a strong {110} texture (Figure 1). For these alloys, the crystallite size increased to 21.4 nm, reflecting a higher degree of crystallinity. These results diverge from the established literature, which consistently reports the disappearance of the (220) and (200) reflections for Mo contents above ca. 20 at%.33-35 It is well established that increasing the Mo content in Ni-Mo alloys induce severe lattice distortions in Ni, which lead to the breakdown and a transition of the microstructure from microcrystalline to nanocrystalline/quasi-amorphous phases.17 There are two possible explanations for the unusual development of a {110} texture in our Ni-Mo alloys with high Mo content. First, Mo contents above 40 at% may reduce hydrogen adsorption, which is known to inhibit crystalline growth by decreasing the surface mobility of diffusing atoms.36 Second, Mo can induce anisotropic grain yielding of Ni, whereby [110] oriented grains yield first. In this mechanism, the texture evolution from {111} to {220} in Ni and Ni-Mo alloys is governed by Ni diffusion along grain boundaries.37
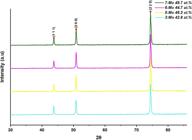
XRD patterns of Ni-Mo alloys for runs 3, 5, 6 and 7 exhibiting pronounced (220) diffraction peaks.
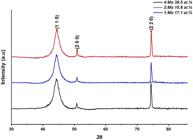
XRD patterns of Ni-Mo alloys for runs 1, 2, and 4 exhibiting features consistent with nanocrystalline structures.
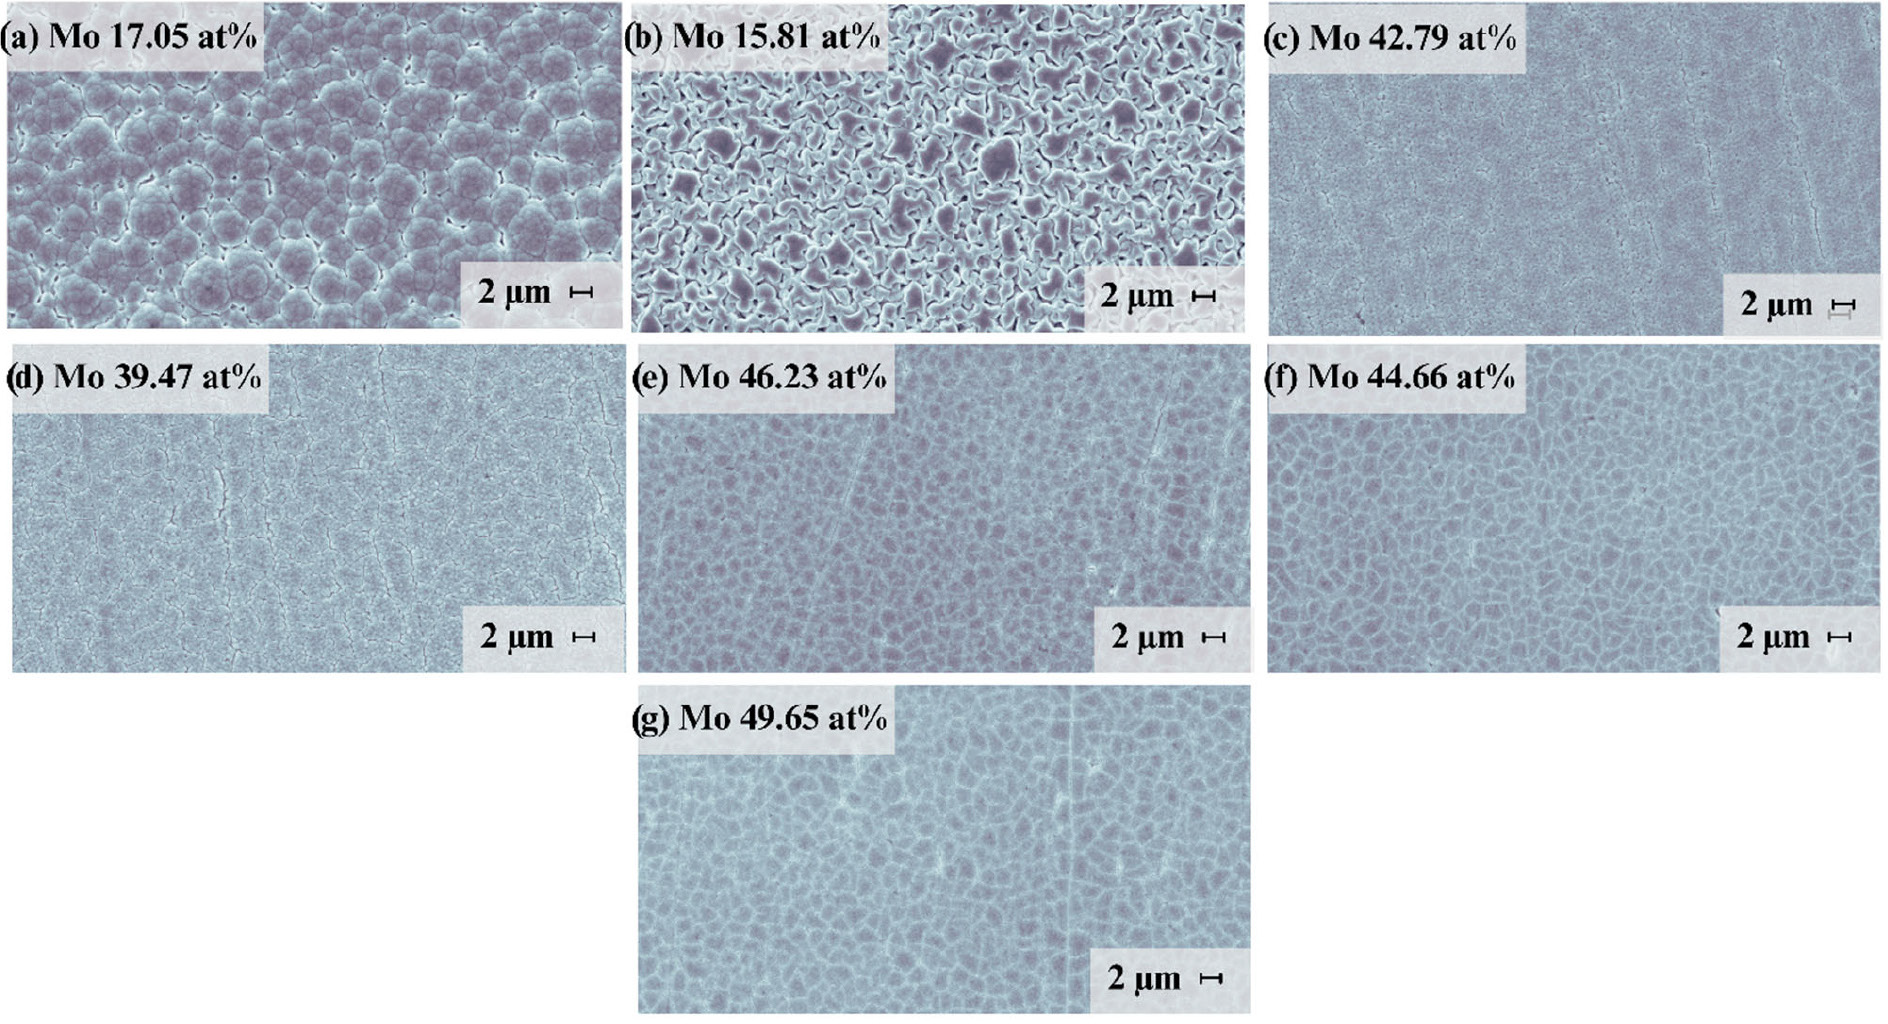
Figure 3 shows the SEM images of Ni-Mo alloys for all experimental runs. At the lowest Mo content (Figure 3b), the sample surface exhibited an irregular smooth nodular morphology with some voids around the nodules, suggesting limited coalescence during deposition. The sample with slighter increase in Mo content on (Figure 3a) showed a rough porous like morphology. Looking over the increasing Mo content on the rest of the samples, the nodular and porous structure gave place to a more compact and smooth coating with some microcracks across the samples surface (Figures 3c-3g). The formation of these cracks is often associated with severe tensions within the coating caused by the incorporation of Mo atoms into the Ni lattice, or with hydrogen embrittlement during the electrodeposition process.12,38-40 These results indicate that the alloy morphology is influenced by the Ni-Mo surface composition. Moreover, the alloys with higher Mo contents (Figures 3e-3g) exhibited a crackled surface with well-defined grain boundaries. This morphological feature appears to be more closely related to the Mo content than to the texture evolution observed by XRD, where the preferred crystallographic orientation shifted from {111} to {110}, as evidenced by run 4, which did not display similar surface characteristics.
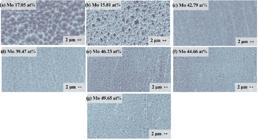
SEM micrographs of Ni-Mo alloys obtained from experimental runs: (a) run 1: porous like morphology, (b) run 2: nodular smooth morphology porous, (c) run 3, (d) run 4, (e) run 5, (f) run 6, and (g) run 7 with smooth and compact morphology with well-defined grain boundaries and lesser cracks for the last 3 samples.
Corrosion resistance
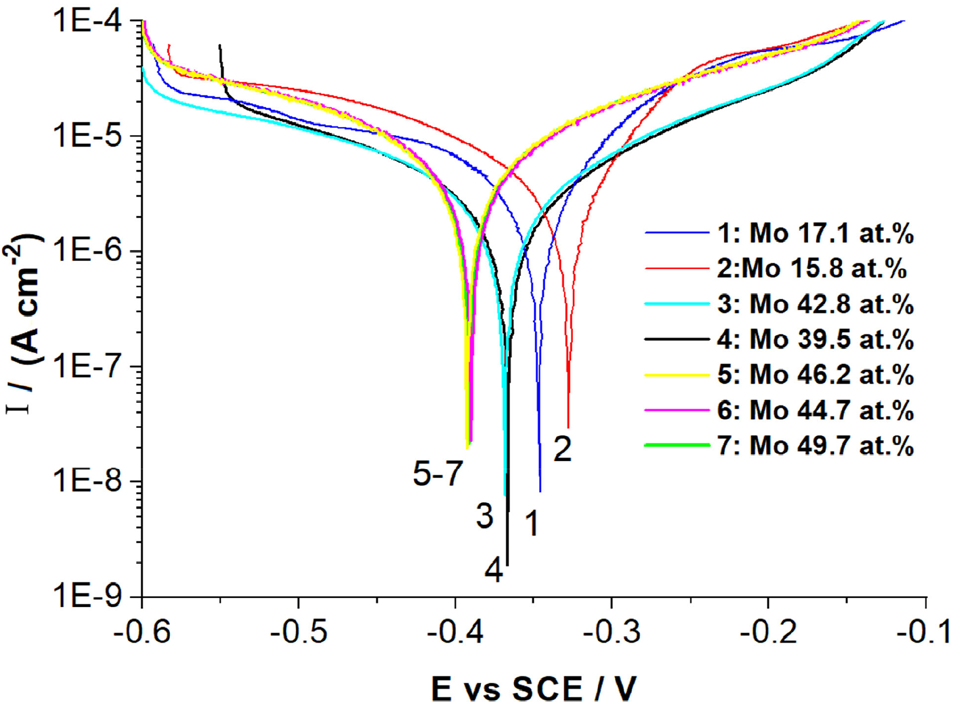
The polarization curves obtained for all experimental runs are shown in Figure 4, and the corresponding corrosion parameters are summarized in Table 3. The potential windows used for Tafel’s adjustments were between -0.111 and -0.602 V, the extrapolations were performed even though the systems exhibit early passivation in 0.1 M NaCl, under such conditions icorr are limited to be interpreted as qualitative trends and therefore to confirm any hypothesis raised on these extracted values future experiments with dilute HCl solutions must be performed. In Figure 4, a rapid increase in current density at potentials slightly above the corrosion potential due to the nickel dissolution can be observed. The released NiII species, together with the deposited Mo, contribute to the formation of a mixed oxide/hydroxide passive film on the alloy surface, which acts as a protective corrosion barrier.12 Mo is also reported to enhance repassivation behavior and pitting corrosion resistance. Some studies41-44 suggest that, especially within the aggressive pit environment, the presence of molybdate ions MoO42- resulting from Mo dissolution can block chloride ions Cl- adsorption and further dissolution, thereby hindering pit growth.
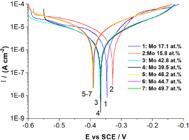
Potentiodynamic polarization curves of Ni-Mo alloys obtained from runs 1-7 after 24 h in 0.1 M NaCl solution at room temperature.
The formation of the passive layer manifests as a current density plateau in the anodic branch. As shown in Figure 3, runs 3-7 display a well-defined passive region between -0.33 and -0.15 V, whereas a much narrower potential window (-0.25 to -0.15 V) is observed for runs 1 and 2. The shortened passive range observed for runs 1 and 2 can be attributed to the lower Mo content in the alloy, which delays the formation of a protective oxide/hydroxide layer. Moreover, although the runs 3-4 and 5-7 exhibit similar passive potential windows, the plateau current densities for runs 3 and 4 are lower, indicating a more stable passive layer.
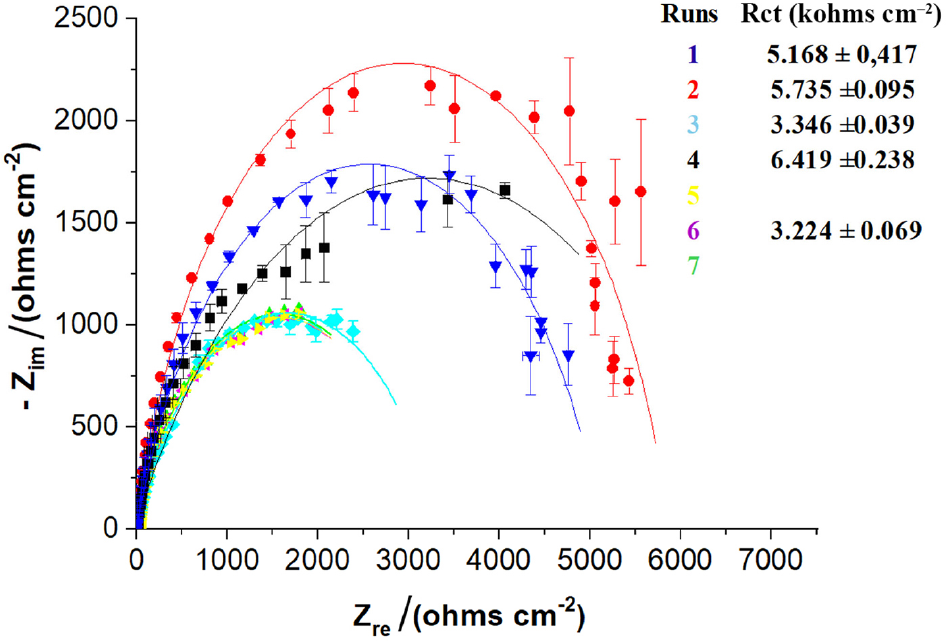
Previous works5,12,45 reported Mo content, grain size and surface roughness as strong influent factors on the corrosion resistance of Ni-Mo coatings, higher Mo contents increase intrinsic corrosion resistance, but it also leads to grain size refining and more boundaries regions that promote the corrosion process, diminishing the overall protective effect of the passive film in the alloys. The SEM images for runs 5-7 indicate a similar trend, samples exhibited an apparent higher density of grain boundaries and the lowest charge transfer resistance (Rct) and highest icorr values (Table 4). These observations, while consistent, must be confirmed with post-corrosion SEM or high-resolution microstructural analysis in future experiments. Specifically, the Ni-Mo alloy from run 4 containing 39.47 at% Mo exhibited the lowest icorr value (1.351 µA cm-2) and highest Rct value (6.419 kΩ cm2) suggesting potentially higher protection against corrosion. In addition, comparing the high Mo content alloys (runs 3-7), the alloy from run 4 is characterized by the smaller grain size, in agreement with Huang et al.,46 which reported the same behavior on Ni-Mo deposits containing 26-31 wt.% of molybdenum.
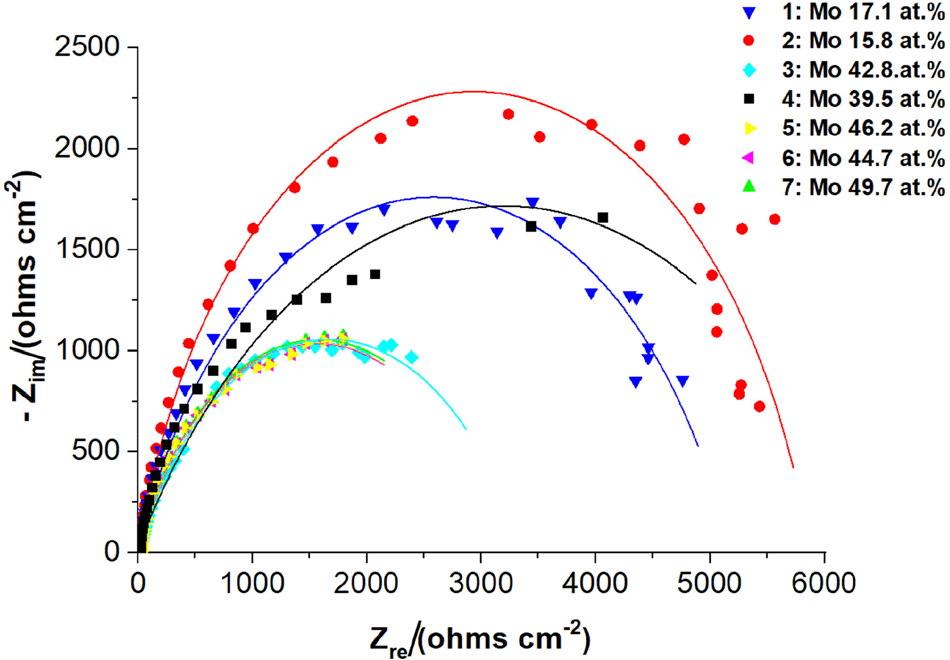
Electrochemical impedance spectroscopy (EIS) was carried out to further investigate the corrosion mechanism of the electrodes. Figures 5 and 6 displays the Nyquist plots for all experimental runs. For all alloys, the Nyquist diagrams exhibit a single semicircle, indicating that the corrosion is dominated by an activation-controlled charge transfer process at the electrode surface.17,47 It is observed for nanocrystaline Ni-Mo alloys that Rct increased with increasing Mo content, suggesting a major intrinsic corrosion resistance for high Mo contents. Indeed, the EIS data calculated from the Nyquist and summarized in Table 4 exhibited the Rct for the Ni-Mo alloy containing 15.81 at% Mo (run 2) of 5.735 kΩ cm2. The Rct obtained for the alloy containing 39.47 at% Mo (run 4) was 6.419 kΩ cm2. These findings seem to be according to Tafel’s analysis (Table 3), as it is generally expected that the alloy with the lowest icorr would also display the highest Rct.34,35,48 These results are likely associated with mass loading. As shown earlier in Table 2, the alloy mass for area (malloy) dropped from 0.0164 to 0.006 g cm-2 for these alloys. It means that the mass loading, of run 1 and 2 was significantly higher. Assuming the mass was homogeneously distributed, a thicker film would likely increase the barrier for interfacial charge transfer. In this regard, the high icorr observed for these alloys can be attributed either to the limited repassivation ability associated with the low Mo content or, alternatively, to the apparent higher alloy porosity (Figures 3a and 3b), which could facilitate electrolyte penetration into the alloy surface.18,19,49 To confirm these hypothesis new experiments and thickness measurements such as profilometry or cross-sectional SEM should be performed.
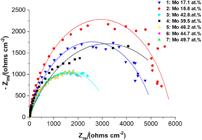
Nyquist plot of Ni-Mo alloys obtained from runs 1-7 after 24 h in 0.1 M NaCl solution at room temperature.
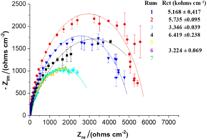
Nyquist plot of Ni-Mo alloys from runs 1-7 with Rct values and fitting model standard deviations.
Additionally, the corrosion potential (Ecorr) analysis can further support this interpretation, as these alloys exhibited the most positive value (-0.355 and -0.331 V), as shown in Table 3. A more positive Ecorr reflects higher thermodynamic stability of the alloy against oxidation.
The analysis of Rct values highlights the interplay between Mo content, crystallographic texture, and surface morphology on the corrosion resistance of the Ni-Mo alloys. The runs 3, 5, 6, and 7 exhibit similar deposition efficiencies and share a (220) preferred growth orientation. Consequently, their comparable Rct values indicate that the crackled surface morphology observed in runs 5-7 has little or no effect on corrosion stability. In contrast, run 4 exhibits an Rct approximately 1.2 times higher than that of run 3. As the main difference lies in the preferred crystallographic orientation and crystallite size, this suggests that texture can play a significant role in enhancing interfacial corrosion resistance.
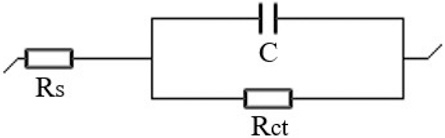
Figure 7 presents the equivalent circuit, indicating a small electrical resistance to the electrolyte in the high-frequency region and the capacitive arc of the electrical double layer. Randles equivalent circuits were applied to adjust the data. The equivalent circuits of the Nyquist diagrams are associated with a circuit configuration including constant phase element (CPE), which characterizes an imperfect capacitor, the electrolyte resistance (Rs), and the coating resistance (Rct).
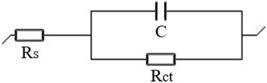
Equivalent circuit model of the electrode/electrolyte interface: Rs is the solution resistance, Rct is the charge transfer resistance, and C is the double-layer capacitance.
Warburg-type impedance exhibits capacitive behavior at low frequencies, a feature not observed in this study.50 The CPE model is the replacement of the double layer capacitance in electrodes with a rough, porous appearance, or composed of passivated films and coatings.51-53 These types of electrodes showed frequency dispersions generated by the heterogeneity of the interface.53
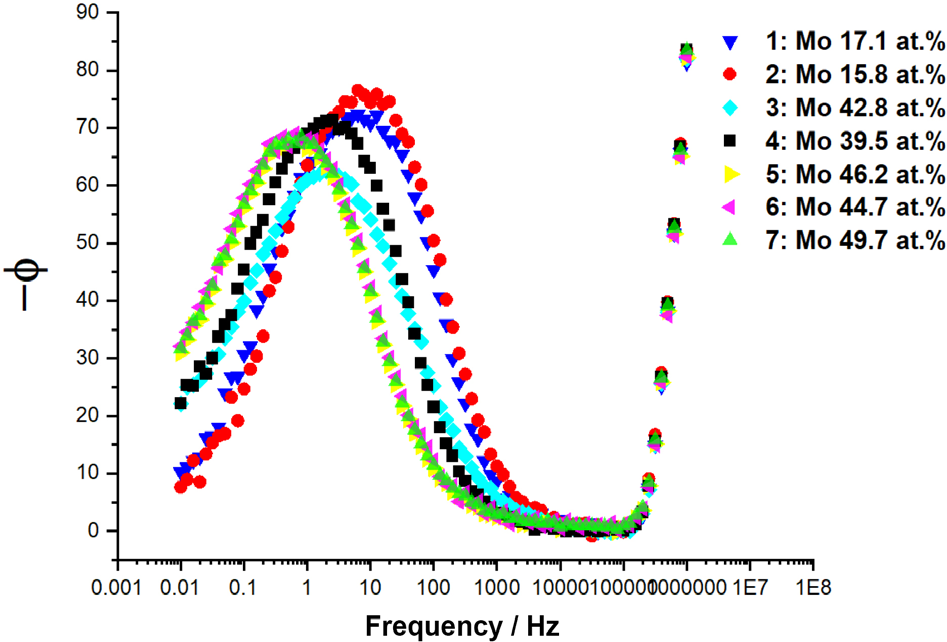
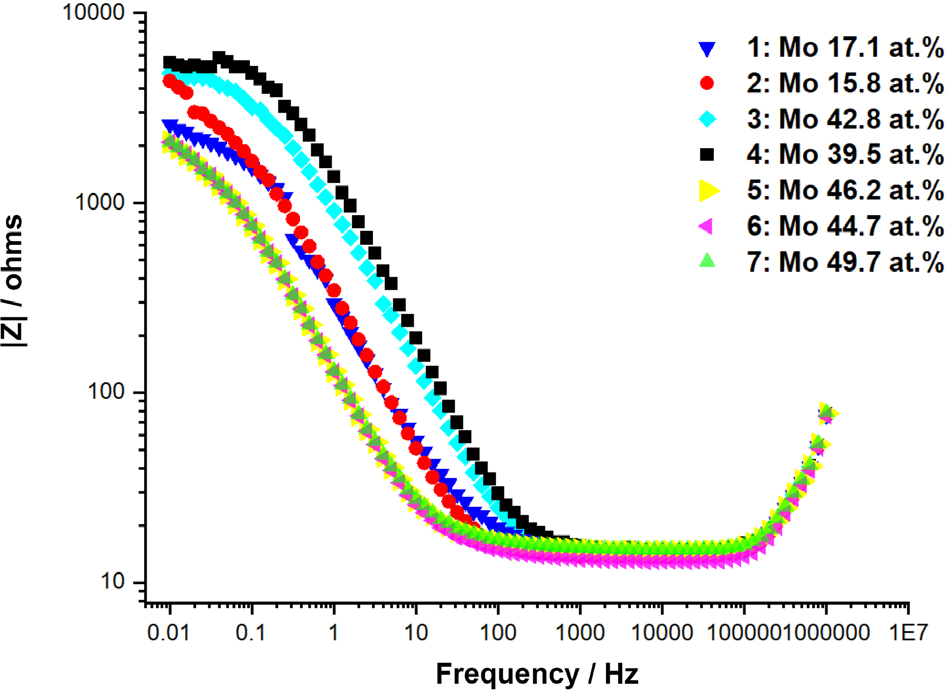
The Bode plots in Figures 8 and 9 compare experiments with different containing Mo. The corrosion processes were the same in all electrode surfaces, where the electrical double layer was represented by one angle phase peak at low frequencies. In high frequencies, the impedance corresponds to electrolyte resistance, which shows initial process stabilization after 1 h in open-circuit potential. The processes at the electrode surface indicate a single time constant in which the charge transfer process controls the electrochemical events on the surface of the specimens. The impedance and phase angle maximum (Figure 7) in the high-frequency region indicates a decrease in the protective properties of the coating. Likewise, higher impedance values can be correlated with enhanced corrosion protection.
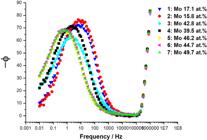
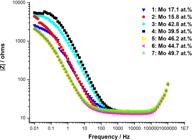
The Rct resulting from the adjustment of the EIS tests was consistent with the icorr values obtained from the Tafel extrapolation, demonstrating a high corrosion resistance of experiment 4. The results of n were between 0.5 and 1, n values close to 1 indicate the electrode surface is rough. Almost all experiments showed similar Rs.
Conclusions
A full factorial 22 design was employed to investigate the influence of electrolyte pH and cathode rotation on the molybdenum content of Ni-Mo alloys electrodeposited on a copper substrate. Statistical analysis indicated that only electrolyte pH had a significant influence on Mo incorporation, while the Mo content in the alloys ranged from 15.81 to 49.65 at%, strongly influencing the morphology and texture. The Mo content in the alloys ranged from 15.81 to 49.65 at%, strongly influencing the morphology and texture. Alloys with lower Mo contents exhibited nodular surfaces, while higher Mo contents resulted in compact, smooth, and crackled films. Notably, alloys containing more than 40 at% Mo displayed anomalous growth along less energetically favorable crystallographic planes. The potentiodynamic studies revealed that the Ni-Mo alloy, obtained at a pH of 8 and a cathode rotation speed of 50 rpm, with 39.47 at% Mo, exhibited a promising high corrosion resistance as indicated by the lowest icorr, likely reflecting a great balance between defect formation and passive layer stability. However, to further validate these findings, future experiments in dilute HCl solutions are required to confirm the stability of the alloy in more aggressive acidic environments. In contrast, EIS measurements showed that alloys with lower Mo content also presented high Rct values, which was attributed to the higher mass loading. Overall, the results suggest that crystallographic texture exerts a stronger influence on corrosion resistance than surface morphology. These findings provide important insights into the interplay between alloy composition, microstructure, and electrochemical performance, revealing qualitative trends that offer guidance for the design of Ni-Mo alloys with enhanced corrosion protection.
Acknowledgments
The authors wish to acknowledge the partial financial support of CAPES - Finance Code 001.
Data Availability Statement
The authors confirm that the data supporting the findings of this study are available within the article and its supplementary information section.
References
- 1 Hashmi, M. S. J.; Comprehensive Materials Processing; Elsevier: Amsterdam, 2014, ch. 1.
-
2 Protsenko, V. S.; Reactions 2023, 4, 398. [Crossref]
» Crossref -
3 Luo, M.; Duan, W.; Li, S. W.; Yang, Y.; Yang, G.; Li, H.; Yu, X.; Environ. Technol. Innovation 2024, 36, 103876. [Crossref]
» Crossref -
4 Tian, X.; Chen, S.; Zhu, F.; Cai, Z.; Wang, L.; J. Cleaner Prod. 2024, 476, 143768. [Crossref]
» Crossref -
5 Wen, Y.; Zhao, Y.; Zhang, Z.; Wu, Y.; Zhu, H.; Xu, K.; Liu, Y.; J. Manuf. Processes 2024, 119, 929. [Crossref]
» Crossref -
6 Yang, G.; Peng, W.; Chen, Z.; Li, S.; Han, Q.; Hu, R.; Yuan, B.; ACS Appl. Mater. Interfaces 2024, 16, 28578. [Crossref]
» Crossref -
7 Luo, M.; Yang, J.; Li, X.; Eguchi, M.; Yamauchi, Y.; Wang, Z. L.; Chem. Sci. 2023, 14, 3400. [Crossref]
» Crossref -
8 Wasekar, N. P.; Verulkar, S.; Vamsi, M. V. N.; Sundararajan, G.; Surf. Coat. Technol. 2019, 370, 298. [Crossref]
» Crossref -
9 Gholizadeh, T.; Etminanfar, M. R.; Parvini Ahmadi, N.; Mahdavi, S.; J. Mater. Res. Technol. 2024, 30, 2322. [Crossref]
» Crossref -
10 Pardo, A.; Merino, M. C.; Coy, A. E.; Viejo, F.; Arrabal, R.; Matykina, E.; Corros. Sci. 2008, 50, 1796. [Crossref]
» Crossref -
11 Lynch, B.; Wang, Z.; Ma, L.; Paschalidou, E.-M.; Wiame, F.; Maurice, V.; Marcus, P.; J. Electrochem. Soc. 2020, 167, 141509. [Crossref]
» Crossref -
12 Laszczyńska, A.; Tylus, W.; Winiarski, J.; Szczygieł, I.; Surf. Coat. Technol. 2017, 317, 26. [Crossref]
» Crossref -
13 Wang, Z.; Carrière, C.; Seyeux, A.; Zanna, S.; Mercier, D.; Marcus, P.; J. Electrochem. Soc. 2021, 168, 041503. [Crossref]
» Crossref -
14 Li, Z.; Wang, L.; Li, Y.; Feng, Y.; Feng, W.; Mater. Chem. Front. 2019, 3, 2571. [Crossref]
» Crossref -
15 Henderson, J. D.; Li, X.; Shoesmith, D. W.; Noël, J. J.; Ogle, K.; Corros. Sci. 2019, 147, 32. [Crossref]
» Crossref -
16 Lee, J. B.; Mater. Chem. Phys. 2006, 99, 224. [Crossref]
» Crossref -
17 Huang, P.-C.; Hou, K.-H.; Wang, G.-L.; Chen, M.-L.; Wang, J.-R.; Int. J. Electrochem. Sci. 2015, 10, 4972. [Crossref]
» Crossref -
18 Maurice, V.; Marcus, P.; npj Mater. Degrad. 2024, 8, 3. [Crossref]
» Crossref -
19 Rajeswari, S.; Suresh Kumar Danadurai, K.; Sridhar, T. M.; Narasimhan, S. V.; Corrosion 2001, 57, 465. [Crossref]
» Crossref -
20 Bao, Q.; Zheng, W.; Chen, L.; Xu, Z.; Han, J.; Zhu, C.; Colloids Surf., A 2022, 636, 128128. [Crossref]
» Crossref -
21 Wang, M.; Yang, Z.; Zhang, C.; Liu, D.; Trans. Nonferrous Met. Soc. China 2013, 23, 3629. [Crossref]
» Crossref -
22 Xu, C.; Li, B.; Liu, Z.; Yuan, Z.; Zhang, Z.; Chen, S.; Ceram. Int. 2022, 48, 37102. [Crossref]
» Crossref -
23 Shetty, A. R.; Hegde, A. C.; Chem. Papers 2023, 77, 4399. [Crossref]
» Crossref -
24 He, X.; Hu, Z.; Guo, R.; Li, Y.; Wu, L.; J. Alloys Compd. 2023, 953, 170190. [Crossref]
» Crossref -
25 Bigos, A.; Beltowska-Lehman, E.; Kot, M.; Surf. Coat. Technol. 2017, 317, 103. [Crossref]
» Crossref -
26 To, D. T.; Park, S. H.; Kim, M. J.; Cho, H. S.; Myung, N. V.; Front. Chem. 2022, 10, 942423. [Crossref]
» Crossref -
27 Beltowska-Lehman, E.; Indyka, P.; Thin Solid Films 2012, 520, 2046. [Crossref]
» Crossref - 28 Vinila, V. S.; Isac, J. In Design, Fabrication, and Characterization of Multifunctional Nanomaterials; Elsevier: Amsterdam, 2022, ch. 12.
-
29 Podlaha, E. J.; Landolt, D.; J. Electrochem. Soc. 1996, 143, 885. [Crossref]
» Crossref -
30 Hu, Z. R.; Li, D. D.; Kim, T. H.; Kim, M. S.; Xu, T.; Ma, M. G.; Choi, S. E.; Si, C.; Front. Chem. 2022, 10, 841956. [Crossref]
» Crossref -
31 Mohanty, U. S.; Tripathy, B. C.; Singh, P.; Das, S. C.; Misra, V. N.; J. Appl. Electrochem. 2008, 38, 239. [Crossref]
» Crossref -
32 Allahyarzadeh, M. H.; Roozbehani, B.; Ashrafi, A.; Shadizadeh, S. R.; Surf. Coat. Technol. 2011, 206, 137. [Crossref]
» Crossref -
33 Chassaing, E.; Portail, N.; Levy, A.; Wang, G.; J. Appl. Electrochem. 2004, 34, 1085. [Crossref]
» Crossref -
34 Liu, J. H.; Pei, Z. L.; Shi, W. B.; Liu, Y. D.; Gong, J.; Sun, C.; Surf. Coat. Technol. 2020, 385, 125451. [Crossref]
» Crossref -
35 Mosayebi, S.; Rezaei, M.; Mahidashti, Z.; Colloids Surf., A 2020, 594, 124654. [Crossref]
» Crossref -
36 McMahon, G.; Erb, U.; J. Mater. Sci. Lett. 1989, 8, 865. [Crossref]
» Crossref -
37 Han, L.; Jeurgens, L. P. H.; Cancellieri, C.; Wang, J.; Xu, Y.; Huang, Y.; Liu, Y.; Wang, Z.; Acta Mater. 2020, 200, 857. [Crossref]
» Crossref -
38 Surani Yancheshmeh, H.; Ghorbani, M.; Surf. Coat. Technol. 2014, 238, 158. [Crossref]
» Crossref -
39 Liu, J. H.; Li, W. H.; Pei, Z. L.; Gong, J.; Sun, C.; Mater. Charact. 2020, 167, 110532. [Crossref]
» Crossref -
40 Lammel, P.; Rafailovic, L. D.; Kolb, M.; Pohl, K.; Whitehead, A. H.; Grundmeier, G.; Gollas, B.; Surf. Coat. Technol. 2012, 206, 2545. [Crossref]
» Crossref -
41 Ha, H.-Y.; Lee, T.-H.; Bae, J.-H.; Chun, D. W.; Metals 2018, 8, 653. [Crossref]
» Crossref -
42 Hayes, J. R.; Gray, J. J.; Szmodis, A. W.; Orme, C. A.; Corrosion 2006, 62, 491. [Crossref]
» Crossref -
43 Tobler, W. J.; Virtanen, S.; Corros. Sci. 2006, 48, 1585. [Crossref]
» Crossref -
44 Mesquita, T. J.; Chauveau, E.; Mantel, M.; Nogueira, R. P.; Appl. Surf. Sci. 2013, 270, 90. [Crossref]
» Crossref -
45 Halim, J.; Abdel-Karim, R.; El-Raghy, S.; Nabil, M.; Waheed, A.; J. Nanomater. 2012, 2012, ID 845673. [Crossref]
» Crossref -
46 Huang, P.-C.; Hou, K.-H.; Wang, G.-L.; Chen, M.-L.; Wang, J.-R.; Int. J. Electrochem. Sci. 2015, 10, 4972. [Crossref]
» Crossref -
47 Ullal, Y.; Hegde, A. C.; Int. J. Hydrogen Energy 2014, 39, 10485. [Crossref]
» Crossref -
48 da Costa, J. G. R.; da Rocha, C. L. F.; Lima, L. R. P. A.; Ribeiro, D. V.; de Souza, C. A. C.; Mater. Res. 2022, 25, 139. [Crossref]
» Crossref -
49 Navarro-Flores, E.; Chong, Z.; Omanovic, S.; J. Mol. Catal. A: Chem. 2005, 226, 179. [Crossref]
» Crossref -
50 Pell, W. G.; Conway, B. E.; Marincic, N.; J. Electroanal. Chem. 2000, 491, 9. [Crossref]
» Crossref -
51 Kim, C.-H.; Pyun, S.-I.; Kim, J.-H.; Electrochim. Acta 2003, 48, 3455. [Crossref]
» Crossref -
52 Hitz, C.; Lasia, A.; J. Electroanal. Chem. 2001, 500, 213. [Crossref]
» Crossref -
53 Hirschorn, B.; Orazem, M. E.; Tribollet, B.; Vivier, V.; Frateur, I.; Musiani, M.; J. Electrochem. Soc. 2010, 157, C452. [Crossref]
» Crossref
Edited by
-
Editor handled this article:
Cristiane Luísa Jost (Associate)